Estimated zip code population in 2022: 300 Zip code population in 2010: 349 Zip code population in 2000: 316
Houses and condos: 306 Renter-occupied apartments: 21
% of renters here:
15%
State:
46%
March 2022 cost of living index in zip code 11956: 158.4 (very high, U.S. average is 100)
Land area: 1.3 sq. mi. Water area: 0.1 sq. mi.
Population density: 237 people per square mile
(very low).
OSM Map
General Map
Google Map
MSN Map
OSM Map
General Map
Google Map
MSN Map
OSM Map
General Map
Google Map
MSN Map
OSM Map
General Map
Google Map
MSN Map
Please wait while loading the map...
Real estate property taxes paid for housing units in 2022:
This zip code:
0.7% ($7,251)
New York:
1.5% ($6,180)
Median real estate property taxes paid for housing units with mortgages in 2022: $7,885 (0.7%) Median real estate property taxes paid for housing units with no mortgage in 2022: $6,503 (0.6%)
Business Search- 14 Million verified businesses
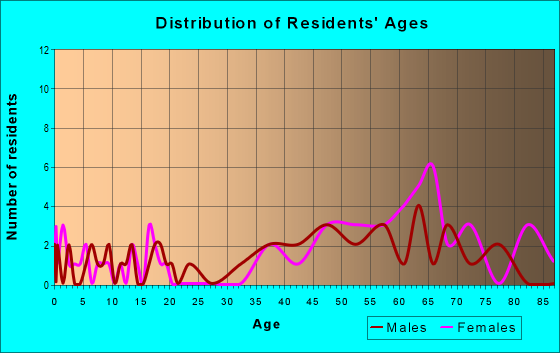
Males: 151
(50.5%)
Females: 148
(49.5%)
For population 25 years and over in 11956:
High school or higher: 99.6%
Bachelor's degree or higher: 64.5%
Graduate or professional degree: 16.6%
Mean travel time to work (commute): 49.0 minutes
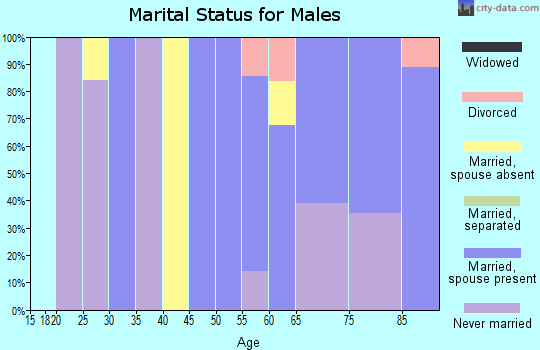
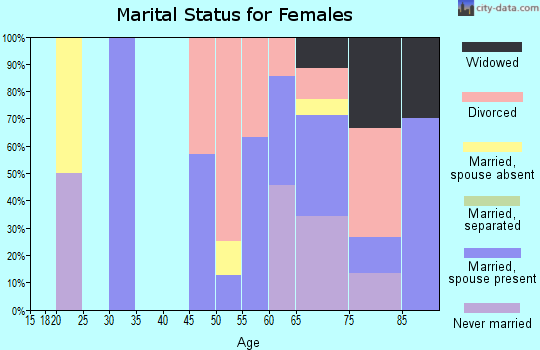
For population 15 years and over in 11956:
Never married: 26.8%
Now married: 60.1%
Separated: 0.0%
Widowed: 6.8%
Divorced: 6.3%
Zip code 11956 compared to state average:
Median house value significantly above state average.
Unemployed percentage significantly below state average.
Black race population percentage significantly below state average.
Hispanic race population percentage below state average.
Median age significantly above state average.
Foreign-born population percentage significantly below state average.
Renting percentage significantly below state average.
Number of rooms per house above state average.
Percentage of population with a bachelor's degree or higher above state average.
Estimated median house/condo value in 2022: $1,052,444
11956:
$1,052,444
New York:
$400,400
Median resident age:
This zip code:
59.8 years
New York median age:
40.0 years
Average household size:
This zip code:
2.0 people
New York:
2.5 people
Averages for the 2004 tax year for zip code 11956, filed in 2005:
Average Adjusted Gross Income (AGI) in 2004: $63,721 (Individual Income Tax Returns)
Here:
$63,721
State:
$59,519
Salary/wage: $49,346 (reported on 61.9% of returns)
Here:
$49,346
State:
$50,673
(% of AGI for various income ranges: 51.5% for AGIs below $10k, 46.7% for AGIs $10k-25k, 58.9% for AGIs $25k-50k, 49.5% for AGIs $50k-75k, 54.1% for AGIs $75k-100k, 43.7% for AGIs over 100k)
Taxable interest for individuals: $1,622 (reported on 66.5% of returns)
This zip code:
$1,622
New York:
$2,377
(% of AGI for various income ranges: 17.2% for AGIs below $10k, 2.0% for AGIs $10k-25k, 0.5% for AGIs $25k-50k, 1.4% for AGIs $50k-75k, 3.2% for AGIs $75k-100k, 1.4% for AGIs over 100k)
Taxable dividends: $6,385 (reported on 44.7% of returns)
Here:
$6,385
State:
$5,394
(% of AGI for various income ranges: 37.3% for AGIs below $10k, 6.4% for AGIs $10k-25k, 5.6% for AGIs $25k-50k, 0.5% for AGIs $75k-100k, 5.1% for AGIs over 100k)
Net capital gain/loss: +$16,974 (reported on 35.8% of returns)
Here:
+$16,974
State:
+$23,581
(% of AGI for various income ranges: -10.4% for AGIs below $10k, -1.3% for AGIs $10k-25k, -1.1% for AGIs $25k-50k, -0.1% for AGIs $75k-100k, 17.4% for AGIs over 100k)
Profit/loss from business: +$11,087 (reported on 21.4% of returns)
Here:
+$11,087
State:
+$13,809
Total itemized deductions: $26,324 (24% of AGI, reported on 47.4% of returns)
Here:
$26,324
State:
$25,864
Here:
24.3% of AGI
State:
21.9% of AGI
(% of AGI for various income ranges: 36.2% for AGIs $10k-25k, 15.9% for AGIs $25k-50k, 12.0% for AGIs $50k-75k, 22.0% for AGIs $75k-100k, 20.1% for AGIs over 100k)
Charity contributions deductions: $3,500 (3% of AGI, reported on 42.8% of returns)
Here:
$3,500
State:
$4,439
Here:
3.1% of AGI
State:
3.6% of AGI
(% of AGI for various income ranges: 10.4% for AGIs below $10k, 2.4% for AGIs $25k-50k, 1.8% for AGIs $50k-75k, 3.5% for AGIs $75k-100k, 2.3% for AGIs over 100k)
Total tax: $11,282 (reported on 80.9% of returns)
11956:
$11,282
State:
$11,730
(% of AGI for various income ranges: 8.2% for AGIs below $10k, 6.6% for AGIs $10k-25k, 8.5% for AGIs $25k-50k, 11.6% for AGIs $50k-75k, 11.8% for AGIs $75k-100k, 17.7% for AGIs over 100k)
Earned income credit: $1,111 (reported on 8.4% of returns)
Here:
$1,111
State:
$1,757
Percentage of individuals using paid preparers for their 2004 taxes: 72.1%
Here:
72%
State:
67%
(% for various income ranges: 66.7% for AGIs below $10k, 72.7% for AGIs $10k-25k, 71.2% for AGIs $25k-50k, 70.8% for AGIs $50k-75k, 78.9% for AGIs $75k-100k, 76.5% for AGIs over 100k)
Size of family households: 58 2-persons, 17 3-persons, 16 4-persons, 1 6-persons
Size of nonfamily households: 53 1-person
17 married couples with children.
10 single-parent households (4 men, 6 women).
95.8% of residents of 11956 zip code speak English at home.
5.2% of residents speak Spanish at home (53% very well, 7% well, 27% not well, 13% not at all).
Foreign born population: 28 (9.4%) (32.2% of them are naturalized citizens)
This zip code:
9.4%
Whole state:
22.7%
36%Costa Rica
21%El Salvador
18%Sweden
18%United Kingdom, excluding England and Scotland
7%Scotland
7%Malaysia
34%American
21%Italian
8%English
7%Irish
6%Norwegian
2%Dutch
2%Eastern European
Year of entry for the foreign-born population
122010 or later
82000 to 2009
01990 to 1999
8Before 1990
Housing units lacking complete plumbing facilities: 6.6% Housing units lacking complete kitchen facilities: 0.6%
51.5%Utility gas
41.0%Fuel oil, kerosene, etc.
5.6%Electricity
2.8%Bottled, tank, or LP gas
Place of birth for U.S.-born residents:
This state: 200
Northeast: 25
Midwest: 11
South: 10
West: 24
79% of the 11956 zip code residents lived in the same house 5 years ago. Out of people who lived in different houses, 76% lived in this county. Out of people who lived in different counties, 50% lived in New York.
97% of the 11956 zip code residents lived in the same house 1 year ago. Out of people who lived in different houses, 43% moved from different county within same state. Out of people who lived in different houses, 57% moved from different state.
Private vs. public school enrollment:
Students in private schools in grades 1 to 8 (elementary and middle school):
Here:
0.0%
New York:
15.6%
Students in private schools in grades 9 to 12 (high school):
Here:
0.0%
New York:
15.0%
Students in private undergraduate colleges: 28
Here:
100.0%
New York:
39.2%
Occupation by median earnings in the past 12 months ($)
223,952Business and financial operations occupations
167,236Management occupations
40,284Food preparation and serving related occupations
Top industries in this zip code by the number of employees in 2005:
Accommodation and Food Services: Full-Service Restaurants (20-49 employees: 1 establishment)
Arts, Entertainment, and Recreation: Marinas (10-19: 1)
Construction: Plumbing, Heating, and Air-Conditioning Contractors (1-4: 1)
Construction: Masonry Contractors (1-4: 1)
Construction: Painting and Wall Covering Contractors (1-4: 1)
Professional, Scientific, and Technical Services: Computer Systems Design Services (1-4: 1)
Arts, Entertainment, and Recreation: Fitness and Recreational Sports Centers (1-4: 1)
Administrative and Support and Waste Management and Remediation Services: All Other Support Services (1-4: 1)
Construction: Framing Contractors (1-4: 1)
Construction: Electrical Contractors (1-4: 1)
Home Mortgage Disclosure Act Aggregated Statistics For Year 2009 (Based on 4 partial tracts)
A) FHA, FSA/RHS & VA Home Purchase Loans
B) Conventional Home Purchase Loans
C) Refinancings
D) Home Improvement Loans
F) Non-occupant Loans on < 5 Family Dwellings (A B C & D)
Number
Average Value
Number
Average Value
Number
Average Value
Number
Average Value
Number
Average Value
LOANS ORIGINATED
1
$188,990
3
$453,393
14
$313,129
2
$100,940
6
$367,778
APPLICATIONS APPROVED, NOT ACCEPTED
0
$0
1
$303,920
2
$312,890
0
$0
1
$395,380
APPLICATIONS DENIED
0
$0
0
$0
8
$391,902
1
$75,210
3
$366,317
APPLICATIONS WITHDRAWN
0
$0
0
$0
4
$325,982
1
$77,920
1
$293,730
FILES CLOSED FOR INCOMPLETENESS
0
$0
0
$0
1
$421,700
0
$0
0
$0
Aggregated Statistics For Year 2008 (Based on 4 partial tracts)
B) Conventional Home Purchase Loans
C) Refinancings
D) Home Improvement Loans
F) Non-occupant Loans on < 5 Family Dwellings (A B C & D)
Number
Average Value
Number
Average Value
Number
Average Value
Number
Average Value
LOANS ORIGINATED
5
$398,842
9
$314,416
1
$168,600
4
$511,000
APPLICATIONS APPROVED, NOT ACCEPTED
0
$0
1
$498,580
0
$0
0
$0
APPLICATIONS DENIED
1
$174,790
5
$334,058
0
$0
1
$249,870
APPLICATIONS WITHDRAWN
1
$259,680
1
$405,190
0
$0
0
$0
FILES CLOSED FOR INCOMPLETENESS
0
$0
0
$0
0
$0
0
$0
Aggregated Statistics For Year 2007 (Based on 4 partial tracts)
B) Conventional Home Purchase Loans
C) Refinancings
D) Home Improvement Loans
F) Non-occupant Loans on < 5 Family Dwellings (A B C & D)
Number
Average Value
Number
Average Value
Number
Average Value
Number
Average Value
LOANS ORIGINATED
8
$423,024
9
$322,213
3
$119,883
6
$527,953
APPLICATIONS APPROVED, NOT ACCEPTED
2
$454,855
2
$440,150
0
$0
1
$963,630
APPLICATIONS DENIED
2
$340,110
5
$378,306
1
$110,290
1
$538,570
APPLICATIONS WITHDRAWN
2
$312,630
3
$426,173
1
$40,120
1
$414,090
FILES CLOSED FOR INCOMPLETENESS
0
$0
1
$429,180
0
$0
1
$129,130
Aggregated Statistics For Year 2006 (Based on 4 partial tracts)
B) Conventional Home Purchase Loans
C) Refinancings
D) Home Improvement Loans
F) Non-occupant Loans on < 5 Family Dwellings (A B C & D)
Number
Average Value
Number
Average Value
Number
Average Value
Number
Average Value
LOANS ORIGINATED
9
$438,629
12
$380,142
5
$179,594
6
$481,020
APPLICATIONS APPROVED, NOT ACCEPTED
1
$379,130
2
$343,655
1
$273,220
1
$243,420
APPLICATIONS DENIED
1
$468,660
5
$346,572
2
$108,620
1
$734,780
APPLICATIONS WITHDRAWN
1
$365,840
4
$292,055
1
$69,270
1
$333,080
FILES CLOSED FOR INCOMPLETENESS
0
$0
2
$451,180
0
$0
0
$0
Aggregated Statistics For Year 2005 (Based on 4 partial tracts)
B) Conventional Home Purchase Loans
C) Refinancings
D) Home Improvement Loans
F) Non-occupant Loans on < 5 Family Dwellings (A B C & D)
Number
Average Value
Number
Average Value
Number
Average Value
Number
Average Value
LOANS ORIGINATED
8
$477,316
17
$286,956
2
$160,155
4
$473,945
APPLICATIONS APPROVED, NOT ACCEPTED
1
$430,730
3
$352,170
1
$29,800
1
$354,750
APPLICATIONS DENIED
2
$529,350
5
$391,334
0
$0
1
$793,610
APPLICATIONS WITHDRAWN
0
$0
6
$309,192
0
$0
0
$0
FILES CLOSED FOR INCOMPLETENESS
1
$360,940
4
$298,378
0
$0
0
$0
Aggregated Statistics For Year 2004 (Based on 4 partial tracts)
B) Conventional Home Purchase Loans
C) Refinancings
D) Home Improvement Loans
F) Non-occupant Loans on < 5 Family Dwellings (A B C & D)
Number
Average Value
Number
Average Value
Number
Average Value
Number
Average Value
LOANS ORIGINATED
8
$410,220
18
$236,149
3
$179,267
5
$450,880
APPLICATIONS APPROVED, NOT ACCEPTED
1
$406,480
4
$237,490
1
$68,500
0
$0
APPLICATIONS DENIED
1
$592,750
5
$259,238
1
$199,820
1
$197,760
APPLICATIONS WITHDRAWN
1
$427,250
4
$279,285
1
$34,440
0
$0
FILES CLOSED FOR INCOMPLETENESS
0
$0
2
$278,380
0
$0
1
$121,780
Aggregated Statistics For Year 2003 (Based on 4 partial tracts)
B) Conventional Home Purchase Loans
C) Refinancings
D) Home Improvement Loans
F) Non-occupant Loans on < 5 Family Dwellings (A B C & D)
Number
Average Value
Number
Average Value
Number
Average Value
Number
Average Value
LOANS ORIGINATED
9
$360,024
34
$241,640
2
$104,685
10
$340,134
APPLICATIONS APPROVED, NOT ACCEPTED
1
$327,530
8
$215,495
1
$107,070
1
$395,640
APPLICATIONS DENIED
1
$226,270
7
$257,760
1
$100,620
1
$334,760
APPLICATIONS WITHDRAWN
1
$205,500
6
$239,445
0
$0
0
$0
FILES CLOSED FOR INCOMPLETENESS
0
$0
1
$405,190
0
$0
1
$179,310
Aggregated Statistics For Year 2002 (Based on 4 partial tracts)
B) Conventional Home Purchase Loans
C) Refinancings
D) Home Improvement Loans
F) Non-occupant Loans on < 5 Family Dwellings (A B C & D)
Number
Average Value
Number
Average Value
Number
Average Value
Number
Average Value
LOANS ORIGINATED
8
$285,945
25
$216,147
5
$67,106
6
$301,087
APPLICATIONS APPROVED, NOT ACCEPTED
1
$311,530
4
$218,365
1
$31,860
1
$169,630
APPLICATIONS DENIED
2
$218,205
5
$238,238
1
$69,010
1
$475,240
APPLICATIONS WITHDRAWN
1
$144,870
5
$167,442
1
$57,400
1
$292,440
FILES CLOSED FOR INCOMPLETENESS
0
$0
2
$174,730
0
$0
0
$0
Aggregated Statistics For Year 2001 (Based on 4 partial tracts)
B) Conventional Home Purchase Loans
C) Refinancings
D) Home Improvement Loans
F) Non-occupant Loans on < 5 Family Dwellings (A B C & D)
Number
Average Value
Number
Average Value
Number
Average Value
Number
Average Value
LOANS ORIGINATED
9
$228,087
17
$194,904
4
$51,310
6
$229,318
APPLICATIONS APPROVED, NOT ACCEPTED
1
$254,130
4
$155,735
0
$0
1
$284,060
APPLICATIONS DENIED
2
$202,270
4
$165,022
1
$16,900
1
$443,890
APPLICATIONS WITHDRAWN
1
$249,230
5
$153,690
1
$32,380
0
$0
FILES CLOSED FOR INCOMPLETENESS
0
$0
1
$208,980
0
$0
0
$0
Aggregated Statistics For Year 2000 (Based on 4 partial tracts)
B) Conventional Home Purchase Loans
C) Refinancings
D) Home Improvement Loans
F) Non-occupant Loans on < 5 Family Dwellings (A B C & D)
Number
Average Value
Number
Average Value
Number
Average Value
Number
Average Value
LOANS ORIGINATED
9
$190,991
6
$136,030
4
$45,408
2
$298,895
APPLICATIONS APPROVED, NOT ACCEPTED
1
$154,670
2
$142,095
0
$0
0
$0
APPLICATIONS DENIED
1
$103,970
2
$321,470
1
$31,600
1
$144,740
APPLICATIONS WITHDRAWN
1
$150,800
3
$109,177
1
$25,280
0
$0
FILES CLOSED FOR INCOMPLETENESS
0
$0
0
$0
0
$0
0
$0
Aggregated Statistics For Year 1999 (Based on 2 partial tracts)
B) Conventional Home Purchase Loans
C) Refinancings
D) Home Improvement Loans
F) Non-occupant Loans on < 5 Family Dwellings (A B C & D)


 Nearest zip codes: 11935, 11958, 11968, 11952, 11948, 11971.