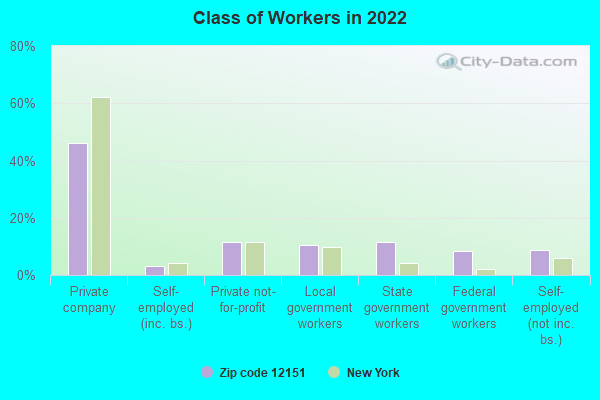
Estimated zip code population in 2022: 857 Zip code population in 2010: 708 Zip code population in 2000: 706
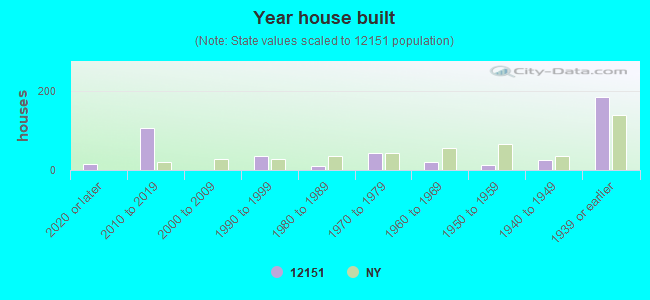
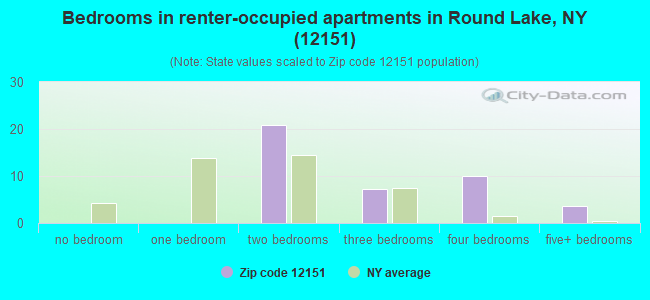
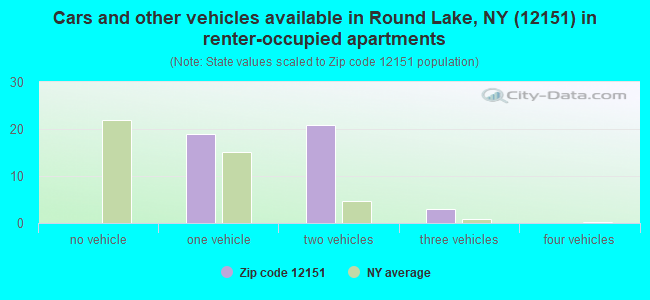
Houses and condos: 437 Renter-occupied apartments: 43
% of renters here:
11%
State:
46%
March 2022 cost of living index in zip code 12151: 107.5 (more than average, U.S. average is 100)
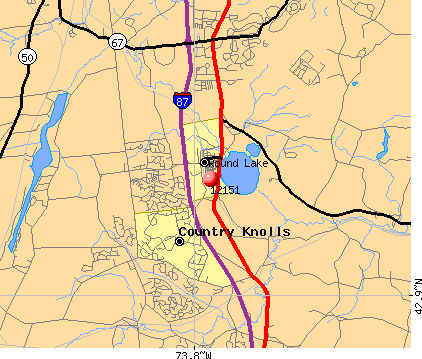
Land area: 2.6 sq. mi. Water area: 0.1 sq. mi.
Population density: 331 people per square mile
(very low).
OSM Map
General Map
Google Map
MSN Map
OSM Map
General Map
Google Map
MSN Map
OSM Map
General Map
Google Map
MSN Map
OSM Map
General Map
Google Map
MSN Map
Please wait while loading the map...
Real estate property taxes paid for housing units in 2022:
This zip code:
2.0% ($5,756)
New York:
1.5% ($6,180)
Median real estate property taxes paid for housing units with mortgages in 2022: $5,977 (2.1%) Median real estate property taxes paid for housing units with no mortgage in 2022: $4,964 (1.6%)
Business Search- 14 Million verified businesses
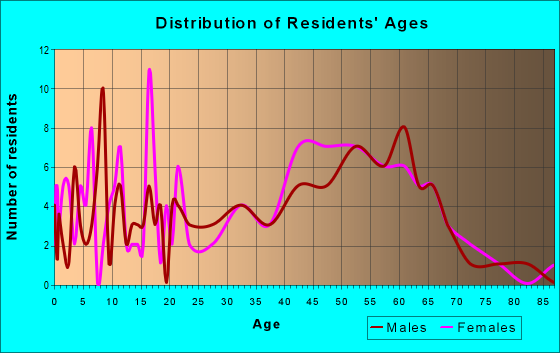
Males: 423
(49.4%)
Females: 433
(50.6%)
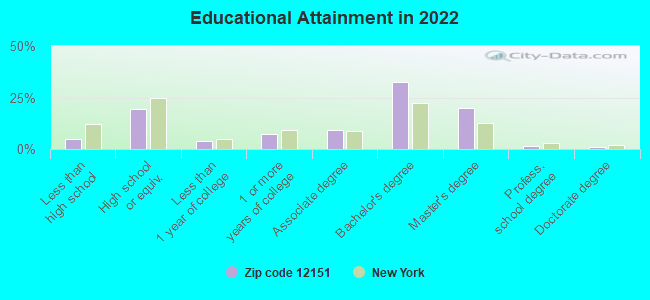
For population 25 years and over in 12151:
High school or higher: 95.8%
Bachelor's degree or higher: 55.4%
Graduate or professional degree: 22.8%
Unemployed: 2.2%
Mean travel time to work (commute): 22.1 minutes
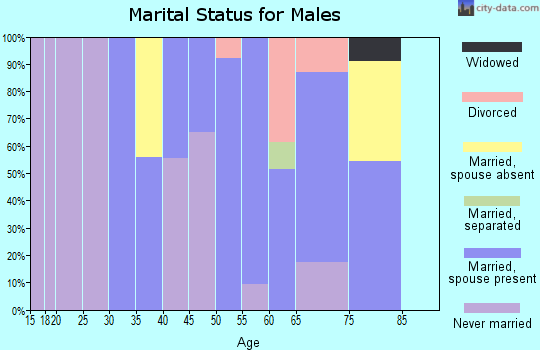
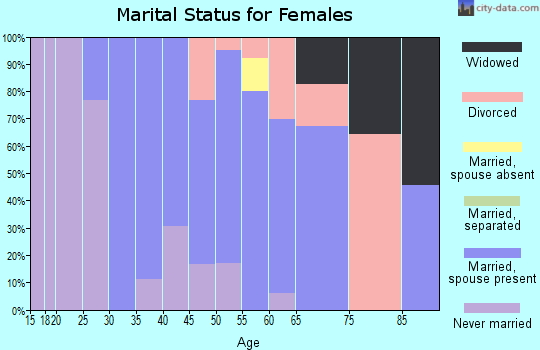
For population 15 years and over in 12151:
Never married: 20.0%
Now married: 58.8%
Separated: 3.1%
Widowed: 2.7%
Divorced: 15.4%
Zip code 12151 compared to state average:
Unemployed percentage below state average.
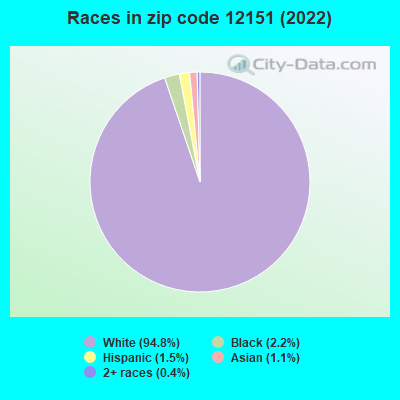
Black race population percentage significantly below state average.
Hispanic race population percentage significantly below state average.
Median age above state average.
Foreign-born population percentage significantly below state average.
Renting percentage significantly below state average.
Length of stay since moving in below state average.
Number of rooms per house above state average.
Number of college students below state average.
Percentage of population with a bachelor's degree or higher above state average.
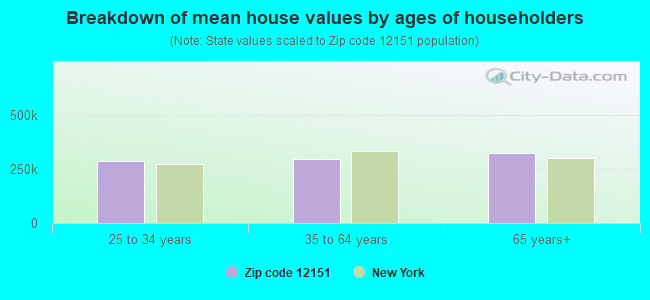
Estimated median house/condo value in 2022: $292,404
12151:
$292,404
New York:
$400,400
According to our research of New York and other state lists, there was 1 registered sex offender living in 12151 zip code as of April 24, 2024. The ratio of all residents to sex offenders in zip code 12151 is 669 to 1.
Median resident age:
This zip code:
47.3 years
New York median age:
40.0 years
Average household size:
This zip code:
2.2 people
New York:
2.5 people
Averages for the 2020 tax year for zip code 12151, filed in 2021:
Average Adjusted Gross Income (AGI) in 2020: $86,191 (Individual Income Tax Returns)
Here:
$86,191
State:
$90,930
Salary/wage: $66,474 (reported on 79.6% of returns)
Here:
$66,474
State:
$72,104
(% of AGI for various income ranges: 1212.9% for AGIs below $25k, 3408.6% for AGIs $25k-50k, 5678.3% for AGIs $50k-75k, 8697.5% for AGIs $75k-100k, 15918.8% for AGIs $100k-200k)
Taxable interest for individuals: $803 (reported on 53.7% of returns)
This zip code:
$803
New York:
$3,075
(% of AGI for various income ranges: 10.0% for AGIs below $25k, 8.6% for AGIs $25k-50k, 6.7% for AGIs $50k-75k, 62.5% for AGIs $75k-100k, 180.0% for AGIs $100k-200k)
Ordinary dividends: $2,926 (reported on 35.2% of returns)
Here:
$2,926
State:
$11,095
(% of AGI for various income ranges: 60.0% for AGIs below $25k, 70.0% for AGIs $25k-50k, 31.7% for AGIs $50k-75k, 207.5% for AGIs $75k-100k, 320.0% for AGIs $100k-200k)
Net capital gain/loss in AGI: +$7,960 (reported on 27.8% of returns)
Here:
+$7,960
State:
+$44,925
(% of AGI for various income ranges: 25.7% for AGIs below $25k, 166.7% for AGIs $50k-75k, 602.5% for AGIs $100k-200k)
Profit/loss from business: +$14,525 (reported on 14.8% of returns)
Here:
+$14,525
State:
+$14,940
(% of AGI for various income ranges: 300.0% for AGIs $50k-75k, 1227.5% for AGIs $100k-200k)
Taxable individual retirement arrangement distribution: $27,729 (reported on 13.0% of returns)
12151:
$27,729
New York:
$19,609
(% of AGI for various income ranges: 255.7% for AGIs below $25k, 940.0% for AGIs $50k-75k, 1497.5% for AGIs $100k-200k)
Total itemized deductions: $23,643 (reported on 13.0% of returns)
Here:
$23,643
State:
$39,326
(% of AGI for various income ranges: 1086.7% for AGIs $50k-75k, 1253.8% for AGIs $100k-200k)
Charity contributions: $3,725 (reported on 7.4% of returns)
Here:
$3,725
State:
$15,420
(% of AGI for various income ranges: 45.7% for AGIs $25k-50k, 146.2% for AGIs $100k-200k)
Taxes paid: $8,900 (reported on 13.0% of returns)
12151:
$8,900
State:
$9,183
(% of AGI for various income ranges: 516.7% for AGIs $50k-75k, 391.2% for AGIs $100k-200k)
Earned income credit: $1,433 (reported on 5.6% of returns)
Here:
$1,433
State:
$2,138
(% of AGI for various income ranges: 61.4% for AGIs below $25k)
Percentage of individuals using paid preparers for their 2020 taxes: 96.3%
Here:
96%
State:
95%
(% for various income ranges: 91.7% for AGIs below $25k, 100.0% for AGIs $25k-50k, 100.0% for AGIs $50k-75k, 85.7% for AGIs $75k-100k, 100.0% for AGIs $100k-200k, 100.0% for AGIs over 200k)
Averages for the 2012 tax year for zip code 12151, filed in 2013:
Average Adjusted Gross Income (AGI) in 2012: $62,054 (Individual Income Tax Returns)
Here:
$62,054
State:
$77,088
Salary/wage: $52,280 (reported on 85.4% of returns)
Here:
$52,280
State:
$60,593
(% of AGI for various income ranges: 78.4% for AGIs below $25k, 71.1% for AGIs $25k-50k, 71.5% for AGIs $50k-75k, 76.5% for AGIs $75k-100k, 69.4% for AGIs $100k-200k)
Taxable interest for individuals: $350 (reported on 53.7% of returns)
This zip code:
$350
New York:
$3,125
(% of AGI for various income ranges: 0.7% for AGIs below $25k, 0.6% for AGIs $25k-50k, 0.2% for AGIs $50k-75k, 0.2% for AGIs $75k-100k, 0.2% for AGIs $100k-200k)
Ordinary dividends: $2,333 (reported on 29.3% of returns)
Here:
$2,333
State:
$10,299
(% of AGI for various income ranges: 3.7% for AGIs $25k-50k, 0.8% for AGIs $50k-75k, 0.5% for AGIs $75k-100k, 0.8% for AGIs $100k-200k)
Net capital gain/loss in AGI: +$1,714 (reported on 17.1% of returns)
Here:
+$1,714
State:
+$42,474
(% of AGI for various income ranges: 4.1% for AGIs $50k-75k, 1.4% for AGIs $100k-200k)
Profit/loss from business: +$5,200 (reported on 17.1% of returns)
Here:
+$5,200
State:
+$16,168
Taxable individual retirement arrangement distribution: $10,000 (reported on 7.3% of returns)
12151:
$10,000
New York:
$17,621
Total itemized deductions: $20,356 (22% of AGI, reported on 43.9% of returns)
Here:
$20,356
State:
$34,985
Here:
21.8% of AGI
State:
21.3% of AGI
(% of AGI for various income ranges: 18.8% for AGIs $25k-50k, 14.8% for AGIs $50k-75k, 13.4% for AGIs $75k-100k, 15.4% for AGIs $100k-200k)
Charity contributions: $1,543 (reported on 34.1% of returns)
Here:
$1,543
State:
$5,572
(% of AGI for various income ranges: 0.5% for AGIs $25k-50k, 0.8% for AGIs $50k-75k, 1.2% for AGIs $75k-100k, 1.0% for AGIs $100k-200k)
Taxes paid: $10,453 (reported on 41.5% of returns)
12151:
$10,453
State:
$18,656
(% of AGI for various income ranges: 7.9% for AGIs $25k-50k, 5.7% for AGIs $50k-75k, 7.1% for AGIs $75k-100k, 8.3% for AGIs $100k-200k)
Earned income credit: $1,500 (reported on 9.8% of returns)
Here:
$1,500
State:
$2,230
(% of AGI for various income ranges: 3.8% for AGIs below $25k)
Percentage of individuals using paid preparers for their 2012 taxes: 48.8%
Here:
49%
State:
66%
(% for various income ranges: 30.8% for AGIs below $25k, 66.7% for AGIs $25k-50k, 62.5% for AGIs $50k-75k, 40.0% for AGIs $75k-100k, 50.0% for AGIs $100k-200k)
Averages for the 2004 tax year for zip code 12151, filed in 2005:
Average Adjusted Gross Income (AGI) in 2004: $44,558 (Individual Income Tax Returns)
Here:
$44,558
State:
$59,519
Salary/wage: $40,932 (reported on 86.6% of returns)
Here:
$40,932
State:
$50,673
(% of AGI for various income ranges: 107.8% for AGIs below $10k, 71.3% for AGIs $10k-25k, 84.0% for AGIs $25k-50k, 78.4% for AGIs $50k-75k, 88.5% for AGIs $75k-100k, 67.7% for AGIs over 100k)
Taxable interest for individuals: $643 (reported on 60.0% of returns)
This zip code:
$643
New York:
$2,377
(% of AGI for various income ranges: 1.7% for AGIs below $10k, 2.7% for AGIs $10k-25k, 0.4% for AGIs $25k-50k, 0.7% for AGIs $50k-75k, 0.8% for AGIs $75k-100k, 0.9% for AGIs over 100k)
Taxable dividends: $1,310 (reported on 30.7% of returns)
Here:
$1,310
State:
$5,394
(% of AGI for various income ranges: 1.4% for AGIs below $10k, 1.0% for AGIs $10k-25k, 0.8% for AGIs $25k-50k, 0.8% for AGIs $50k-75k, 0.7% for AGIs $75k-100k, 1.2% for AGIs over 100k)
Net capital gain/loss: +$3,038 (reported on 22.7% of returns)
Here:
+$3,038
State:
+$23,581
(% of AGI for various income ranges: -0.6% for AGIs $10k-25k, 0.3% for AGIs $25k-50k, 0.1% for AGIs $50k-75k, 1.8% for AGIs $75k-100k, 4.5% for AGIs over 100k)
Profit/loss from business: +$8,254 (reported on 15.4% of returns)
Here:
+$8,254
State:
+$13,809
(% of AGI for various income ranges: 9.9% for AGIs below $10k, 8.7% for AGIs $10k-25k, 4.9% for AGIs $25k-50k, 2.4% for AGIs $50k-75k, 1.8% for AGIs $75k-100k)
IRA payment deduction: $3,091 (reported on 2.4% of returns)
12151:
$3,091
New York:
$3,115
Total itemized deductions: $16,429 (21% of AGI, reported on 35.3% of returns)
Here:
$16,429
State:
$25,864
Here:
21.3% of AGI
State:
21.9% of AGI
(% of AGI for various income ranges: 9.6% for AGIs $10k-25k, 10.2% for AGIs $25k-50k, 13.3% for AGIs $50k-75k, 17.8% for AGIs $75k-100k, 12.5% for AGIs over 100k)
Charity contributions deductions: $1,833 (2% of AGI, reported on 32.5% of returns)
Here:
$1,833
State:
$4,439
Here:
2.3% of AGI
State:
3.6% of AGI
(% of AGI for various income ranges: 1.2% for AGIs $25k-50k, 1.2% for AGIs $50k-75k, 2.0% for AGIs $75k-100k, 1.5% for AGIs over 100k)
Total tax: $5,989 (reported on 81.0% of returns)
12151:
$5,989
State:
$11,730
(% of AGI for various income ranges: 4.4% for AGIs below $10k, 4.8% for AGIs $10k-25k, 8.6% for AGIs $25k-50k, 9.6% for AGIs $50k-75k, 9.5% for AGIs $75k-100k, 18.0% for AGIs over 100k)
Earned income credit: $1,109 (reported on 10.0% of returns)
Here:
$1,109
State:
$1,757
Percentage of individuals using paid preparers for their 2004 taxes: 50.2%
Here:
50%
State:
67%
(% for various income ranges: 39.1% for AGIs below $10k, 50.6% for AGIs $10k-25k, 49.6% for AGIs $25k-50k, 63.2% for AGIs $50k-75k, 44.8% for AGIs $75k-100k, 64.5% for AGIs over 100k)
Likely homosexual households (counted as self-reported same-sex unmarried-partner households)
Lesbian couples: 0.6% of all households
Gay men: 0.0% of all households
Household received Food Stamps/SNAP in the past 12 months: 0 Household did not receive Food Stamps/SNAP in the past 12 months: 385
Women who had a birth in the past 12 months: 31 (24 now married, 7 unmarried) Women who did not have a birth in the past 12 months: 114 (64 now married, 48 unmarried)
Housing units in zip code 12151 with a mortgage: 228 (12 second mortgage, 12 both second mortgage and home equity loan) Houses without a mortgage: 15
Median monthly owner costs for units with a mortgage: $1,836 Median monthly owner costs for units without a mortgage: $820
Residents with income below the poverty level in 2022:
This zip code:
3.1%
Whole state:
14.3%
Residents with income below 50% of the poverty level in 2022:
This zip code:
1.0%
Whole state:
6.8%
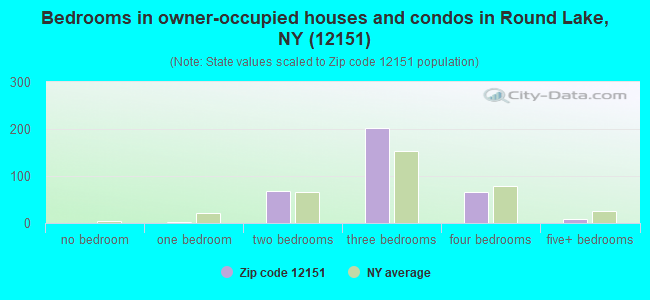
Median number of rooms in houses and condos:
Here:
6.4
State:
6.3
Median number of rooms in apartments:
Here:
6.8
State:
3.8
Notable locations in this zip code not listed on our city pages
Size of family households: 123 2-persons, 32 3-persons, 69 4-persons, 2 5-persons
Size of nonfamily households: 113 1-person, 52 2-persons
141 married couples with children.
11 single-parent households (7 men, 4 women).
96.9% of residents of 12151 zip code speak English at home.
0.9% of residents speak other Indo-European language at home (100% very well).
1.1% of residents speak Asian or Pacific Island language at home (56% very well, 44% well).
0.9% of residents speak other language at home (100% well).
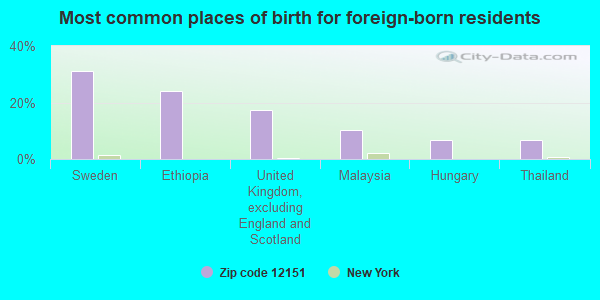
Foreign born population: 29 (3.5%) (80.8% of them are naturalized citizens)
This zip code:
3.5%
Whole state:
22.7%
31%Sweden
24%Ethiopia
17%United Kingdom, excluding England and Scotland
10%Malaysia
7%Hungary
7%Thailand
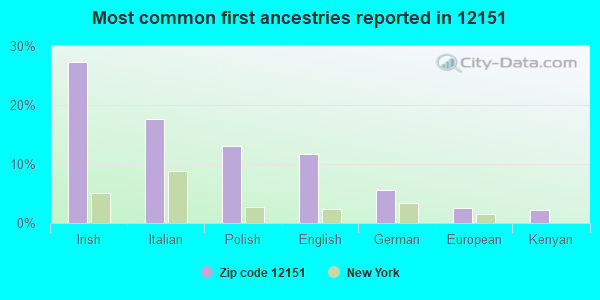
27%Irish
18%Italian
13%Polish
12%English
6%German
2%European
2%Kenyan
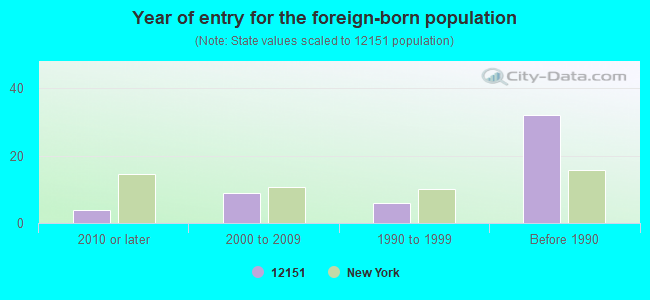
Year of entry for the foreign-born population
42010 or later
92000 to 2009
61990 to 1999
32Before 1990
Facilities with environmental interests located in this zip code:
CROSSROADS SERVICE CENTER (ROUND LAKE RD EXIT 11 I-87 in ROUND LAKE, NY)
(Resource Conservation and Recovery Act (tracking hazardous waste))
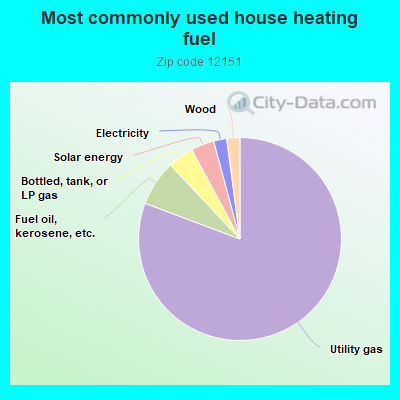
81.3%Utility gas
7.3%Fuel oil, kerosene, etc.
4.2%Bottled, tank, or LP gas
3.7%Solar energy
2.1%Electricity
2.1%Wood
Population in 1990: 451. Population change in the 1990s: +255 (+56.5%).
Place of birth for U.S.-born residents:
This state: 602
Northeast: 97
Midwest: 21
South: 40
West: 41
78% of the 12151 zip code residents lived in the same house 5 years ago. Out of people who lived in different houses, 68% lived in this county. Out of people who lived in different counties, 50% lived in New York.
96% of the 12151 zip code residents lived in the same house 1 year ago. Out of people who lived in different houses, 41% moved from this county. Out of people who lived in different houses, 33% moved from different county within same state. Out of people who lived in different houses, 22% moved from different state.
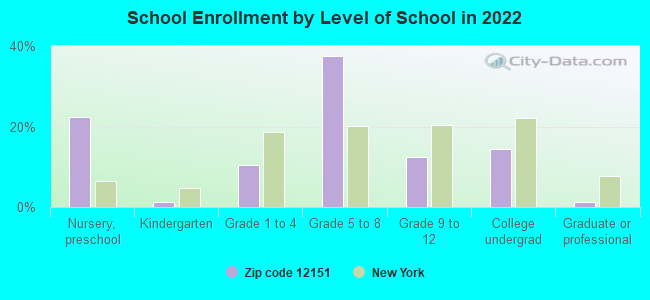
Private vs. public school enrollment:
Students in private schools in grades 1 to 8 (elementary and middle school): 2
Here:
2.7%
New York:
15.6%
Students in private schools in grades 9 to 12 (high school):
Here:
0.0%
New York:
15.0%
Students in private undergraduate colleges: 8
Here:
38.9%
New York:
39.2%
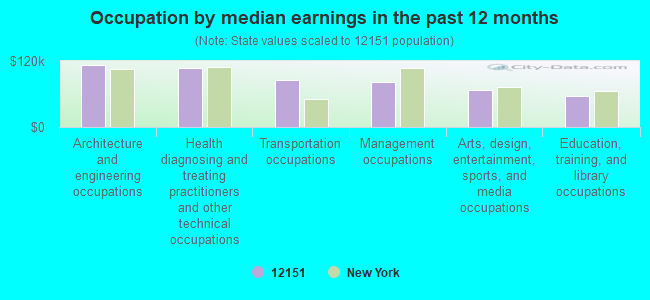
Occupation by median earnings in the past 12 months ($)
112,101Architecture and engineering occupations
107,638Health diagnosing and treating practitioners and other technical occupations
86,076Transportation occupations
81,955Management occupations
67,674Arts, design, entertainment, sports, and media occupations
55,907Education, training, and library occupations
Companies with federal contracts located in this zip code:
V R S SALES LTD (183 USHERS RD in ROUND LAKE, NY; small business) : $40,946 in 5 contractsfrom 2003 to 2006
Contracts for Clothing, Special Purpose, Fire Fighting Equipment, Chain and Wire Rope, Hose and Flexible Tubing by Army Signed by year:2000: $0; 2001: $0; 2002: $0; 2003: $8,672; 2004: $23,410; 2005: $4,290; 2006: $4,574.
Biggest contracts:
$13,860 with Army for Clothing, Special Purpose. Signed on 2004-01-12. Completion date: 2004-01-26.
$9,550, same as above.Signed on 2004-08-23. Completion date: 2004-08-25.
$8,672 with Army for Fire Fighting Equipment. Signed on 2003-02-10. Completion date: 2003-02-14.
$4,574 with Army for Chain and Wire Rope. Signed on 2006-04-28. Completion date: 2006-05-15.
Top industries in this zip code by the number of employees in 2005:
Wholesale Trade: Beer and Ale Merchant Wholesalers (20-49 employees: 1 establishment)
Information: Periodical Publishers (20-49: 1)
Information: Book Publishers (10-19: 1)
Wholesale Trade: Farm and Garden Machinery and Equipment Merchant Wholesalers (10-19: 1)
Accommodation and Food Services: Full-Service Restaurants (10-19: 1)
Wholesale Trade: Metal Service Centers and Other Metal Merchant Wholesalers (10-19: 1)
Construction: Residential Remodelers (5-9: 1)
Wholesale Trade: Drugs and Druggists' Sundries Merchant Wholesalers (5-9: 1)
Health Care and Social Assistance: Offices of Dentists (5-9: 1)
Fatal accident statistics in 2014:
Fatal accident count: 1
Vehicles involved in fatal accidents: 1
Fatal accidents caused by drunken drivers: 0
Fatalities: 1
Persons involved in fatal accidents: 1
Pedestrians involved in fatal accidents: 0
Home Mortgage Disclosure Act Aggregated Statistics For Year 2009 (Based on 4 partial tracts)
A) FHA, FSA/RHS & VA Home Purchase Loans
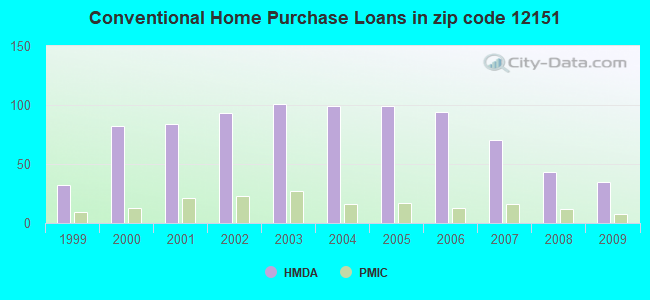
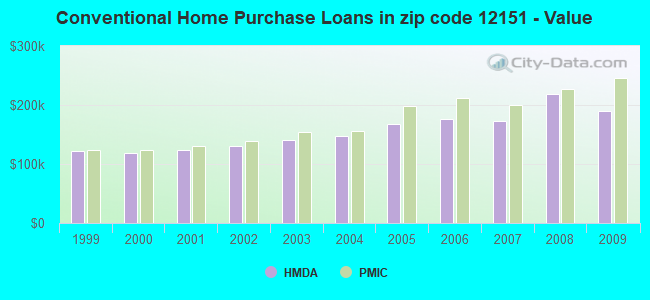
B) Conventional Home Purchase Loans
C) Refinancings
D) Home Improvement Loans
F) Non-occupant Loans on < 5 Family Dwellings (A B C & D)
G) Loans On Manufactured Home Dwelling (A B C & D)
Number
Average Value
Number
Average Value
Number
Average Value
Number
Average Value
Number
Average Value
Number
Average Value
LOANS ORIGINATED
22
$210,679
35
$190,078
111
$181,639
10
$74,797
3
$140,077
2
$106,935
APPLICATIONS APPROVED, NOT ACCEPTED
1
$322,390
3
$123,327
15
$194,695
1
$40,120
0
$0
1
$28,030
APPLICATIONS DENIED
1
$263,420
7
$100,863
25
$199,347
3
$20,870
1
$144,630
4
$39,752
APPLICATIONS WITHDRAWN
1
$286,700
4
$178,940
24
$204,607
3
$51,943
1
$94,660
0
$0
FILES CLOSED FOR INCOMPLETENESS
0
$0
1
$174,590
3
$220,270
0
$0
0
$0
0
$0
Aggregated Statistics For Year 2008 (Based on 4 partial tracts)
A) FHA, FSA/RHS & VA Home Purchase Loans
B) Conventional Home Purchase Loans
C) Refinancings
D) Home Improvement Loans
F) Non-occupant Loans on < 5 Family Dwellings (A B C & D)
G) Loans On Manufactured Home Dwelling (A B C & D)
Number
Average Value
Number
Average Value
Number
Average Value
Number
Average Value
Number
Average Value
Number
Average Value
LOANS ORIGINATED
12
$189,070
43
$218,655
51
$152,910
17
$50,589
2
$166,995
1
$42,310
APPLICATIONS APPROVED, NOT ACCEPTED
3
$190,617
6
$160,863
10
$190,030
3
$31,443
1
$53,240
1
$63,800
APPLICATIONS DENIED
0
$0
6
$103,350
20
$207,470
9
$23,276
1
$181,110
4
$33,185
APPLICATIONS WITHDRAWN
3
$165,797
2
$201,675
10
$263,798
1
$16,340
0
$0
0
$0
FILES CLOSED FOR INCOMPLETENESS
1
$278,710
1
$324,270
5
$205,384
0
$0
2
$165,965
0
$0
Aggregated Statistics For Year 2007 (Based on 4 partial tracts)
A) FHA, FSA/RHS & VA Home Purchase Loans
B) Conventional Home Purchase Loans
C) Refinancings
D) Home Improvement Loans
F) Non-occupant Loans on < 5 Family Dwellings (A B C & D)
G) Loans On Manufactured Home Dwelling (A B C & D)
Number
Average Value
Number
Average Value
Number
Average Value
Number
Average Value
Number
Average Value
Number
Average Value
LOANS ORIGINATED
7
$173,941
70
$173,473
58
$154,783
19
$55,418
4
$182,695
2
$41,265
APPLICATIONS APPROVED, NOT ACCEPTED
0
$0
9
$138,324
13
$160,510
7
$74,251
0
$0
0
$0
APPLICATIONS DENIED
0
$0
11
$151,069
34
$196,629
8
$41,936
1
$199,590
3
$63,910
APPLICATIONS WITHDRAWN
0
$0
6
$220,902
14
$186,077
1
$54,370
1
$140,880
0
$0
FILES CLOSED FOR INCOMPLETENESS
0
$0
3
$244,330
6
$188,363
0
$0
0
$0
0
$0
Aggregated Statistics For Year 2006 (Based on 4 partial tracts)
A) FHA, FSA/RHS & VA Home Purchase Loans
B) Conventional Home Purchase Loans
C) Refinancings
D) Home Improvement Loans
F) Non-occupant Loans on < 5 Family Dwellings (A B C & D)
G) Loans On Manufactured Home Dwelling (A B C & D)
Number
Average Value
Number
Average Value
Number
Average Value
Number
Average Value
Number
Average Value
Number
Average Value
LOANS ORIGINATED
5
$211,096
94
$176,555
73
$147,599
21
$40,041
7
$117,381
3
$34,803
APPLICATIONS APPROVED, NOT ACCEPTED
0
$0
6
$140,163
21
$136,916
5
$65,436
1
$66,270
0
$0
APPLICATIONS DENIED
0
$0
11
$114,415
24
$163,000
13
$60,565
2
$120,865
2
$36,155
APPLICATIONS WITHDRAWN
0
$0
9
$180,543
24
$151,025
2
$93,080
1
$69,190
0
$0
FILES CLOSED FOR INCOMPLETENESS
0
$0
4
$133,638
12
$214,687
1
$61,890
0
$0
0
$0
Aggregated Statistics For Year 2005 (Based on 4 partial tracts)
A) FHA, FSA/RHS & VA Home Purchase Loans
B) Conventional Home Purchase Loans
C) Refinancings
D) Home Improvement Loans
F) Non-occupant Loans on < 5 Family Dwellings (A B C & D)
G) Loans On Manufactured Home Dwelling (A B C & D)
Number
Average Value
Number
Average Value
Number
Average Value
Number
Average Value
Number
Average Value
Number
Average Value
LOANS ORIGINATED
5
$171,178
99
$167,619
119
$142,869
31
$46,899
8
$129,744
3
$27,927
APPLICATIONS APPROVED, NOT ACCEPTED
0
$0
6
$119,048
15
$134,997
3
$109,713
2
$160,395
2
$41,550
APPLICATIONS DENIED
0
$0
11
$159,066
31
$152,523
14
$70,707
3
$56,427
3
$37,027
APPLICATIONS WITHDRAWN
0
$0
6
$248,148
48
$159,846
6
$142,055
2
$326,060
0
$0
FILES CLOSED FOR INCOMPLETENESS
0
$0
3
$149,667
11
$144,615
1
$202,310
1
$87,320
1
$47,100
Aggregated Statistics For Year 2004 (Based on 4 partial tracts)
A) FHA, FSA/RHS & VA Home Purchase Loans
B) Conventional Home Purchase Loans
C) Refinancings
D) Home Improvement Loans
F) Non-occupant Loans on < 5 Family Dwellings (A B C & D)
G) Loans On Manufactured Home Dwelling (A B C & D)
Number
Average Value
Number
Average Value
Number
Average Value
Number
Average Value
Number
Average Value
Number
Average Value
LOANS ORIGINATED
9
$134,584
99
$148,178
115
$128,556
19
$49,933
11
$101,320
3
$31,887
APPLICATIONS APPROVED, NOT ACCEPTED
0
$0
9
$146,917
14
$156,383
6
$41,100
1
$133,700
1
$35,010
APPLICATIONS DENIED
0
$0
13
$104,339
34
$125,299
8
$34,292
2
$57,285
3
$40,067
APPLICATIONS WITHDRAWN
0
$0
8
$144,082
45
$130,232
4
$62,008
1
$59,160
0
$0
FILES CLOSED FOR INCOMPLETENESS
0
$0
5
$127,134
6
$157,078
1
$38,470
0
$0
0
$0
Aggregated Statistics For Year 2003 (Based on 4 partial tracts)
A) FHA, FSA/RHS & VA Home Purchase Loans
B) Conventional Home Purchase Loans
C) Refinancings
D) Home Improvement Loans
E) Loans on Dwellings For 5+ Families
F) Non-occupant Loans on < 5 Family Dwellings (A B C & D)
Number
Average Value
Number
Average Value
Number
Average Value
Number
Average Value
Number
Average Value
Number
Average Value
LOANS ORIGINATED
11
$121,250
101
$140,936
289
$120,427
11
$37,182
0
$0
8
$100,062
APPLICATIONS APPROVED, NOT ACCEPTED
1
$56,200
7
$142,636
40
$113,631
4
$21,235
0
$0
1
$91,070
APPLICATIONS DENIED
0
$0
12
$89,802
50
$120,788
6
$23,865
0
$0
0
$0
APPLICATIONS WITHDRAWN
1
$117,630
6
$125,882
43
$120,466
3
$57,953
1
$98,210
2
$110,640
FILES CLOSED FOR INCOMPLETENESS
0
$0
2
$143,425
8
$154,332
1
$22,250
0
$0
0
$0
Aggregated Statistics For Year 2002 (Based on 4 partial tracts)
A) FHA, FSA/RHS & VA Home Purchase Loans
B) Conventional Home Purchase Loans
C) Refinancings
D) Home Improvement Loans
F) Non-occupant Loans on < 5 Family Dwellings (A B C & D)
Number
Average Value
Number
Average Value
Number
Average Value
Number
Average Value
Number
Average Value
LOANS ORIGINATED
13
$114,785
93
$129,967
147
$114,476
7
$21,141
5
$59,430
APPLICATIONS APPROVED, NOT ACCEPTED
0
$0
9
$113,483
18
$103,539
3
$39,170
0
$0
APPLICATIONS DENIED
0
$0
13
$75,330
36
$89,772
6
$26,505
2
$76,345
APPLICATIONS WITHDRAWN
1
$77,520
5
$109,318
27
$115,112
3
$51,553
0
$0
FILES CLOSED FOR INCOMPLETENESS
0
$0
1
$95,840
5
$90,036
0
$0
0
$0
Aggregated Statistics For Year 2001 (Based on 4 partial tracts)
A) FHA, FSA/RHS & VA Home Purchase Loans
B) Conventional Home Purchase Loans
C) Refinancings
D) Home Improvement Loans
F) Non-occupant Loans on < 5 Family Dwellings (A B C & D)
Number
Average Value
Number
Average Value
Number
Average Value
Number
Average Value
Number
Average Value
LOANS ORIGINATED
19
$105,146
84
$122,976
106
$113,774
10
$19,685
6
$61,537
APPLICATIONS APPROVED, NOT ACCEPTED
0
$0
5
$116,112
11
$80,123
3
$58,833
0
$0
APPLICATIONS DENIED
1
$59,810
11
$56,703
25
$77,486
4
$18,970
1
$55,850
APPLICATIONS WITHDRAWN
1
$117,340
4
$85,720
14
$94,391
4
$21,315
1
$60,440
FILES CLOSED FOR INCOMPLETENESS
1
$102,400
2
$135,565
5
$100,584
1
$5,920
0
$0
Aggregated Statistics For Year 2000 (Based on 4 partial tracts)
A) FHA, FSA/RHS & VA Home Purchase Loans
B) Conventional Home Purchase Loans
C) Refinancings
D) Home Improvement Loans
F) Non-occupant Loans on < 5 Family Dwellings (A B C & D)
Number
Average Value
Number
Average Value
Number
Average Value
Number
Average Value
Number
Average Value
LOANS ORIGINATED
13
$98,140
82
$118,520
16
$65,734
11
$16,439
2
$65,885
APPLICATIONS APPROVED, NOT ACCEPTED
1
$70,650
6
$105,110
3
$77,680
3
$17,187
1
$24,590
APPLICATIONS DENIED
0
$0
15
$51,969
22
$65,096
10
$27,076
1
$72,420
APPLICATIONS WITHDRAWN
2
$83,845
6
$87,977
15
$82,753
2
$63,645
0
$0
FILES CLOSED FOR INCOMPLETENESS
0
$0
1
$60,340
3
$99,027
0
$0
1
$60,340
Aggregated Statistics For Year 1999 (Based on 2 partial tracts)
A) FHA, FSA/RHS & VA Home Purchase Loans
B) Conventional Home Purchase Loans
C) Refinancings
D) Home Improvement Loans
F) Non-occupant Loans on < 5 Family Dwellings (A B C & D)


 Nearest zip codes: 12065, 12118, 12019, 12148, 12020, 12027.