Estimated zip code population in 2022: 4,210 Zip code population in 2010: 3,975 Zip code population in 2000: 4,225
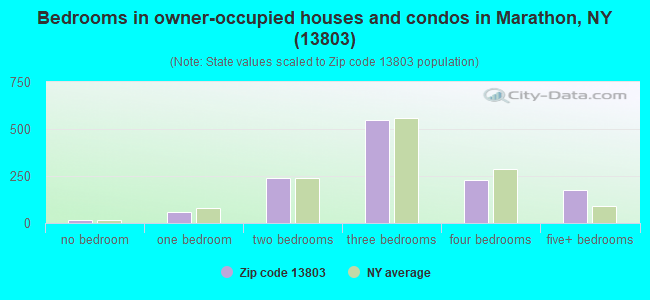
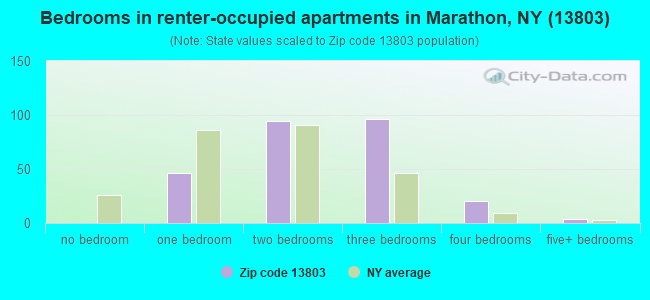
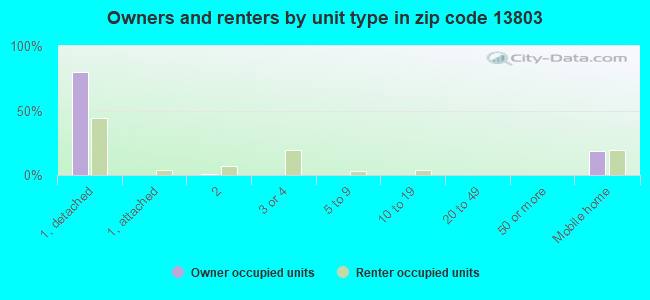
Houses and condos: 1,708 Renter-occupied apartments: 263
% of renters here:
17%
State:
46%
March 2022 cost of living index in zip code 13803: 94.4 (less than average, U.S. average is 100)
Land area: 89.7 sq. mi. Water area: 0.3 sq. mi.
Population density: 47 people per square mile
(very low).
OSM Map
General Map
Google Map
MSN Map
OSM Map
General Map
Google Map
MSN Map
OSM Map
General Map
Google Map
MSN Map
OSM Map
General Map
Google Map
MSN Map
Please wait while loading the map...
Real estate property taxes paid for housing units in 2022:
This zip code:
2.2% ($3,029)
New York:
1.5% ($6,180)
Median real estate property taxes paid for housing units with mortgages in 2022: $3,298 (2.3%) Median real estate property taxes paid for housing units with no mortgage in 2022: $2,655 (2.1%)
Business Search- 14 Million verified businesses
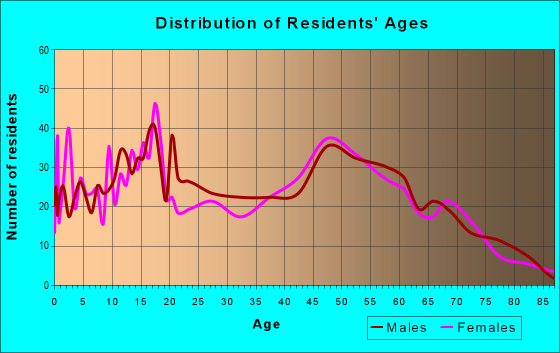
Males: 2,017
(47.9%)
Females: 2,193
(52.1%)
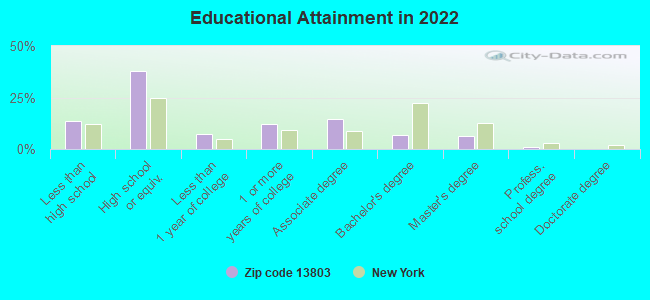
For population 25 years and over in 13803:
High school or higher: 85.2%
Bachelor's degree or higher: 14.3%
Graduate or professional degree: 7.5%
Unemployed: 6.3%
Mean travel time to work (commute): 30.6 minutes
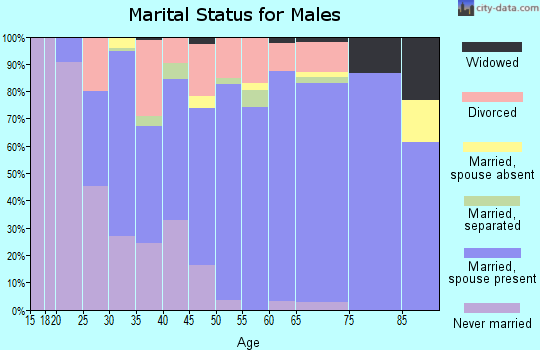
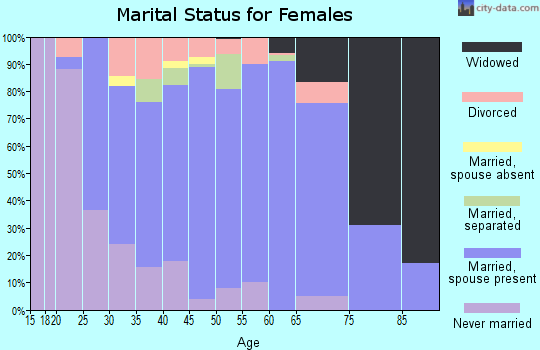
For population 15 years and over in 13803:
Never married: 27.5%
Now married: 54.0%
Separated: 2.8%
Widowed: 5.5%
Divorced: 10.2%
Zip code 13803 compared to state average:
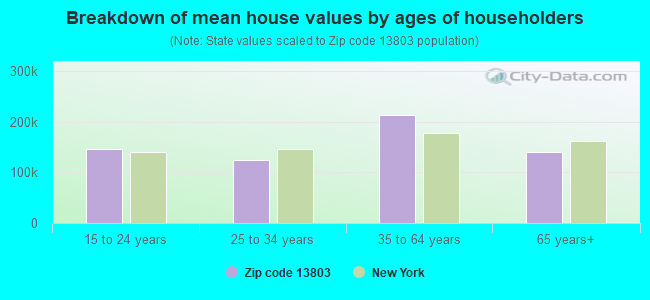
Median house value significantly below state average.
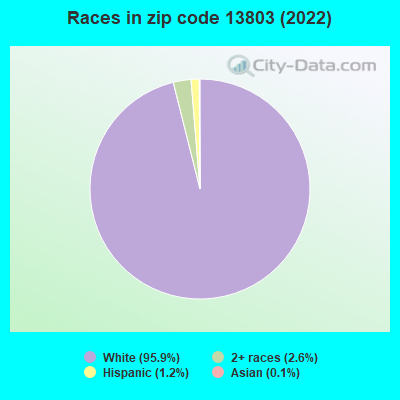
Black race population percentage significantly below state average.
Hispanic race population percentage significantly below state average.
Median age below state average.
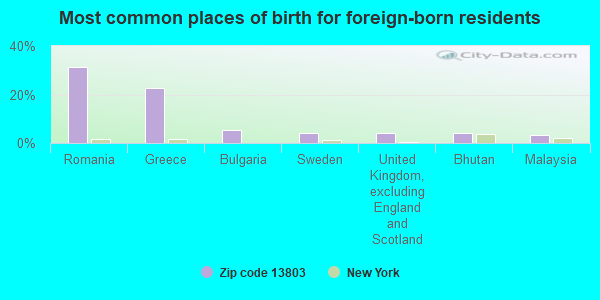
Foreign-born population percentage significantly below state average.
Renting percentage significantly below state average.
Number of rooms per house above state average.
Number of college students below state average.
Percentage of population with a bachelor's degree or higher significantly below state average.
Averages for the 2020 tax year for zip code 13803, filed in 2021:
Average Adjusted Gross Income (AGI) in 2020: $54,240 (Individual Income Tax Returns)
Here:
$54,240
State:
$90,930
Salary/wage: $47,762 (reported on 84.0% of returns)
Here:
$47,762
State:
$72,104
(% of AGI for various income ranges: 1183.7% for AGIs below $25k, 3375.3% for AGIs $25k-50k, 6493.0% for AGIs $50k-75k, 10196.9% for AGIs $75k-100k, 14026.5% for AGIs $100k-200k)
Taxable interest for individuals: $511 (reported on 29.4% of returns)
This zip code:
$511
New York:
$3,075
(% of AGI for various income ranges: 15.3% for AGIs below $25k, 12.9% for AGIs $25k-50k, 10.0% for AGIs $50k-75k, 16.9% for AGIs $75k-100k, 70.6% for AGIs $100k-200k)
Ordinary dividends: $1,650 (reported on 13.9% of returns)
Here:
$1,650
State:
$11,095
(% of AGI for various income ranges: 22.4% for AGIs below $25k, 18.9% for AGIs $25k-50k, 42.6% for AGIs $50k-75k, 16.2% for AGIs $75k-100k, 82.4% for AGIs $100k-200k)
Net capital gain/loss in AGI: +$4,224 (reported on 11.2% of returns)
Here:
+$4,224
State:
+$44,925
(% of AGI for various income ranges: 17.6% for AGIs below $25k, 17.6% for AGIs $25k-50k, 45.7% for AGIs $50k-75k, 132.3% for AGIs $75k-100k, 272.9% for AGIs $100k-200k)
Profit/loss from business: +$15,424 (reported on 13.4% of returns)
Here:
+$15,424
State:
+$14,940
(% of AGI for various income ranges: 88.4% for AGIs below $25k, 254.7% for AGIs $25k-50k, 153.9% for AGIs $50k-75k, 400.8% for AGIs $75k-100k, 881.8% for AGIs $100k-200k)
Taxable individual retirement arrangement distribution: $10,600 (reported on 8.6% of returns)
13803:
$10,600
New York:
$19,609
(% of AGI for various income ranges: 79.2% for AGIs below $25k, 64.9% for AGIs $25k-50k, 194.8% for AGIs $50k-75k, 385.3% for AGIs $100k-200k)
Total itemized deductions: $24,800 (reported on 1.6% of returns)
Here:
$24,800
State:
$39,326
(% of AGI for various income ranges: 323.5% for AGIs $50k-75k)
Charity contributions: $2,600 (reported on 1.1% of returns)
Here:
$2,600
State:
$15,420
(% of AGI for various income ranges: 11.6% for AGIs $25k-50k)
Taxes paid: $9,100 (reported on 1.6% of returns)
13803:
$9,100
State:
$9,183
(% of AGI for various income ranges: 118.7% for AGIs $50k-75k)
Earned income credit: $2,168 (reported on 16.6% of returns)
Here:
$2,168
State:
$2,138
(% of AGI for various income ranges: 72.4% for AGIs below $25k, 88.2% for AGIs $25k-50k)
Percentage of individuals using paid preparers for their 2020 taxes: 96.3%
Here:
96%
State:
95%
(% for various income ranges: 94.4% for AGIs below $25k, 94.8% for AGIs $25k-50k, 96.7% for AGIs $50k-75k, 100.0% for AGIs $75k-100k, 100.0% for AGIs $100k-200k, 100.0% for AGIs over 200k)
Averages for the 2012 tax year for zip code 13803, filed in 2013:
Average Adjusted Gross Income (AGI) in 2012: $41,847 (Individual Income Tax Returns)
Here:
$41,847
State:
$77,088
Salary/wage: $38,908 (reported on 85.6% of returns)
Here:
$38,908
State:
$60,593
(% of AGI for various income ranges: 76.2% for AGIs below $25k, 81.5% for AGIs $25k-50k, 79.1% for AGIs $50k-75k, 84.2% for AGIs $75k-100k, 76.2% for AGIs $100k-200k)
Taxable interest for individuals: $588 (reported on 34.2% of returns)
This zip code:
$588
New York:
$3,125
(% of AGI for various income ranges: 1.0% for AGIs below $25k, 0.5% for AGIs $25k-50k, 0.6% for AGIs $50k-75k, 0.2% for AGIs $75k-100k, 0.3% for AGIs $100k-200k)
Ordinary dividends: $1,311 (reported on 15.0% of returns)
Here:
$1,311
State:
$10,299
(% of AGI for various income ranges: 0.8% for AGIs below $25k, 0.3% for AGIs $25k-50k, 0.4% for AGIs $50k-75k, 0.2% for AGIs $75k-100k, 0.8% for AGIs $100k-200k)
Net capital gain/loss in AGI: +$2,811 (reported on 9.6% of returns)
Here:
+$2,811
State:
+$42,474
(% of AGI for various income ranges: 0.7% for AGIs below $25k, 0.8% for AGIs $25k-50k, 0.9% for AGIs $50k-75k, 0.1% for AGIs $75k-100k, 0.7% for AGIs $100k-200k)
Profit/loss from business: +$7,377 (reported on 13.9% of returns)
Here:
+$7,377
State:
+$16,168
(% of AGI for various income ranges: 6.4% for AGIs below $25k, 3.1% for AGIs $25k-50k, 0.8% for AGIs $50k-75k, 1.5% for AGIs $75k-100k, 2.0% for AGIs $100k-200k)
Taxable individual retirement arrangement distribution: $10,069 (reported on 8.6% of returns)
13803:
$10,069
New York:
$17,621
(% of AGI for various income ranges: 2.2% for AGIs below $25k, 1.9% for AGIs $25k-50k, 1.8% for AGIs $50k-75k, 5.1% for AGIs $75k-100k)
Total itemized deductions: $16,783 (20% of AGI, reported on 19.3% of returns)
Here:
$16,783
State:
$34,985
Here:
20.1% of AGI
State:
21.3% of AGI
(% of AGI for various income ranges: 2.9% for AGIs below $25k, 5.9% for AGIs $25k-50k, 8.0% for AGIs $50k-75k, 8.4% for AGIs $75k-100k, 11.2% for AGIs $100k-200k)
Charity contributions: $2,508 (reported on 12.8% of returns)
Here:
$2,508
State:
$5,572
(% of AGI for various income ranges: 0.5% for AGIs $25k-50k, 0.9% for AGIs $50k-75k, 0.9% for AGIs $75k-100k, 1.2% for AGIs $100k-200k)
Taxes paid: $7,931 (reported on 19.3% of returns)
13803:
$7,931
State:
$18,656
(% of AGI for various income ranges: 2.5% for AGIs $25k-50k, 2.9% for AGIs $50k-75k, 4.5% for AGIs $75k-100k, 6.7% for AGIs $100k-200k)
Earned income credit: $2,276 (reported on 20.3% of returns)
Here:
$2,276
State:
$2,230
(% of AGI for various income ranges: 6.6% for AGIs below $25k, 1.3% for AGIs $25k-50k)
Percentage of individuals using paid preparers for their 2012 taxes: 57.2%
Here:
57%
State:
66%
(% for various income ranges: 55.3% for AGIs below $25k, 57.7% for AGIs $25k-50k, 57.1% for AGIs $50k-75k, 58.8% for AGIs $75k-100k, 64.3% for AGIs $100k-200k)
Averages for the 2004 tax year for zip code 13803, filed in 2005:
Average Adjusted Gross Income (AGI) in 2004: $33,523 (Individual Income Tax Returns)
Here:
$33,523
State:
$59,519
Salary/wage: $31,937 (reported on 87.4% of returns)
Here:
$31,937
State:
$50,673
(% of AGI for various income ranges: 110.3% for AGIs below $10k, 79.2% for AGIs $10k-25k, 83.1% for AGIs $25k-50k, 86.8% for AGIs $50k-75k, 83.3% for AGIs $75k-100k, 74.5% for AGIs over 100k)
Taxable interest for individuals: $685 (reported on 45.0% of returns)
This zip code:
$685
New York:
$2,377
(% of AGI for various income ranges: 6.1% for AGIs below $10k, 1.9% for AGIs $10k-25k, 1.0% for AGIs $25k-50k, 0.3% for AGIs $50k-75k, 0.5% for AGIs $75k-100k, 0.5% for AGIs over 100k)
Taxable dividends: $963 (reported on 17.0% of returns)
Here:
$963
State:
$5,394
(% of AGI for various income ranges: 2.3% for AGIs below $10k, 0.6% for AGIs $10k-25k, 0.4% for AGIs $25k-50k, 0.2% for AGIs $50k-75k, 0.3% for AGIs $75k-100k, 1.4% for AGIs over 100k)
Net capital gain/loss: +$2,406 (reported on 13.2% of returns)
Here:
+$2,406
State:
+$23,581
(% of AGI for various income ranges: 3.4% for AGIs below $10k, 2.0% for AGIs $10k-25k, 1.0% for AGIs $25k-50k, 0.6% for AGIs $50k-75k, 0.8% for AGIs $75k-100k, 0.1% for AGIs over 100k)
Profit/loss from business: +$5,469 (reported on 12.0% of returns)
Here:
+$5,469
State:
+$13,809
(% of AGI for various income ranges: -8.6% for AGIs below $10k, 3.6% for AGIs $10k-25k, 2.8% for AGIs $25k-50k, 1.7% for AGIs $50k-75k, 2.2% for AGIs $75k-100k)
IRA payment deduction: $2,750 (reported on 2.3% of returns)
13803:
$2,750
New York:
$3,115
Total itemized deductions: $14,053 (22% of AGI, reported on 19.6% of returns)
Here:
$14,053
State:
$25,864
Here:
22.0% of AGI
State:
21.9% of AGI
(% of AGI for various income ranges: 4.0% for AGIs $10k-25k, 7.0% for AGIs $25k-50k, 8.1% for AGIs $50k-75k, 11.4% for AGIs $75k-100k, 13.7% for AGIs over 100k)
Charity contributions deductions: $2,075 (3% of AGI, reported on 15.4% of returns)
Here:
$2,075
State:
$4,439
Here:
3.0% of AGI
State:
3.6% of AGI
(% of AGI for various income ranges: 0.3% for AGIs $10k-25k, 0.7% for AGIs $25k-50k, 0.9% for AGIs $50k-75k, 1.4% for AGIs $75k-100k, 1.9% for AGIs over 100k)
Total tax: $3,721 (reported on 69.8% of returns)
13803:
$3,721
State:
$11,730
(% of AGI for various income ranges: 3.1% for AGIs below $10k, 3.8% for AGIs $10k-25k, 6.0% for AGIs $25k-50k, 7.8% for AGIs $50k-75k, 9.9% for AGIs $75k-100k, 14.8% for AGIs over 100k)
Earned income credit: $1,553 (reported on 18.9% of returns)
Here:
$1,553
State:
$1,757
Percentage of individuals using paid preparers for their 2004 taxes: 61.1%
Here:
61%
State:
67%
(% for various income ranges: 52.7% for AGIs below $10k, 64.1% for AGIs $10k-25k, 65.0% for AGIs $25k-50k, 60.6% for AGIs $50k-75k, 60.7% for AGIs $75k-100k, 68.1% for AGIs over 100k)
Household received Food Stamps/SNAP in the past 12 months: 213 Household did not receive Food Stamps/SNAP in the past 12 months: 1,324
Women who had a birth in the past 12 months: 97 (60 now married, 38 unmarried) Women who did not have a birth in the past 12 months: 804 (351 now married, 449 unmarried)
Housing units in zip code 13803 with a mortgage: 703 (61 second mortgage, 55 both second mortgage and home equity loan) Houses without a mortgage: 78
Median monthly owner costs for units with a mortgage: $1,324 Median monthly owner costs for units without a mortgage: $551
Residents with income below the poverty level in 2022:
This zip code:
15.1%
Whole state:
14.3%
Residents with income below 50% of the poverty level in 2022:
This zip code:
11.2%
Whole state:
6.8%
Median number of rooms in houses and condos:
Here:
6.4
State:
6.3
Median number of rooms in apartments:
Here:
5.1
State:
3.8
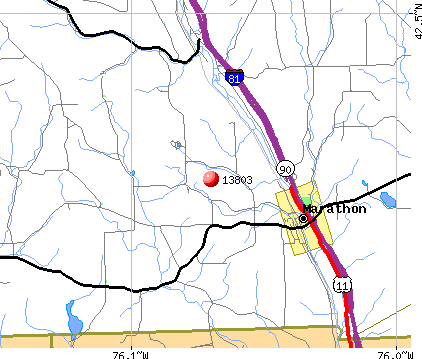
Notable locations in this zip code not listed on our city pages
Notable locations in zip code 13803: Whitney Point Rest Area (A), Maple Hill Golf Club (B), Country Hills Campground (C), Tarbell Building (D), Peck Memorial Library (E), Marathon Town Hall (F), Marathon Fire Department (G), Harford Fire Department (H). Display/hide their locations on the map
Churches in zip code 13803 include: Lapeer Church (A), First Baptist Church (B), Marathon Methodist Church (C), Marathon Presbyterian Church (D), Saint Stephen's Catholic Church (E), Kingdom Hall of Jehovahs Witnesses (F), Church At Freetown (G). Display/hide their locations on the map
Cemeteries: Freetown Cemetery (1), Marathon Cemetery (2), Hunts Corners Cemetery (3), Quail Hill Cemetery (4), Texas Valley Cemetery (5), Parker Street Cemetery (6), Killawog Cemetery (7). Display/hide their locations on the map
In group quarters: 1 (-1 institutionalized population)
Size of family households: 398 2-persons, 319 3-persons, 142 4-persons, 68 5-persons, 20 6-persons, 126 7-or-more-persons
Size of nonfamily households: 346 1-person, 101 2-persons, 12 3-persons
690 married couples with children.
416 single-parent households (197 men, 219 women).
94.4% of residents of 13803 zip code speak English at home.
0.2% of residents speak Spanish at home (100% very well).
5.1% of residents speak other Indo-European language at home (61% very well, 34% well, 4% not well, 1% not at all).
0.2% of residents speak Asian or Pacific Island language at home (67% very well, 33% well).
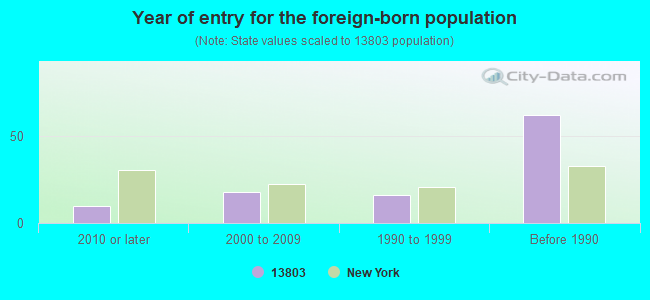
Foreign born population: 94 (2.2%) (74.7% of them are naturalized citizens)
This zip code:
2.2%
Whole state:
22.7%
31%Romania
23%Greece
5%Bulgaria
4%Sweden
4%United Kingdom, excluding England and Scotland
4%Bhutan
3%Malaysia
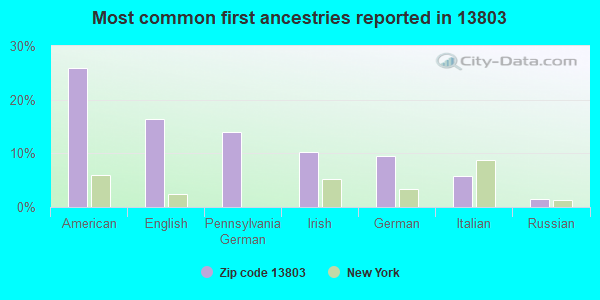
26%American
16%English
14%Pennsylvania German
10%Irish
10%German
6%Italian
2%Russian
Year of entry for the foreign-born population
102010 or later
182000 to 2009
161990 to 1999
62Before 1990
Facilities with environmental interests located in this zip code:
AGWAY ENERGY PRODUCTS (14 W MAIN ST in MARATHON, NY)
(Resource Conservation and Recovery Act (tracking hazardous waste))
GRUMMAN BOATS DIV OF GRUMMAN ALLIED (20 FRONT ST in MARATHON, NY)
(Resource Conservation and Recovery Act (tracking hazardous waste)) Business NAICS classification: AIRCRAFT MANUFACTURING.; BOAT BUILDING.
CORTLAND CO DEPT OF HIGHWAYS BIN 3207420 (COLD SPRINGS RD OVER MERRILL in MARATHON, NY)
Small Quantity Generators, between 100 kg and 1000 kg of hazardous waste/month (Resource Conservation and Recovery Act (tracking hazardous waste)) - notification
Housing units lacking complete plumbing facilities: 2.8% Housing units lacking complete kitchen facilities: 3.4%
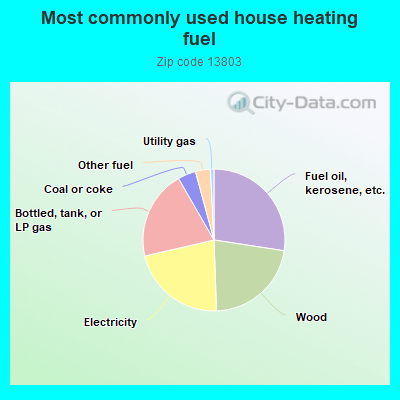
27.4%Fuel oil, kerosene, etc.
22.0%Wood
21.9%Electricity
20.3%Bottled, tank, or LP gas
4.1%Coal or coke
3.4%Other fuel
0.8%Utility gas
Population in 1990: 3,586. Population change in the 1990s: +639 (+17.8%).
Place of birth for U.S.-born residents:
This state: 3,445
Northeast: 402
Midwest: 87
South: 107
West: 44
66% of the 13803 zip code residents lived in the same house 5 years ago. Out of people who lived in different houses, 61% lived in this county. Out of people who lived in different counties, 50% lived in New York.
94% of the 13803 zip code residents lived in the same house 1 year ago. Out of people who lived in different houses, 65% moved from this county. Out of people who lived in different houses, 25% moved from different county within same state. Out of people who lived in different houses, 7% moved from different state.
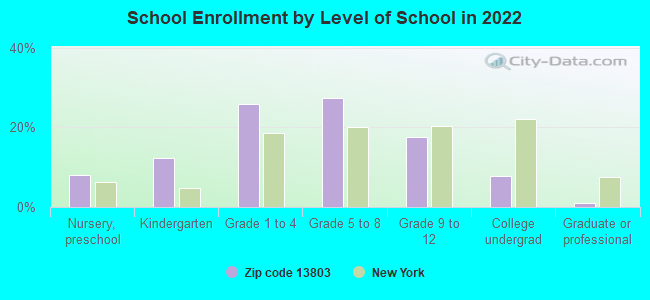
Private vs. public school enrollment:
Students in private schools in grades 1 to 8 (elementary and middle school): 90
Here:
17.1%
New York:
15.6%
Students in private schools in grades 9 to 12 (high school): 25
Here:
14.6%
New York:
15.0%
Students in private undergraduate colleges: 7
Here:
10.2%
New York:
39.2%
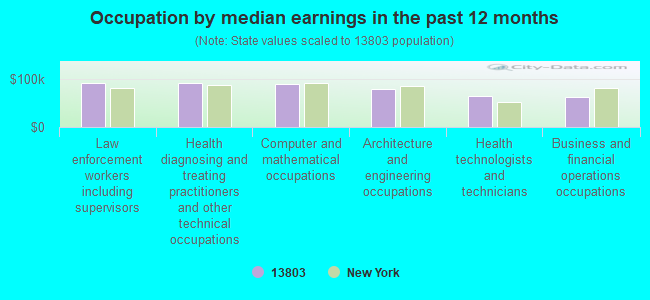
Occupation by median earnings in the past 12 months ($)
91,150Law enforcement workers including supervisors
90,304Health diagnosing and treating practitioners and other technical occupations
89,815Computer and mathematical occupations
77,752Architecture and engineering occupations
64,455Health technologists and technicians
61,189Business and financial operations occupations
Companies with federal contracts located in this zip code:
E L WOOD BRAIDING CO, INC (542 RT 11 in MARATHON, NY; small business) : $1,862,279 in 14 contractsfrom 2001 to 2005
Contracts for Fiber Rope, Cordage, and Twine by Defense Logistics Agency Signed by year:2000: $0; 2001: $1,125,860; 2002: $599,078; 2003: $27,664; 2004: $51,836; 2005: $57,841; 2006: $0.
Biggest contracts:
$996,450 with Defense Logistics Agency for Fiber Rope, Cordage, and Twine. Signed on 2001-01-22. Completion date: 2001-01-22.
$418,950, same as above.Signed on 2002-03-22. Completion date: 2002-10-15.
$99,090, same as above.Signed on 2001-09-28. Completion date: 2001-12-22.
$96,322, same as above.Signed on 2002-02-20. Completion date: 2002-04-22.
Top industries in this zip code by the number of employees in 2005:
Accommodation and Food Services: Snack and Nonalcoholic Beverage Bars (50-99 employees: 1 establishment)
Health Care and Social Assistance: All Other Outpatient Care Centers (20-49: 1)
Accommodation and Food Services: Full-Service Restaurants (5-9: 3, 1-4: 1)
Other Services (except Public Administration): Religious Organizations (10-19: 1, 5-9: 1)
Accommodation and Food Services: Hotels (except Casino Hotels) and Motels (10-19: 1)
Fatal accident statistics in 2014:
Fatal accident count: 1
Vehicles involved in fatal accidents: 2
Fatal accidents caused by drunken drivers: 0
Fatalities: 1
Persons involved in fatal accidents: 1
Pedestrians involved in fatal accidents: 0
Home Mortgage Disclosure Act Aggregated Statistics For Year 2009 (Based on 2 partial tracts)
A) FHA, FSA/RHS & VA Home Purchase Loans
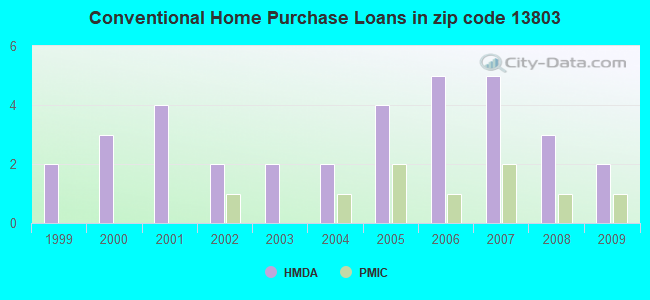
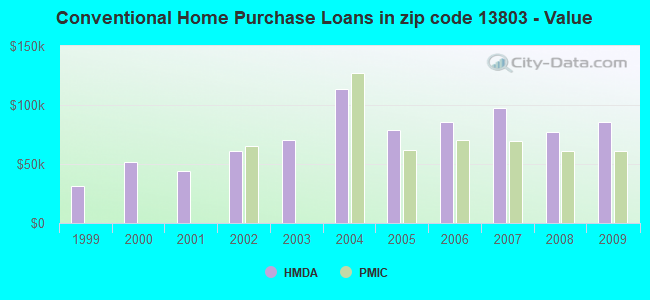
B) Conventional Home Purchase Loans
C) Refinancings
D) Home Improvement Loans
F) Non-occupant Loans on < 5 Family Dwellings (A B C & D)
G) Loans On Manufactured Home Dwelling (A B C & D)
Number
Average Value
Number
Average Value
Number
Average Value
Number
Average Value
Number
Average Value
Number
Average Value
LOANS ORIGINATED
2
$94,540
2
$85,905
4
$111,640
2
$45,055
0
$0
1
$29,220
APPLICATIONS APPROVED, NOT ACCEPTED
0
$0
0
$0
1
$30,550
0
$0
0
$0
1
$67,310
APPLICATIONS DENIED
1
$73,730
0
$0
3
$49,593
1
$9,520
1
$21,250
1
$39,410
APPLICATIONS WITHDRAWN
0
$0
1
$23,250
2
$128,080
0
$0
0
$0
0
$0
FILES CLOSED FOR INCOMPLETENESS
0
$0
0
$0
0
$0
0
$0
0
$0
0
$0
Aggregated Statistics For Year 2008 (Based on 2 partial tracts)
A) FHA, FSA/RHS & VA Home Purchase Loans
B) Conventional Home Purchase Loans
C) Refinancings
D) Home Improvement Loans
G) Loans On Manufactured Home Dwelling (A B C & D)
Number
Average Value
Number
Average Value
Number
Average Value
Number
Average Value
Number
Average Value
LOANS ORIGINATED
1
$117,560
3
$76,973
4
$78,818
2
$18,600
2
$57,785
APPLICATIONS APPROVED, NOT ACCEPTED
0
$0
0
$0
1
$123,100
0
$0
0
$0
APPLICATIONS DENIED
0
$0
1
$43,620
4
$84,520
3
$23,983
1
$63,980
APPLICATIONS WITHDRAWN
0
$0
0
$0
1
$124,430
1
$27,900
0
$0
FILES CLOSED FOR INCOMPLETENESS
0
$0
0
$0
0
$0
0
$0
0
$0
Aggregated Statistics For Year 2007 (Based on 2 partial tracts)
A) FHA, FSA/RHS & VA Home Purchase Loans
B) Conventional Home Purchase Loans
C) Refinancings
D) Home Improvement Loans
G) Loans On Manufactured Home Dwelling (A B C & D)
Number
Average Value
Number
Average Value
Number
Average Value
Number
Average Value
Number
Average Value
LOANS ORIGINATED
1
$115,570
5
$97,858
4
$82,692
3
$28,190
2
$68,855
APPLICATIONS APPROVED, NOT ACCEPTED
0
$0
0
$0
1
$68,860
0
$0
0
$0
APPLICATIONS DENIED
0
$0
2
$58,120
5
$75,764
1
$29,890
2
$50,035
APPLICATIONS WITHDRAWN
0
$0
0
$0
2
$67,640
0
$0
0
$0
FILES CLOSED FOR INCOMPLETENESS
0
$0
0
$0
0
$0
0
$0
0
$0
Aggregated Statistics For Year 2006 (Based on 2 partial tracts)
B) Conventional Home Purchase Loans
C) Refinancings
D) Home Improvement Loans
F) Non-occupant Loans on < 5 Family Dwellings (A B C & D)
G) Loans On Manufactured Home Dwelling (A B C & D)
Number
Average Value
Number
Average Value
Number
Average Value
Number
Average Value
Number
Average Value
LOANS ORIGINATED
5
$85,726
5
$67,572
4
$31,108
1
$91,220
3
$48,487
APPLICATIONS APPROVED, NOT ACCEPTED
2
$56,455
1
$106,050
0
$0
0
$0
1
$50,920
APPLICATIONS DENIED
2
$66,310
4
$61,992
1
$27,900
0
$0
1
$63,100
APPLICATIONS WITHDRAWN
0
$0
4
$83,302
0
$0
0
$0
0
$0
FILES CLOSED FOR INCOMPLETENESS
0
$0
0
$0
0
$0
0
$0
0
$0
Aggregated Statistics For Year 2005 (Based on 2 partial tracts)
A) FHA, FSA/RHS & VA Home Purchase Loans
B) Conventional Home Purchase Loans
C) Refinancings
D) Home Improvement Loans
G) Loans On Manufactured Home Dwelling (A B C & D)
Number
Average Value
Number
Average Value
Number
Average Value
Number
Average Value
Number
Average Value
LOANS ORIGINATED
1
$81,030
4
$78,875
5
$62,966
2
$22,140
2
$40,075
APPLICATIONS APPROVED, NOT ACCEPTED
0
$0
2
$29,780
2
$66,530
0
$0
2
$39,190
APPLICATIONS DENIED
0
$0
2
$51,585
6
$68,080
2
$32,435
2
$53,800
APPLICATIONS WITHDRAWN
0
$0
0
$0
4
$109,870
0
$0
0
$0
FILES CLOSED FOR INCOMPLETENESS
0
$0
0
$0
2
$78,710
0
$0
0
$0
Aggregated Statistics For Year 2004 (Based on 2 partial tracts)
A) FHA, FSA/RHS & VA Home Purchase Loans
B) Conventional Home Purchase Loans
C) Refinancings
D) Home Improvement Loans
F) Non-occupant Loans on < 5 Family Dwellings (A B C & D)
G) Loans On Manufactured Home Dwelling (A B C & D)
Number
Average Value
Number
Average Value
Number
Average Value
Number
Average Value
Number
Average Value
Number
Average Value
LOANS ORIGINATED
1
$115,130
2
$113,245
5
$55,084
3
$19,483
1
$40,290
2
$53,025
APPLICATIONS APPROVED, NOT ACCEPTED
0
$0
0
$0
1
$58,450
0
$0
0
$0
0
$0
APPLICATIONS DENIED
0
$0
2
$71,735
7
$78,060
2
$26,790
0
$0
4
$59,832
APPLICATIONS WITHDRAWN
0
$0
0
$0
3
$91,143
0
$0
0
$0
0
$0
FILES CLOSED FOR INCOMPLETENESS
0
$0
0
$0
0
$0
0
$0
0
$0
0
$0
Aggregated Statistics For Year 2003 (Based on 2 partial tracts)
A) FHA, FSA/RHS & VA Home Purchase Loans
B) Conventional Home Purchase Loans
C) Refinancings
D) Home Improvement Loans
Number
Average Value
Number
Average Value
Number
Average Value
Number
Average Value
LOANS ORIGINATED
1
$61,990
2
$70,185
8
$64,151
2
$15,055
APPLICATIONS APPROVED, NOT ACCEPTED
0
$0
1
$45,390
1
$60,440
0
$0
APPLICATIONS DENIED
0
$0
2
$37,860
5
$55,306
0
$0
APPLICATIONS WITHDRAWN
0
$0
0
$0
1
$38,750
0
$0
FILES CLOSED FOR INCOMPLETENESS
0
$0
0
$0
0
$0
0
$0
Aggregated Statistics For Year 2002 (Based on 2 partial tracts)
B) Conventional Home Purchase Loans
C) Refinancings
D) Home Improvement Loans
Number
Average Value
Number
Average Value
Number
Average Value
LOANS ORIGINATED
2
$61,330
4
$72,785
2
$13,950
APPLICATIONS APPROVED, NOT ACCEPTED
0
$0
1
$58,890
0
$0
APPLICATIONS DENIED
0
$0
5
$60,310
2
$10,075
APPLICATIONS WITHDRAWN
0
$0
2
$53,245
0
$0
FILES CLOSED FOR INCOMPLETENESS
0
$0
0
$0
0
$0
Aggregated Statistics For Year 2001 (Based on 2 partial tracts)
B) Conventional Home Purchase Loans
C) Refinancings
D) Home Improvement Loans
Number
Average Value
Number
Average Value
Number
Average Value
LOANS ORIGINATED
4
$43,782
6
$57,933
2
$8,080
APPLICATIONS APPROVED, NOT ACCEPTED
2
$20,700
1
$26,790
0
$0
APPLICATIONS DENIED
3
$44,650
4
$46,218
2
$24,135
APPLICATIONS WITHDRAWN
0
$0
2
$61,770
0
$0
FILES CLOSED FOR INCOMPLETENESS
0
$0
0
$0
0
$0
Aggregated Statistics For Year 2000 (Based on 2 partial tracts)
A) FHA, FSA/RHS & VA Home Purchase Loans
B) Conventional Home Purchase Loans
C) Refinancings
D) Home Improvement Loans
F) Non-occupant Loans on < 5 Family Dwellings (A B C & D)
Number
Average Value
Number
Average Value
Number
Average Value
Number
Average Value
Number
Average Value
LOANS ORIGINATED
2
$47,380
3
$51,440
2
$46,050
1
$9,960
0
$0
APPLICATIONS APPROVED, NOT ACCEPTED
0
$0
1
$90,110
1
$40,740
0
$0
0
$0
APPLICATIONS DENIED
0
$0
7
$50,416
4
$45,830
2
$8,855
1
$27,680
APPLICATIONS WITHDRAWN
0
$0
0
$0
0
$0
0
$0
0
$0
FILES CLOSED FOR INCOMPLETENESS
0
$0
0
$0
0
$0
0
$0
0
$0
Aggregated Statistics For Year 1999 (Based on 1 partial tract)
Detailed PMIC statistics for the following Tracts:0119.03
2002 - 2018 National Fire Incident Reporting System (NFIRS) incidents
According to the data from the years 2002 - 2018 the average number of fires per year is 14. The highest number of reported fire incidents - 30 took place in 2005, and the least - 0 in 2017. The data has a constant trend.
When looking into fire subcategories, the most reports belonged to: Structure Fires (48.3%), and Outside Fires (32.1%).
Fire incident types reported to NFIRS in Zip Code 13803
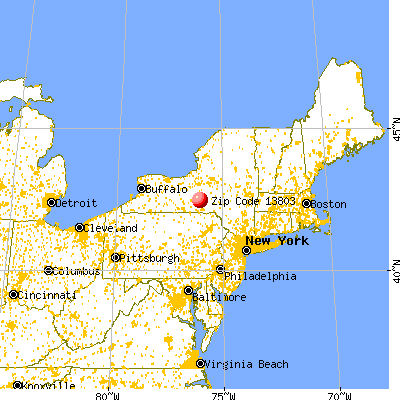


 Nearest zip codes: 13794, 13797, 13101, 13835, 13784, 13863.


 According to the data from the years 2002 - 2018 the average number of fires per year is 14. The highest number of reported fire incidents - 30 took place in 2005, and the least - 0 in 2017. The data has a constant trend.
 When looking into fire subcategories, the most reports belonged to: Structure Fires (48.3%), and Outside Fires (32.1%).