Estimated zip code population in 2022: 11,632
Zip code population in 2010: 11,125
Zip code population in 2000: 13,207
Houses and condos: 5,996
Renter-occupied apartments: 2,216
% of renters here:
47%State:
46%
March 2022 cost of living index in zip code 14208: 100.3
(near average, U.S. average is 100)
Land area: 1.4
sq. mi.
Water area: 0.0
sq. mi.
Population density: 8,571 people per square mile (high).
OSM Map
General Map
Google Map
MSN Map
OSM Map
General Map
Google Map
MSN Map
OSM Map
General Map
Google Map
MSN Map
OSM Map
General Map
Google Map
MSN Map
Please wait while loading the map...
Real estate property taxes paid for housing units in 2022:
This zip code:
0.9% ($916)New York:
1.5% ($6,180)
Median real estate property taxes paid for housing units with mortgages in 2022: $923 (0.7%)
Median real estate property taxes paid for housing units with no mortgage in 2022: $909 (1.0%)
Business Search - 14 Million verified businesses
Males: 5,137 Females: 6,494
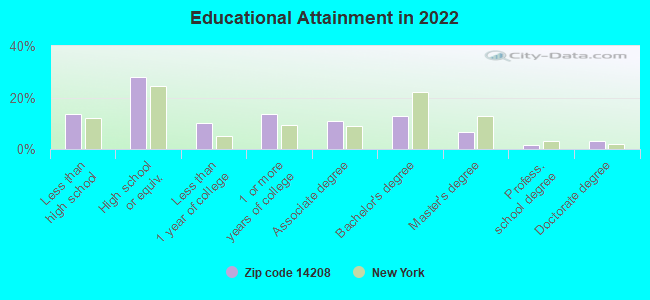
For population 25 years and over in 14208:
High school or higher: 85.5%Bachelor's degree or higher: 23.6%Graduate or professional degree: 11.0%Unemployed: 5.8%Mean travel time to work (commute): 19.8 minutes
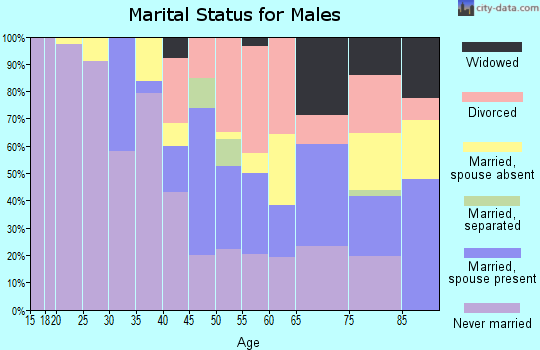
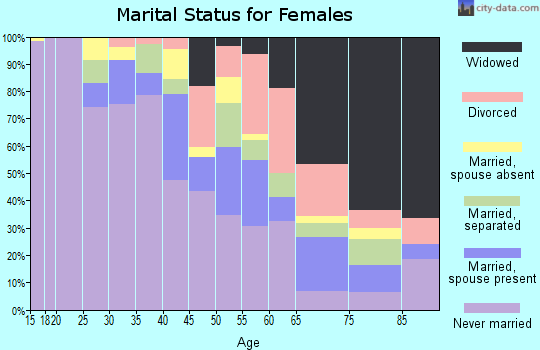
For population 15 years and over in 14208:
Never married: 57.7%Now married: 21.1%Separated: 2.1%Widowed: 7.2%Divorced: 12.0%
Zip code 14208 compared to state average:
Median household income below state average. Median house value significantly below state average. Black race population percentage significantly above state average. Hispanic race population percentage significantly below state average. Median age below state average. Foreign-born population percentage significantly below state average. Length of stay since moving in significantly above state average. Number of rooms per house above state average. House age above state average. Number of college students above state average. Percentage of population with a bachelor's degree or higher below state average. 8,352 71.8% Black 1,892 16.3% White 498 4.3% Two or more races 473 4.1% Asian 385 3.3% Hispanic or Latino 12 0.1% American Indian 12 0.1% Some other race 3 0.03% Native Hawaiian and Other
Data:
Median household income ($)
Median household income (% change since 2000)
Household income diversity
Ratio of average income to average house value (%)
Ratio of average income to average rent
Median household income ($) - White
Median household income ($) - Black or African American
Median household income ($) - Asian
Median household income ($) - Hispanic or Latino
Median household income ($) - American Indian and Alaska Native
Median household income ($) - Multirace
Median household income ($) - Other Race
Median household income for houses/condos with a mortgage ($)
Median household income for apartments without a mortgage ($)
Races - White alone (%)
Races - White alone (% change since 2000)
Races - Black alone (%)
Races - Black alone (% change since 2000)
Races - American Indian alone (%)
Races - American Indian alone (% change since 2000)
Races - Asian alone (%)
Races - Asian alone (% change since 2000)
Races - Hispanic (%)
Races - Hispanic (% change since 2000)
Races - Native Hawaiian and Other Pacific Islander alone (%)
Races - Native Hawaiian and Other Pacific Islander alone (% change since 2000)
Races - Two or more races (%)
Races - Two or more races (% change since 2000)
Races - Other race alone (%)
Races - Other race alone (% change since 2000)
Racial diversity
Unemployment (%)
Unemployment (% change since 2000)
Unemployment (%) - White
Unemployment (%) - Black or African American
Unemployment (%) - Asian
Unemployment (%) - Hispanic or Latino
Unemployment (%) - American Indian and Alaska Native
Unemployment (%) - Multirace
Unemployment (%) - Other Race
Population density (people per square mile)
Population - Males (%)
Population - Females (%)
Population - Males (%) - White
Population - Males (%) - Black or African American
Population - Males (%) - Asian
Population - Males (%) - Hispanic or Latino
Population - Males (%) - American Indian and Alaska Native
Population - Males (%) - Multirace
Population - Males (%) - Other Race
Population - Females (%) - White
Population - Females (%) - Black or African American
Population - Females (%) - Asian
Population - Females (%) - Hispanic or Latino
Population - Females (%) - American Indian and Alaska Native
Population - Females (%) - Multirace
Population - Females (%) - Other Race
Coronavirus confirmed cases (Apr 25, 2024)
Deaths caused by coronavirus (Apr 25, 2024)
Coronavirus confirmed cases (per 100k population) (Apr 25, 2024)
Deaths caused by coronavirus (per 100k population) (Apr 25, 2024)
Daily increase in number of cases (Apr 25, 2024)
Weekly increase in number of cases (Apr 25, 2024)
Cases doubled (in days) (Apr 25, 2024)
Hospitalized patients (Apr 18, 2022)
Negative test results (Apr 18, 2022)
Total test results (Apr 18, 2022)
COVID Vaccine doses distributed (per 100k population) (Sep 19, 2023)
COVID Vaccine doses administered (per 100k population) (Sep 19, 2023)
COVID Vaccine doses distributed (Sep 19, 2023)
COVID Vaccine doses administered (Sep 19, 2023)
Likely homosexual households (%)
Likely homosexual households (% change since 2000)
Likely homosexual households - Lesbian couples (%)
Likely homosexual households - Lesbian couples (% change since 2000)
Likely homosexual households - Gay men (%)
Likely homosexual households - Gay men (% change since 2000)
Cost of living index
Median gross rent ($)
Median contract rent ($)
Median monthly housing costs ($)
Median house or condo value ($)
Median house or condo value ($ change since 2000)
Mean house or condo value by units in structure - 1, detached ($)
Mean house or condo value by units in structure - 1, attached ($)
Mean house or condo value by units in structure - 2 ($)
Mean house or condo value by units in structure by units in structure - 3 or 4 ($)
Mean house or condo value by units in structure - 5 or more ($)
Mean house or condo value by units in structure - Boat, RV, van, etc. ($)
Mean house or condo value by units in structure - Mobile home ($)
Median house or condo value ($) - White
Median house or condo value ($) - Black or African American
Median house or condo value ($) - Asian
Median house or condo value ($) - Hispanic or Latino
Median house or condo value ($) - American Indian and Alaska Native
Median house or condo value ($) - Multirace
Median house or condo value ($) - Other Race
Median resident age
Resident age diversity
Median resident age - Males
Median resident age - Females
Median resident age - White
Median resident age - Black or African American
Median resident age - Asian
Median resident age - Hispanic or Latino
Median resident age - American Indian and Alaska Native
Median resident age - Multirace
Median resident age - Other Race
Median resident age - Males - White
Median resident age - Males - Black or African American
Median resident age - Males - Asian
Median resident age - Males - Hispanic or Latino
Median resident age - Males - American Indian and Alaska Native
Median resident age - Males - Multirace
Median resident age - Males - Other Race
Median resident age - Females - White
Median resident age - Females - Black or African American
Median resident age - Females - Asian
Median resident age - Females - Hispanic or Latino
Median resident age - Females - American Indian and Alaska Native
Median resident age - Females - Multirace
Median resident age - Females - Other Race
Commute - mean travel time to work (minutes)
Travel time to work - Less than 5 minutes (%)
Travel time to work - Less than 5 minutes (% change since 2000)
Travel time to work - 5 to 9 minutes (%)
Travel time to work - 5 to 9 minutes (% change since 2000)
Travel time to work - 10 to 19 minutes (%)
Travel time to work - 10 to 19 minutes (% change since 2000)
Travel time to work - 20 to 29 minutes (%)
Travel time to work - 20 to 29 minutes (% change since 2000)
Travel time to work - 30 to 39 minutes (%)
Travel time to work - 30 to 39 minutes (% change since 2000)
Travel time to work - 40 to 59 minutes (%)
Travel time to work - 40 to 59 minutes (% change since 2000)
Travel time to work - 60 to 89 minutes (%)
Travel time to work - 60 to 89 minutes (% change since 2000)
Travel time to work - 90 or more minutes (%)
Travel time to work - 90 or more minutes (% change since 2000)
Marital status - Never married (%)
Marital status - Now married (%)
Marital status - Separated (%)
Marital status - Widowed (%)
Marital status - Divorced (%)
Median family income ($)
Median family income (% change since 2000)
Median non-family income ($)
Median non-family income (% change since 2000)
Median per capita income ($)
Median per capita income (% change since 2000)
Median family income ($) - White
Median family income ($) - Black or African American
Median family income ($) - Asian
Median family income ($) - Hispanic or Latino
Median family income ($) - American Indian and Alaska Native
Median family income ($) - Multirace
Median family income ($) - Other Race
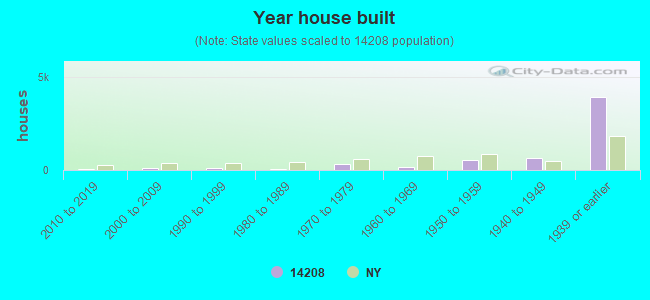
Median year house/condo built
Median year apartment built
Year house built - Built 2005 or later (%)
Year house built - Built 2000 to 2004 (%)
Year house built - Built 1990 to 1999 (%)
Year house built - Built 1980 to 1989 (%)
Year house built - Built 1970 to 1979 (%)
Year house built - Built 1960 to 1969 (%)
Year house built - Built 1950 to 1959 (%)
Year house built - Built 1940 to 1949 (%)
Year house built - Built 1939 or earlier (%)
Average household size
Household density (households per square mile)
Average household size - White
Average household size - Black or African American
Average household size - Asian
Average household size - Hispanic or Latino
Average household size - American Indian and Alaska Native
Average household size - Multirace
Average household size - Other Race
Occupied housing units (%)
Vacant housing units (%)
Owner occupied housing units (%)
Renter occupied housing units (%)
Vacancy status - For rent (%)
Vacancy status - For sale only (%)
Vacancy status - Rented or sold, not occupied (%)
Vacancy status - For seasonal, recreational, or occasional use (%)
Vacancy status - For migrant workers (%)
Vacancy status - Other vacant (%)
Residents with income below the poverty level (%)
Residents with income below 50% of the poverty level (%)
Children below poverty level (%)
Poor families by family type - Married-couple family (%)
Poor families by family type - Male, no wife present (%)
Poor families by family type - Female, no husband present (%)
Poverty status for native-born residents (%)
Poverty status for foreign-born residents (%)
Poverty among high school graduates not in families (%)
Poverty among people who did not graduate high school not in families (%)
Residents with income below the poverty level (%) - White
Residents with income below the poverty level (%) - Black or African American
Residents with income below the poverty level (%) - Asian
Residents with income below the poverty level (%) - Hispanic or Latino
Residents with income below the poverty level (%) - American Indian and Alaska Native
Residents with income below the poverty level (%) - Multirace
Residents with income below the poverty level (%) - Other Race
Air pollution - Air Quality Index (AQI)
Air pollution - CO
Air pollution - NO2
Air pollution - SO2
Air pollution - Ozone
Air pollution - PM10
Air pollution - PM25
Air pollution - Pb
Crime - Murders per 100,000 population
Crime - Rapes per 100,000 population
Crime - Robberies per 100,000 population
Crime - Assaults per 100,000 population
Crime - Burglaries per 100,000 population
Crime - Thefts per 100,000 population
Crime - Auto thefts per 100,000 population
Crime - Arson per 100,000 population
Crime - City-data.com crime index
Crime - Violent crime index
Crime - Property crime index
Crime - Murders per 100,000 population (5 year average)
Crime - Rapes per 100,000 population (5 year average)
Crime - Robberies per 100,000 population (5 year average)
Crime - Assaults per 100,000 population (5 year average)
Crime - Burglaries per 100,000 population (5 year average)
Crime - Thefts per 100,000 population (5 year average)
Crime - Auto thefts per 100,000 population (5 year average)
Crime - Arson per 100,000 population (5 year average)
Crime - City-data.com crime index (5 year average)
Crime - Violent crime index (5 year average)
Crime - Property crime index (5 year average)
1996 Presidential Elections Results (%) - Democratic Party (Clinton)
1996 Presidential Elections Results (%) - Republican Party (Dole)
1996 Presidential Elections Results (%) - Other
2000 Presidential Elections Results (%) - Democratic Party (Gore)
2000 Presidential Elections Results (%) - Republican Party (Bush)
2000 Presidential Elections Results (%) - Other
2004 Presidential Elections Results (%) - Democratic Party (Kerry)
2004 Presidential Elections Results (%) - Republican Party (Bush)
2004 Presidential Elections Results (%) - Other
2008 Presidential Elections Results (%) - Democratic Party (Obama)
2008 Presidential Elections Results (%) - Republican Party (McCain)
2008 Presidential Elections Results (%) - Other
2012 Presidential Elections Results (%) - Democratic Party (Obama)
2012 Presidential Elections Results (%) - Republican Party (Romney)
2012 Presidential Elections Results (%) - Other
2016 Presidential Elections Results (%) - Democratic Party (Clinton)
2016 Presidential Elections Results (%) - Republican Party (Trump)
2016 Presidential Elections Results (%) - Other
2020 Presidential Elections Results (%) - Democratic Party (Biden)
2020 Presidential Elections Results (%) - Republican Party (Trump)
2020 Presidential Elections Results (%) - Other
Ancestries Reported - Arab (%)
Ancestries Reported - Czech (%)
Ancestries Reported - Danish (%)
Ancestries Reported - Dutch (%)
Ancestries Reported - English (%)
Ancestries Reported - French (%)
Ancestries Reported - French Canadian (%)
Ancestries Reported - German (%)
Ancestries Reported - Greek (%)
Ancestries Reported - Hungarian (%)
Ancestries Reported - Irish (%)
Ancestries Reported - Italian (%)
Ancestries Reported - Lithuanian (%)
Ancestries Reported - Norwegian (%)
Ancestries Reported - Polish (%)
Ancestries Reported - Portuguese (%)
Ancestries Reported - Russian (%)
Ancestries Reported - Scotch-Irish (%)
Ancestries Reported - Scottish (%)
Ancestries Reported - Slovak (%)
Ancestries Reported - Subsaharan African (%)
Ancestries Reported - Swedish (%)
Ancestries Reported - Swiss (%)
Ancestries Reported - Ukrainian (%)
Ancestries Reported - United States (%)
Ancestries Reported - Welsh (%)
Ancestries Reported - West Indian (%)
Ancestries Reported - Other (%)
Educational Attainment - No schooling completed (%)
Educational Attainment - Less than high school (%)
Educational Attainment - High school or equivalent (%)
Educational Attainment - Less than 1 year of college (%)
Educational Attainment - 1 or more years of college (%)
Educational Attainment - Associate degree (%)
Educational Attainment - Bachelor's degree (%)
Educational Attainment - Master's degree (%)
Educational Attainment - Professional school degree (%)
Educational Attainment - Doctorate degree (%)
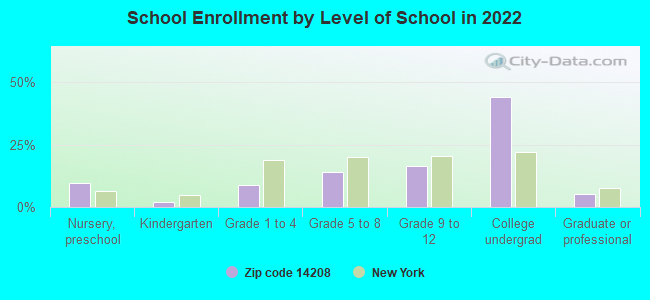
School Enrollment - Nursery, preschool (%)
School Enrollment - Kindergarten (%)
School Enrollment - Grade 1 to 4 (%)
School Enrollment - Grade 5 to 8 (%)
School Enrollment - Grade 9 to 12 (%)
School Enrollment - College undergrad (%)
School Enrollment - Graduate or professional (%)
School Enrollment - Not enrolled in school (%)
School enrollment - Public schools (%)
School enrollment - Private schools (%)
School enrollment - Not enrolled (%)
Median number of rooms in houses and condos
Median number of rooms in apartments
Housing units lacking complete plumbing facilities (%)
Housing units lacking complete kitchen facilities (%)
Density of houses
Urban houses (%)
Rural houses (%)
Households with people 60 years and over (%)
Households with people 65 years and over (%)
Households with people 75 years and over (%)
Households with one or more nonrelatives (%)
Households with no nonrelatives (%)
Population in households (%)
Family households (%)
Nonfamily households (%)
Population in families (%)
Family households with own children (%)
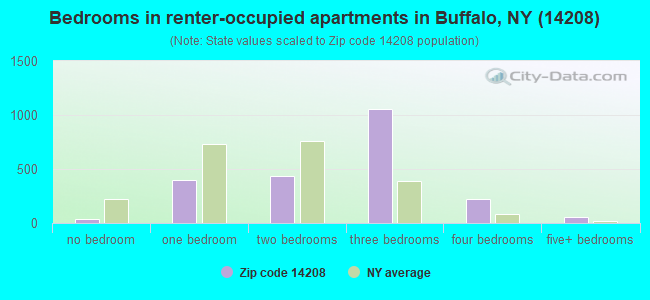
Median number of bedrooms in owner occupied houses
Mean number of bedrooms in owner occupied houses
Median number of bedrooms in renter occupied houses
Mean number of bedrooms in renter occupied houses
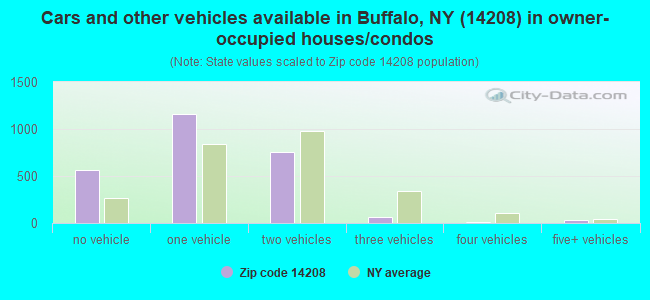
Median number of vehichles in owner occupied houses
Mean number of vehichles in owner occupied houses
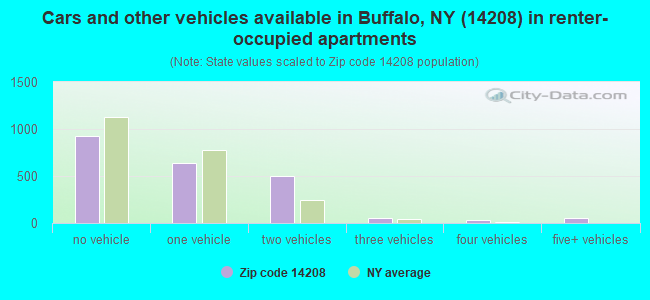
Median number of vehichles in renter occupied houses
Mean number of vehichles in renter occupied houses
Mortgage status - with mortgage (%)
Mortgage status - with second mortgage (%)
Mortgage status - with home equity loan (%)
Mortgage status - with both second mortgage and home equity loan (%)
Mortgage status - without a mortgage (%)
Average family size
Average family size - White
Average family size - Black or African American
Average family size - Asian
Average family size - Hispanic or Latino
Average family size - American Indian and Alaska Native
Average family size - Multirace
Average family size - Other Race
Geographical mobility - Same house 1 year ago (%)
Geographical mobility - Moved within same county (%)
Geographical mobility - Moved from different county within same state (%)
Geographical mobility - Moved from different state (%)
Geographical mobility - Moved from abroad (%)
Place of birth - Born in state of residence (%)
Place of birth - Born in other state (%)
Place of birth - Native, outside of US (%)
Place of birth - Foreign born (%)
Housing units in structures - 1, detached (%)
Housing units in structures - 1, attached (%)
Housing units in structures - 2 (%)
Housing units in structures - 3 or 4 (%)
Housing units in structures - 5 to 9 (%)
Housing units in structures - 10 to 19 (%)
Housing units in structures - 20 to 49 (%)
Housing units in structures - 50 or more (%)
Housing units in structures - Mobile home (%)
Housing units in structures - Boat, RV, van, etc. (%)
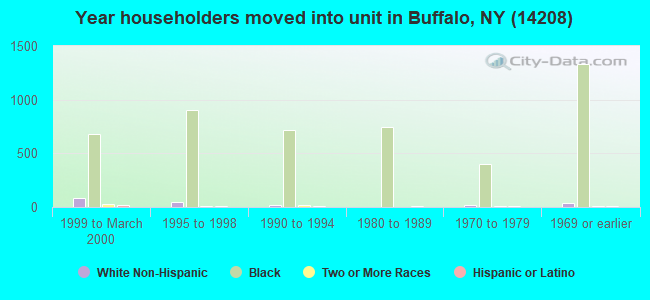
House/condo owner moved in on average (years ago)
Renter moved in on average (years ago)
Year householder moved into unit - Moved in 1999 to March 2000 (%)
Year householder moved into unit - Moved in 1995 to 1998 (%)
Year householder moved into unit - Moved in 1990 to 1994 (%)
Year householder moved into unit - Moved in 1980 to 1989 (%)
Year householder moved into unit - Moved in 1970 to 1979 (%)
Year householder moved into unit - Moved in 1969 or earlier (%)
Means of transportation to work - Drove car alone (%)
Means of transportation to work - Carpooled (%)
Means of transportation to work - Public transportation (%)
Means of transportation to work - Bus or trolley bus (%)
Means of transportation to work - Streetcar or trolley car (%)
Means of transportation to work - Subway or elevated (%)
Means of transportation to work - Railroad (%)
Means of transportation to work - Ferryboat (%)
Means of transportation to work - Taxicab (%)
Means of transportation to work - Motorcycle (%)
Means of transportation to work - Bicycle (%)
Means of transportation to work - Walked (%)
Means of transportation to work - Other means (%)
Working at home (%)
Industry diversity
Most Common Industries - Agriculture, forestry, fishing and hunting, and mining (%)
Most Common Industries - Agriculture, forestry, fishing and hunting (%)
Most Common Industries - Mining, quarrying, and oil and gas extraction (%)
Most Common Industries - Construction (%)
Most Common Industries - Manufacturing (%)
Most Common Industries - Wholesale trade (%)
Most Common Industries - Retail trade (%)
Most Common Industries - Transportation and warehousing, and utilities (%)
Most Common Industries - Transportation and warehousing (%)
Most Common Industries - Utilities (%)
Most Common Industries - Information (%)
Most Common Industries - Finance and insurance, and real estate and rental and leasing (%)
Most Common Industries - Finance and insurance (%)
Most Common Industries - Real estate and rental and leasing (%)
Most Common Industries - Professional, scientific, and management, and administrative and waste management services (%)
Most Common Industries - Professional, scientific, and technical services (%)
Most Common Industries - Management of companies and enterprises (%)
Most Common Industries - Administrative and support and waste management services (%)
Most Common Industries - Educational services, and health care and social assistance (%)
Most Common Industries - Educational services (%)
Most Common Industries - Health care and social assistance (%)
Most Common Industries - Arts, entertainment, and recreation, and accommodation and food services (%)
Most Common Industries - Arts, entertainment, and recreation (%)
Most Common Industries - Accommodation and food services (%)
Most Common Industries - Other services, except public administration (%)
Most Common Industries - Public administration (%)
Occupation diversity
Most Common Occupations - Management, business, science, and arts occupations (%)
Most Common Occupations - Management, business, and financial occupations (%)
Most Common Occupations - Management occupations (%)
Most Common Occupations - Business and financial operations occupations (%)
Most Common Occupations - Computer, engineering, and science occupations (%)
Most Common Occupations - Computer and mathematical occupations (%)
Most Common Occupations - Architecture and engineering occupations (%)
Most Common Occupations - Life, physical, and social science occupations (%)
Most Common Occupations - Education, legal, community service, arts, and media occupations (%)
Most Common Occupations - Community and social service occupations (%)
Most Common Occupations - Legal occupations (%)
Most Common Occupations - Education, training, and library occupations (%)
Most Common Occupations - Arts, design, entertainment, sports, and media occupations (%)
Most Common Occupations - Healthcare practitioners and technical occupations (%)
Most Common Occupations - Health diagnosing and treating practitioners and other technical occupations (%)
Most Common Occupations - Health technologists and technicians (%)
Most Common Occupations - Service occupations (%)
Most Common Occupations - Healthcare support occupations (%)
Most Common Occupations - Protective service occupations (%)
Most Common Occupations - Fire fighting and prevention, and other protective service workers including supervisors (%)
Most Common Occupations - Law enforcement workers including supervisors (%)
Most Common Occupations - Food preparation and serving related occupations (%)
Most Common Occupations - Building and grounds cleaning and maintenance occupations (%)
Most Common Occupations - Personal care and service occupations (%)
Most Common Occupations - Sales and office occupations (%)
Most Common Occupations - Sales and related occupations (%)
Most Common Occupations - Office and administrative support occupations (%)
Most Common Occupations - Natural resources, construction, and maintenance occupations (%)
Most Common Occupations - Farming, fishing, and forestry occupations (%)
Most Common Occupations - Construction and extraction occupations (%)
Most Common Occupations - Installation, maintenance, and repair occupations (%)
Most Common Occupations - Production, transportation, and material moving occupations (%)
Most Common Occupations - Production occupations (%)
Most Common Occupations - Transportation occupations (%)
Most Common Occupations - Material moving occupations (%)
People in Group quarters - Institutionalized population (%)
People in Group quarters - Correctional institutions (%)
People in Group quarters - Federal prisons and detention centers (%)
People in Group quarters - Halfway houses (%)
People in Group quarters - Local jails and other confinement facilities (including police lockups) (%)
People in Group quarters - Military disciplinary barracks (%)
People in Group quarters - State prisons (%)
People in Group quarters - Other types of correctional institutions (%)
People in Group quarters - Nursing homes (%)
People in Group quarters - Hospitals/wards, hospices, and schools for the handicapped (%)
People in Group quarters - Hospitals/wards and hospices for chronically ill (%)
People in Group quarters - Hospices or homes for chronically ill (%)
People in Group quarters - Military hospitals or wards for chronically ill (%)
People in Group quarters - Other hospitals or wards for chronically ill (%)
People in Group quarters - Hospitals or wards for drug/alcohol abuse (%)
People in Group quarters - Mental (Psychiatric) hospitals or wards (%)
People in Group quarters - Schools, hospitals, or wards for the mentally retarded (%)
People in Group quarters - Schools, hospitals, or wards for the physically handicapped (%)
People in Group quarters - Institutions for the deaf (%)
People in Group quarters - Institutions for the blind (%)
People in Group quarters - Orthopedic wards and institutions for the physically handicapped (%)
People in Group quarters - Wards in general hospitals for patients who have no usual home elsewhere (%)
People in Group quarters - Wards in military hospitals for patients who have no usual home elsewhere (%)
People in Group quarters - Juvenile institutions (%)
People in Group quarters - Long-term care (%)
People in Group quarters - Homes for abused, dependent, and neglected children (%)
People in Group quarters - Residential treatment centers for emotionally disturbed children (%)
People in Group quarters - Training schools for juvenile delinquents (%)
People in Group quarters - Short-term care, detention or diagnostic centers for delinquent children (%)
People in Group quarters - Type of juvenile institution unknown (%)
People in Group quarters - Noninstitutionalized population (%)
People in Group quarters - College dormitories (includes college quarters off campus) (%)
People in Group quarters - Military quarters (%)
People in Group quarters - On base (%)
People in Group quarters - Barracks, unaccompanied personnel housing (UPH), (Enlisted/Officer), ;and similar group living quarters for military personnel (%)
People in Group quarters - Transient quarters for temporary residents (%)
People in Group quarters - Military ships (%)
People in Group quarters - Group homes (%)
People in Group quarters - Homes or halfway houses for drug/alcohol abuse (%)
People in Group quarters - Homes for the mentally ill (%)
People in Group quarters - Homes for the mentally retarded (%)
People in Group quarters - Homes for the physically handicapped (%)
People in Group quarters - Other group homes (%)
People in Group quarters - Religious group quarters (%)
People in Group quarters - Dormitories (%)
People in Group quarters - Agriculture workers' dormitories on farms (%)
People in Group quarters - Job Corps and vocational training facilities (%)
People in Group quarters - Other workers' dormitories (%)
People in Group quarters - Crews of maritime vessels (%)
People in Group quarters - Other nonhousehold living situations (%)
People in Group quarters - Other noninstitutional group quarters (%)
Residents speaking English at home (%)
Residents speaking English at home - Born in the United States (%)
Residents speaking English at home - Native, born elsewhere (%)
Residents speaking English at home - Foreign born (%)
Residents speaking Spanish at home (%)
Residents speaking Spanish at home - Born in the United States (%)
Residents speaking Spanish at home - Native, born elsewhere (%)
Residents speaking Spanish at home - Foreign born (%)
Residents speaking other language at home (%)
Residents speaking other language at home - Born in the United States (%)
Residents speaking other language at home - Native, born elsewhere (%)
Residents speaking other language at home - Foreign born (%)
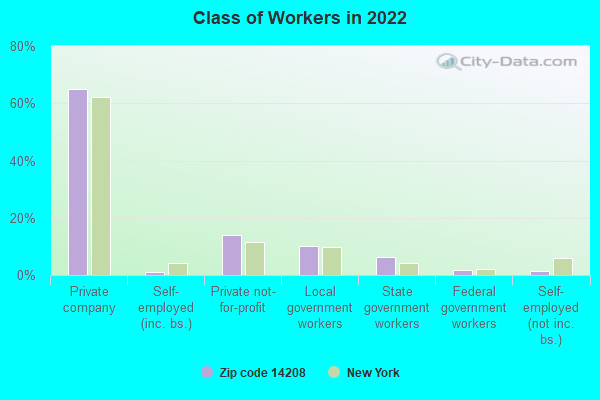
Class of Workers - Employee of private company (%)
Class of Workers - Self-employed in own incorporated business (%)
Class of Workers - Private not-for-profit wage and salary workers (%)
Class of Workers - Local government workers (%)
Class of Workers - State government workers (%)
Class of Workers - Federal government workers (%)
Class of Workers - Self-employed workers in own not incorporated business and Unpaid family workers (%)
House heating fuel used in houses and condos - Utility gas (%)
House heating fuel used in houses and condos - Bottled, tank, or LP gas (%)
House heating fuel used in houses and condos - Electricity (%)
House heating fuel used in houses and condos - Fuel oil, kerosene, etc. (%)
House heating fuel used in houses and condos - Coal or coke (%)
House heating fuel used in houses and condos - Wood (%)
House heating fuel used in houses and condos - Solar energy (%)
House heating fuel used in houses and condos - Other fuel (%)
House heating fuel used in houses and condos - No fuel used (%)
House heating fuel used in apartments - Utility gas (%)
House heating fuel used in apartments - Bottled, tank, or LP gas (%)
House heating fuel used in apartments - Electricity (%)
House heating fuel used in apartments - Fuel oil, kerosene, etc. (%)
House heating fuel used in apartments - Coal or coke (%)
House heating fuel used in apartments - Wood (%)
House heating fuel used in apartments - Solar energy (%)
House heating fuel used in apartments - Other fuel (%)
House heating fuel used in apartments - No fuel used (%)
Armed forces status - In Armed Forces (%)
Armed forces status - Civilian (%)
Armed forces status - Civilian - Veteran (%)
Armed forces status - Civilian - Nonveteran (%)
Fatal accidents locations in years 2005-2021
Fatal accidents locations in 2005
Fatal accidents locations in 2006
Fatal accidents locations in 2007
Fatal accidents locations in 2008
Fatal accidents locations in 2009
Fatal accidents locations in 2010
Fatal accidents locations in 2011
Fatal accidents locations in 2012
Fatal accidents locations in 2013
Fatal accidents locations in 2014
Fatal accidents locations in 2015
Fatal accidents locations in 2016
Fatal accidents locations in 2017
Fatal accidents locations in 2018
Fatal accidents locations in 2019
Fatal accidents locations in 2020
Fatal accidents locations in 2021
Alcohol use - People drinking some alcohol every month (%)
Alcohol use - People not drinking at all (%)
Alcohol use - Average days/month drinking alcohol
Alcohol use - Average drinks/week
Alcohol use - Average days/year people drink much
Audiometry - Average condition of hearing (%)
Audiometry - People that can hear a whisper from across a quiet room (%)
Audiometry - People that can hear normal voice from across a quiet room (%)
Audiometry - Ears ringing, roaring, buzzing (%)
Audiometry - Had a job exposure to loud noise (%)
Audiometry - Had off-work exposure to loud noise (%)
Blood Pressure & Cholesterol - Has high blood pressure (%)
Blood Pressure & Cholesterol - Checking blood pressure at home (%)
Blood Pressure & Cholesterol - Frequently checking blood cholesterol (%)
Blood Pressure & Cholesterol - Has high cholesterol level (%)
Consumer Behavior - Money monthly spent on food at supermarket/grocery store
Consumer Behavior - Money monthly spent on food at other stores
Consumer Behavior - Money monthly spent on eating out
Consumer Behavior - Money monthly spent on carryout/delivered foods
Consumer Behavior - Income spent on food at supermarket/grocery store (%)
Consumer Behavior - Income spent on food at other stores (%)
Consumer Behavior - Income spent on eating out (%)
Consumer Behavior - Income spent on carryout/delivered foods (%)
Current Health Status - General health condition (%)
Current Health Status - Blood donors (%)
Current Health Status - Has blood ever tested for HIV virus (%)
Current Health Status - Left-handed people (%)
Dermatology - People using sunscreen (%)
Diabetes - Diabetics (%)
Diabetes - Had a blood test for high blood sugar (%)
Diabetes - People taking insulin (%)
Diet Behavior & Nutrition - Diet health (%)
Diet Behavior & Nutrition - Milk product consumption (# of products/month)
Diet Behavior & Nutrition - Meals not home prepared (#/week)
Diet Behavior & Nutrition - Meals from fast food or pizza place (#/week)
Diet Behavior & Nutrition - Ready-to-eat foods (#/month)
Diet Behavior & Nutrition - Frozen meals/pizza (#/month)
Drug Use - People that ever used marijuana or hashish (%)
Drug Use - Ever used hard drugs (%)
Drug Use - Ever used any form of cocaine (%)
Drug Use - Ever used heroin (%)
Drug Use - Ever used methamphetamine (%)
Health Insurance - People covered by health insurance (%)
Kidney Conditions-Urology - Avg. # of times urinating at night
Medical Conditions - People with asthma (%)
Medical Conditions - People with anemia (%)
Medical Conditions - People with psoriasis (%)
Medical Conditions - People with overweight (%)
Medical Conditions - Elderly people having difficulties in thinking or remembering (%)
Medical Conditions - People who ever received blood transfusion (%)
Medical Conditions - People having trouble seeing even with glass/contacts (%)
Medical Conditions - People with arthritis (%)
Medical Conditions - People with gout (%)
Medical Conditions - People with congestive heart failure (%)
Medical Conditions - People with coronary heart disease (%)
Medical Conditions - People with angina pectoris (%)
Medical Conditions - People who ever had heart attack (%)
Medical Conditions - People who ever had stroke (%)
Medical Conditions - People with emphysema (%)
Medical Conditions - People with thyroid problem (%)
Medical Conditions - People with chronic bronchitis (%)
Medical Conditions - People with any liver condition (%)
Medical Conditions - People who ever had cancer or malignancy (%)
Mental Health - People who have little interest in doing things (%)
Mental Health - People feeling down, depressed, or hopeless (%)
Mental Health - People who have trouble sleeping or sleeping too much (%)
Mental Health - People feeling tired or having little energy (%)
Mental Health - People with poor appetite or overeating (%)
Mental Health - People feeling bad about themself (%)
Mental Health - People who have trouble concentrating on things (%)
Mental Health - People moving or speaking slowly or too fast (%)
Mental Health - People having thoughts they would be better off dead (%)
Oral Health - Average years since last visit a dentist
Oral Health - People embarrassed because of mouth (%)
Oral Health - People with gum disease (%)
Oral Health - General health of teeth and gums (%)
Oral Health - Average days a week using dental floss/device
Oral Health - Average days a week using mouthwash for dental problem
Oral Health - Average number of teeth
Pesticide Use - Households using pesticides to control insects (%)
Pesticide Use - Households using pesticides to kill weeds (%)
Physical Activity - People doing vigorous-intensity work activities (%)
Physical Activity - People doing moderate-intensity work activities (%)
Physical Activity - People walking or bicycling (%)
Physical Activity - People doing vigorous-intensity recreational activities (%)
Physical Activity - People doing moderate-intensity recreational activities (%)
Physical Activity - Average hours a day doing sedentary activities
Physical Activity - Average hours a day watching TV or videos
Physical Activity - Average hours a day using computer
Physical Functioning - People having limitations keeping them from working (%)
Physical Functioning - People limited in amount of work they can do (%)
Physical Functioning - People that need special equipment to walk (%)
Physical Functioning - People experiencing confusion/memory problems (%)
Physical Functioning - People requiring special healthcare equipment (%)
Prescription Medications - Average number of prescription medicines taking
Preventive Aspirin Use - Adults 40+ taking low-dose aspirin (%)
Reproductive Health - Vaginal deliveries (%)
Reproductive Health - Cesarean deliveries (%)
Reproductive Health - Deliveries resulted in a live birth (%)
Reproductive Health - Pregnancies resulted in a delivery (%)
Reproductive Health - Women breastfeeding newborns (%)
Reproductive Health - Women that had a hysterectomy (%)
Reproductive Health - Women that had both ovaries removed (%)
Reproductive Health - Women that have ever taken birth control pills (%)
Reproductive Health - Women taking birth control pills (%)
Reproductive Health - Women that have ever used Depo-Provera or injectables (%)
Reproductive Health - Women that have ever used female hormones (%)
Sexual Behavior - People 18+ that ever had sex (vaginal, anal, or oral) (%)
Sexual Behavior - Males 18+ that ever had vaginal sex with a woman (%)
Sexual Behavior - Males 18+ that ever performed oral sex on a woman (%)
Sexual Behavior - Males 18+ that ever had anal sex with a woman (%)
Sexual Behavior - Males 18+ that ever had any sex with a man (%)
Sexual Behavior - Females 18+ that ever had vaginal sex with a man (%)
Sexual Behavior - Females 18+ that ever performed oral sex on a man (%)
Sexual Behavior - Females 18+ that ever had anal sex with a man (%)
Sexual Behavior - Females 18+ that ever had any kind of sex with a woman (%)
Sexual Behavior - Average age people first had sex
Sexual Behavior - Average number of female sex partners in lifetime (males 18+)
Sexual Behavior - Average number of female vaginal sex partners in lifetime (males 18+)
Sexual Behavior - Average age people first performed oral sex on a woman (18+)
Sexual Behavior - Average number of woman performed oral sex on in lifetime (18+)
Sexual Behavior - Average number of male sex partners in lifetime (males 18+)
Sexual Behavior - Average number of male anal sex partners in lifetime (males 18+)
Sexual Behavior - Average age people first performed oral sex on a man (18+)
Sexual Behavior - Average number of male oral sex partners in lifetime (18+)
Sexual Behavior - People using protection when performing oral sex (%)
Sexual Behavior - Average number of times people have vaginal or anal sex a year
Sexual Behavior - People having sex without condom (%)
Sexual Behavior - Average number of male sex partners in lifetime (females 18+)
Sexual Behavior - Average number of male vaginal sex partners in lifetime (females 18+)
Sexual Behavior - Average number of female sex partners in lifetime (females 18+)
Sexual Behavior - Circumcised males 18+ (%)
Sleep Disorders - Average hours sleeping at night
Sleep Disorders - People that has trouble sleeping (%)
Smoking-Cigarette Use - People smoking cigarettes (%)
Taste & Smell - People 40+ having problems with smell (%)
Taste & Smell - People 40+ having problems with taste (%)
Taste & Smell - People 40+ that ever had wisdom teeth removed (%)
Taste & Smell - People 40+ that ever had tonsils teeth removed (%)
Taste & Smell - People 40+ that ever had a loss of consciousness because of a head injury (%)
Taste & Smell - People 40+ that ever had a broken nose or other serious injury to face or skull (%)
Taste & Smell - People 40+ that ever had two or more sinus infections (%)
Weight - Average height (inches)
Weight - Average weight (pounds)
Weight - Average BMI
Weight - People that are obese (%)
Weight - People that ever were obese (%)
Weight - People trying to lose weight (%)
100%
urban population.
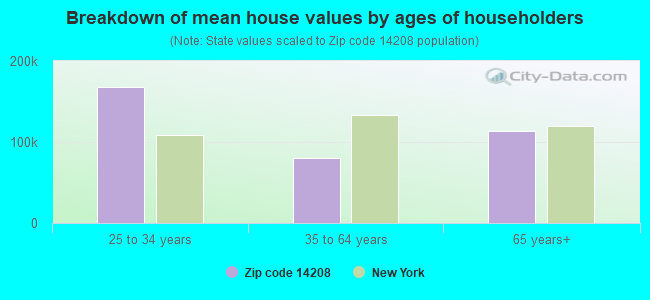
Estimated median house/condo value in 2022: $104,139
14208:
$104,139New York:
$400,400
Median resident age: This zip code:
33.0 yearsNew York median age:
40.0 years
Average household size: This zip code:
2.2 peopleNew York:
2.5 people
Averages for the 2020 tax year for zip code 14208, filed in 2021:
Average Adjusted Gross Income (AGI) in 2020: $31,681 (Individual Income Tax Returns) Here:
$31,681State:
$90,930
Salary/wage: $27,240 (reported on 86.5% of returns )Here:
$27,240State:
$72,104
(% of AGI for various income ranges: 1116.9% for AGIs below $25k , 3579.0% for AGIs $25k-50k , 7577.2% for AGIs $50k-75k , 10246.0% for AGIs $75k-100k , 17673.3% for AGIs $100k-200k ) Taxable interest for individuals: $197 (reported on 8.6% of returns )This zip code:
$197New York:
$3,075
(% of AGI for various income ranges: 1.2% for AGIs below $25k , 1.7% for AGIs $25k-50k , 4.8% for AGIs $50k-75k , 3.0% for AGIs $75k-100k , 25.0% for AGIs $100k-200k ) Ordinary dividends: $738 (reported on 3.0% of returns )(% of AGI for various income ranges: 0.5% for AGIs below $25k , 4.4% for AGIs $25k-50k , 7.6% for AGIs $50k-75k , 18.0% for AGIs $75k-100k ) Net capital gain/loss in AGI: +$2,177 (reported on 3.0% of returns )Here:
+$2,177State:
+$44,925
(% of AGI for various income ranges: 1.6% for AGIs below $25k , 2.5% for AGIs $25k-50k , 11.4% for AGIs $50k-75k , 195.0% for AGIs $75k-100k ) Profit/loss from business: +$5,405 (reported on 10.2% of returns )Here:
+$5,405State:
+$14,940
(% of AGI for various income ranges: 61.2% for AGIs below $25k , 32.3% for AGIs $25k-50k , 104.1% for AGIs $50k-75k , 390.0% for AGIs $75k-100k , 418.3% for AGIs $100k-200k ) Taxable individual retirement arrangement distribution: $16,388 (reported on 1.9% of returns )14208:
$16,388New York:
$19,609
(% of AGI for various income ranges: 6.1% for AGIs below $25k , 38.9% for AGIs $25k-50k , 779.0% for AGIs $75k-100k ) Total itemized deductions: $22,800 (reported on 1.4% of returns )Here:
$22,800State:
$39,326
(% of AGI for various income ranges: 276.9% for AGIs $50k-75k , 941.7% for AGIs $100k-200k ) Charity contributions: $13,620 (reported on 1.2% of returns )Here:
$13,620State:
$15,420
(% of AGI for various income ranges: 126.6% for AGIs $50k-75k , 523.3% for AGIs $100k-200k ) Taxes paid: $4,500 (reported on 1.4% of returns )(% of AGI for various income ranges: 43.1% for AGIs $50k-75k , 241.7% for AGIs $100k-200k ) Earned income credit: $2,521 (reported on 36.7% of returns )(% of AGI for various income ranges: 154.9% for AGIs below $25k , 113.9% for AGIs $25k-50k ) Percentage of individuals using paid preparers for their 2020 taxes: 94.2%(% for various income ranges: 94.9% for AGIs below $25k , 94.3% for AGIs $25k-50k , 91.5% for AGIs $50k-75k , 93.8% for AGIs $75k-100k , 92.3% for AGIs $100k-200k )
Averages for the 2012 tax year for zip code 14208, filed in 2013:
Average Adjusted Gross Income (AGI) in 2012: $26,683 (Individual Income Tax Returns) Here:
$26,683State:
$77,088
Salary/wage: $24,046 (reported on 86.3% of returns )Here:
$24,046State:
$60,593
(% of AGI for various income ranges: 77.8% for AGIs below $25k , 81.8% for AGIs $25k-50k , 79.7% for AGIs $50k-75k , 73.3% for AGIs $75k-100k , 64.9% for AGIs $100k-200k ) Taxable interest for individuals: $224 (reported on 12.6% of returns )This zip code:
$224New York:
$3,125
(% of AGI for various income ranges: 0.2% for AGIs $25k-50k ) Ordinary dividends: $924 (reported on 4.6% of returns )(% of AGI for various income ranges: 0.3% for AGIs below $25k , 0.1% for AGIs $25k-50k , 0.1% for AGIs $50k-75k , 0.2% for AGIs $75k-100k ) Net capital gain/loss in AGI: +$486 (reported on 1.9% of returns )Profit/loss from business: +$5,773 (reported on 8.2% of returns )Here:
+$5,773State:
+$16,168
(% of AGI for various income ranges: 4.8% for AGIs below $25k , 0.9% for AGIs $25k-50k , 0.6% for AGIs $50k-75k ) Taxable individual retirement arrangement distribution: $8,020 (reported on 2.7% of returns )14208:
$8,020New York:
$17,621
(% of AGI for various income ranges: 0.4% for AGIs below $25k , 1.2% for AGIs $25k-50k , 3.1% for AGIs $75k-100k ) Total itemized deductions: $14,093 (21% of AGI, reported on 8.2% of returns )Here:
$14,093State:
$34,985
Here:
20.8% of AGIState:
21.3% of AGI
(% of AGI for various income ranges: 1.3% for AGIs below $25k , 3.4% for AGIs $25k-50k , 4.7% for AGIs $50k-75k , 8.3% for AGIs $75k-100k , 11.8% for AGIs $100k-200k ) Charity contributions: $5,881 (reported on 7.1% of returns )(% of AGI for various income ranges: 1.4% for AGIs $25k-50k , 1.8% for AGIs $50k-75k , 3.5% for AGIs $75k-100k , 4.2% for AGIs $100k-200k ) Taxes paid: $4,090 (reported on 8.2% of returns )14208:
$4,090State:
$18,656
(% of AGI for various income ranges: 0.2% for AGIs below $25k , 0.8% for AGIs $25k-50k , 1.5% for AGIs $50k-75k , 2.8% for AGIs $75k-100k , 4.0% for AGIs $100k-200k ) Earned income credit: $2,528 (reported on 38.8% of returns )(% of AGI for various income ranges: 11.1% for AGIs below $25k , 1.6% for AGIs $25k-50k ) Percentage of individuals using paid preparers for their 2012 taxes: 52.2%(% for various income ranges: 50.7% for AGIs below $25k , 52.1% for AGIs $25k-50k , 53.3% for AGIs $50k-75k , 66.7% for AGIs $75k-100k , 71.4% for AGIs $100k-200k )
Averages for the 2004 tax year for zip code 14208, filed in 2005:
Average Adjusted Gross Income (AGI) in 2004: $24,108 (Individual Income Tax Returns) Here:
$24,108State:
$59,519
Salary/wage: $23,126 (reported on 85.9% of returns )Here:
$23,126State:
$50,673
(% of AGI for various income ranges: 82.7% for AGIs below $10k , 80.3% for AGIs $10k-25k , 83.8% for AGIs $25k-50k , 84.4% for AGIs $50k-75k , 82.6% for AGIs $75k-100k , 79.4% for AGIs over 100k ) Taxable interest for individuals: $421 (reported on 21.2% of returns )This zip code:
$421New York:
$2,377
(% of AGI for various income ranges: 0.5% for AGIs below $10k , 0.5% for AGIs $10k-25k , 0.3% for AGIs $25k-50k , 0.2% for AGIs $50k-75k , 0.5% for AGIs $75k-100k , 0.3% for AGIs over 100k ) Taxable dividends: $538 (reported on 7.9% of returns )(% of AGI for various income ranges: 0.1% for AGIs below $10k , 0.2% for AGIs $10k-25k , 0.1% for AGIs $25k-50k , 0.2% for AGIs $50k-75k , 0.1% for AGIs $75k-100k , 0.4% for AGIs over 100k ) Net capital gain/loss: +$473 (reported on 3.2% of returns )(% of AGI for various income ranges: -0.1% for AGIs below $10k , -0.0% for AGIs $10k-25k , -0.0% for AGIs $25k-50k , 0.0% for AGIs $50k-75k , 0.1% for AGIs $75k-100k , 0.8% for AGIs over 100k ) Profit/loss from business: +$3,838 (reported on 7.0% of returns )Here:
+$3,838State:
+$13,809
(% of AGI for various income ranges: 5.1% for AGIs below $10k , 2.4% for AGIs $10k-25k , 0.4% for AGIs $25k-50k , 0.1% for AGIs $50k-75k , 0.3% for AGIs $75k-100k ) IRA payment deduction: $852 (reported on 0.8% of returns )14208:
$852New York:
$3,115
Total itemized deductions: $12,983 (22% of AGI, reported on 11.3% of returns )Here:
$12,983State:
$25,864
Here:
21.5% of AGIState:
21.9% of AGI
(% of AGI for various income ranges: 2.8% for AGIs $10k-25k , 4.5% for AGIs $25k-50k , 10.5% for AGIs $50k-75k , 11.7% for AGIs $75k-100k , 12.6% for AGIs over 100k ) Charity contributions deductions: $4,807 (8% of AGI, reported on 10.5% of returns )Here:
7.8% of AGIState:
3.6% of AGI
(% of AGI for various income ranges: 0.8% for AGIs $10k-25k , 1.5% for AGIs $25k-50k , 3.7% for AGIs $50k-75k , 4.9% for AGIs $75k-100k , 3.8% for AGIs over 100k ) Total tax: $2,855 (reported on 56.2% of returns )14208:
$2,855State:
$11,730
(% of AGI for various income ranges: 1.3% for AGIs below $10k , 2.8% for AGIs $10k-25k , 6.4% for AGIs $25k-50k , 10.3% for AGIs $50k-75k , 11.8% for AGIs $75k-100k , 11.3% for AGIs over 100k ) Earned income credit: $1,955 (reported on 40.3% of returns )Percentage of individuals using paid preparers for their 2004 taxes: 71.0%(% for various income ranges: 63.5% for AGIs below $10k , 75.1% for AGIs $10k-25k , 73.2% for AGIs $25k-50k , 68.9% for AGIs $50k-75k , 74.1% for AGIs $75k-100k , 83.7% for AGIs over 100k )
Estimated median household income in 2022: This zip code:
$43,588New York:
$79,557
Nearest zip codes: 14209 ,
14222 ,
14214 ,
14211 ,
14216 ,
14204 .
Buffalo Zip Code Map
Percentage of family households: This zip code:
30.4%New York:
41.3%
Percentage of households with unmarried partners: This zip code:
4.0%New York:
42.3%
Likely homosexual households (counted as self-reported same-sex unmarried-partner households)
Lesbian couples: 0.0% of all households Gay men: 0.2% of all households
Household received Food Stamps/SNAP in the past 12 months: 1,571Household did not receive Food Stamps/SNAP in the past 12 months: 3,262
Women who had a birth in the past 12 months: 71 (45 now married , 26 unmarried) Women who did not have a birth in the past 12 months: 3,474 (582 now married , 2,925 unmarried)
Housing units in zip code 14208 with a mortgage: 953 (95
second mortgage , 73
both second mortgage and home equity loan )
Houses without a mortgage: 231
Median monthly owner costs for units with a mortgage: $823
Median monthly owner costs for units without a mortgage: $436
Residents with income below the poverty level in 2022:
This zip code:
26.2%Whole state:
14.3%
Residents with income below 50% of the poverty level in 2022:
This zip code:
13.6%Whole state:
6.8%
Median number of rooms in houses and condos: Median number of rooms in apartments: Notable locations in this zip code not listed on our city pages
Click to draw/clear zip code borders Notable locations in zip code 14208: (A) , Griffin Hall (B) , Martin Hall (C) , Frisch Residence Hall (D) , Bosch Residence Hall (E) , Patrick E Lee Student Athletic Center (F) , Koessler Athletic Center (G) , Montante Cultural Center (H) , Lyons Hall (I) , Palisano Pavilion (J) , Richard E Winter '42 Student Center (K) , Horan-O'Donnell Science Building (L) , Loyola Hall (M) , Wehle Technology Center (N) , Churchill Academic Tower (O) , Bouwhuis Library (P) , Old Main (Q) , Bagen Administration Building (R) , Niagara Lutheran Home and Rehabilitation Center (S) . Display/hide their locations on the map
Churches in zip code 14208 include: (A) , Abundant Life Church of God in Christ (B) , Bright Morning Star Baptist Church (C) , Cold Spring Bible Chapel (D) , Coldspring Church of God (E) , Evangelistic Temple and Community (F) , Genesis Community Church (G) , Grater Hope Baptist Church (H) , Greater Works Christian (I) . Display/hide their locations on the map
Park in zip code 14208: (1) . Display/hide its location on the map
Year house built (houses)
4 2020 or later39 2010 to 201999 2000 to 2009115 1990 to 199973 1980 to 1989309 1970 to 1979135 1960 to 1969544 1950 to 1959636 1940 to 19493,896 1939 or earlier
Zip code 14208 household income distribution in 2022 384 Less than $10,000519 $10,000 to $14,999182 $15,000 to $19,999509 $20,000 to $24,999138 $25,000 to $29,999205 $30,000 to $34,999155 $35,000 to $39,999357 $40,000 to $44,999184 $45,000 to $49,999374 $50,000 to $59,999675 $60,000 to $74,999372 $75,000 to $99,999401 $100,000 to $124,99983 $125,000 to $149,999146 $150,000 to $199,99980 $200,000 or moreEstimate of home value of owner-occupied houses/condos in 2022 in zip code 14208 86 Less than $10,00039 $10,000 to $14,99912 $20,000 to $24,99966 $25,000 to $29,999165 $30,000 to $34,99980 $35,000 to $39,99991 $40,000 to $49,99945 $50,000 to $59,999197 $60,000 to $69,999310 $70,000 to $79,99986 $80,000 to $89,99993 $90,000 to $99,999226 $100,000 to $124,999193 $125,000 to $149,999204 $150,000 to $174,99949 $175,000 to $199,999294 $200,000 to $249,99993 $250,000 to $299,99910 $300,000 to $399,9993 $400,000 to $499,99981 $500,000 to $749,99915 $1,500,000 to $1,999,999Rent paid by renters in 2022 in zip code 14208 75 $150 to $19973 $200 to $24994 $300 to $34991 $350 to $399154 $400 to $449112 $450 to $499114 $500 to $549205 $550 to $59967 $600 to $649190 $650 to $69972 $700 to $749157 $750 to $799277 $800 to $899113 $900 to $999142 $1,000 to $1,24927 $1,250 to $1,49993 $1,500 to $1,99910 $2,000 to $2,49942 $3,500 or more86 No cash rent
Median gross rent in 2022: $883.
Estimated median house (or condo) value in 2022 for: White Non-Hispanic householders: $125,236Black or African American householders: $114,912Two or more races householders: $286,159Hispanic or Latino householders: $213,216Estimated median house or condo value in 2022: $104,139
14208:
$104,139New York:
$400,400
Lower value quartile - upper value quartile: $68,660 - $168,574
Mean price in 2022: Detached houses: $162,444Here:
$162,444State:
$476,719
Townhouses or other attached units: $185,779Here:
$185,779State:
$699,270
In 2-unit structures: $190,624Here:
$190,624State:
$713,077
In 3-to-4-unit structures: $454,445Here:
$454,445State:
$764,568
In 5-or-more-unit structures: $378,535Here:
$378,535State:
$912,009
Mobile homes: $156,727Here:
$156,727State:
$88,925
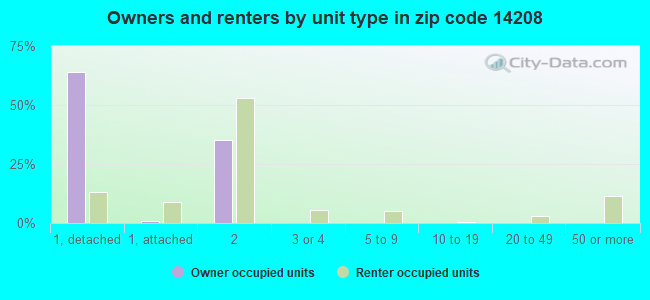
Housing units in structures:
One, detached: 2,114One, attached: 219Two: 2,8883 or 4: 1965 to 9: 11010 to 19: 3020 to 49: 6350 or more: 276Unemployment : 5.8%
Means of transportation to work in zip code 14208 58.7% 2,848 Drove a car alone6.2% 301 Carpooled11.4% 551 Bus or trolley bus1.3% 64 Streetcar or trolley car2.6% 128 Taxi0.3% 14 Bicycle8.0% 386 Walked0.5% 26 Other means11.8% 571 Worked at homeTravel time to work (commute) in zip code 14208 240 Less than 5 minutes654 5 to 9 minutes710 10 to 14 minutes889 15 to 19 minutes748 20 to 24 minutes73 25 to 29 minutes400 30 to 34 minutes40 35 to 39 minutes50 40 to 44 minutes110 45 to 59 minutes332 60 to 89 minutes
Neighborhoods in zip code 14208: Percentage of zip code residents living and working in this county: 98.5%
Household type by relationship:
Households: 11,632
Male householders: 1,614 (888 living alone ), Female householders: 3,140 (1,514 living alone )680 spouses (680 opposite-sex spouses ), 199 unmarried partners , (199 opposite-sex unmarried partners ), 2,762 children (2,732 natural , 19 adopted , 15 stepchildren ), 526 grandchildren , 143 brothers or sisters , 159 parents , 146 foster children , 409 other relatives , 539 non-relatives In group quarters: 1,337 (-1 institutionalized population )
Size of family households: 727 2-persons , 673 3-persons , 406 4-persons , 131 5-persons , 105 6-persons , 28 7-or-more-persons
Size of nonfamily households: 2,400 1-person , 73 2-persons , 75 3-persons , 96 4-persons , 16 5-persons , 24 6-persons
726 married couples with children. single-parent households (819 women ).
88.7% of residents of 14208 zip code speak English at home. of residents speak Spanish at home (71% very well, 26% well, 3% not well ).of residents speak other Indo-European language at home (83% very well, 14% well, 3% not well ).of residents speak Asian or Pacific Island language at home (58% very well, 42% well ).of residents speak other language at home (45% very well, 32% well, 4% not well, 19% not at all ).
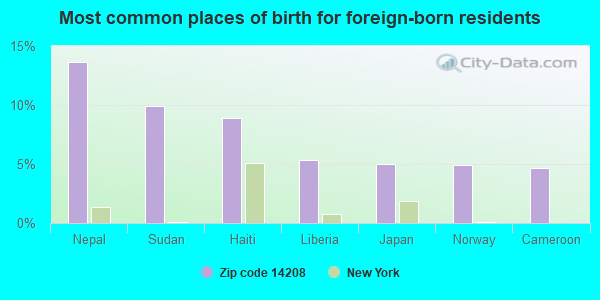
Foreign born population: 814 (7.0%)
(48.3%
of them are naturalized citizens )
This zip code:
7.0%Whole state:
22.7%
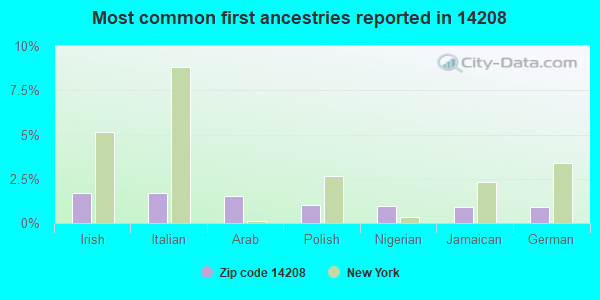
14% Nepal 10% Sudan 9% Haiti 5% Liberia 5% Japan 5% Norway 5% Cameroon 2% Irish 2% Italian 2% Arab 1% Polish 1% Nigerian 1% Jamaican 1% German
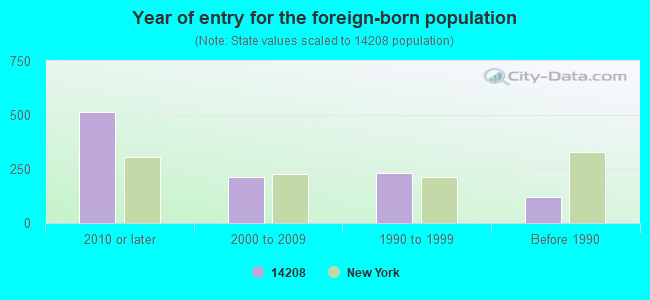
Year of entry for the foreign-born population
512 2010 or later 212 2000 to 2009 231 1990 to 1999 120 Before 1990
There are
40 Medical Specialists in Zip Code 14208 .
Facilities with environmental interests located in this zip code:
HOMEVILLE REALTY (31 MEECH AVE. in BUFFALO, NY)
ENFORCEMENT/COMPLIANCE ACTIVITY (Integrated Compliance Information System) COMPLIANCE ACTIVITY (Tracking inspections of insecticide, fungicide, and rodenticide, and toxic substances) Business SIC classification: REAL ESTATE AGENTS AND MANAGERS
COMMUNITY SCHOOL (#53) - BUFFALO PUBLIC SCHOOLS (329 ROEHRER AVENUE in BUFFALO, NY)
ENFORCEMENT/COMPLIANCE ACTIVITY (Integrated Compliance Information System)
Housing units lacking complete plumbing facilities: 6.8%
Housing units lacking complete kitchen facilities: 9.7%
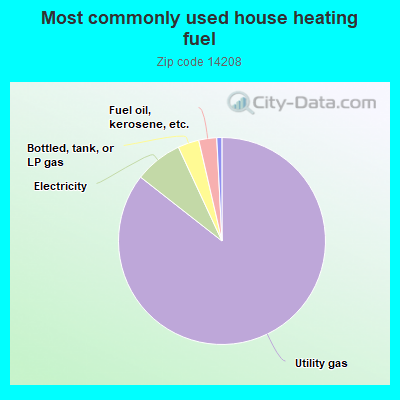
85.5% Utility gas 7.5% Electricity 3.3% Bottled, tank, or LP gas 2.8% Fuel oil, kerosene, etc. 0.8% No fuel used
Population in 1990: 14,705.
Place of birth for U.S.-born residents:
This state: 8,992Northeast: 217Midwest: 263South: 1,024West: 49
58% of the 14208 zip code residents lived in the same house 5 years ago.
Out of people who lived in different houses, 74% lived in this county.
Out of people who lived in different counties, 50% lived in New York.
87% of the 14208 zip code residents lived in the same house 1 year ago.
Out of people who lived in different houses, 66% moved from this county.
Out of people who lived in different houses, 13% moved from different county within same state.
Out of people who lived in different houses, 15% moved from different state.
Out of people who lived in different houses, 6% moved from abroad.
Private vs. public school enrollment:
Students in private schools in grades 1 to 8 (elementary and middle school): 133
Students in private schools in grades 9 to 12 (high school): 39
Students in private undergraduate colleges: 693
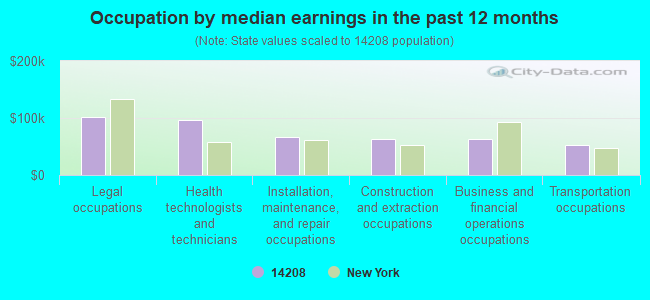
Occupation by median earnings in the past 12 months ($)
102,318 Legal occupations 97,287 Health technologists and technicians 66,717 Installation, maintenance, and repair occupations 62,589 Construction and extraction occupations 62,413 Business and financial operations occupations 53,105 Transportation occupations
Companies with federal contracts located in this zip code:
CANISIUS COLLEGE OF BUFFALO (2001 MAIN ST in BUFFALO, NY) in 5 contracts from 2003 to 2005
Contracts for Aeronautics and Space Technology -- Basic Research (R&D), Educational Services by NASA, ArmySigned by year: 2000: $0; 2001: $0; 2002: $0; 2003: $375,833; 2004: $1,264,716; 2005: $401,750; 2006: $0.
Biggest contracts: with NASA for Aeronautics and Space Technology -- Basic Research (R&D). Signed on 2004-04-26. Effective on 2004-04-15. Completion date: 2006-04-14.
with Army for Educational Services. Signed on 2005-08-04. Completion date: 2005-08-04.
, same as above. Signed on 2003-06-05. Completion date: 2003-06-05.
, same as above. Signed on 2004-04-02. Completion date: 2004-04-02.
ASSOCIATED REPORTING SERVICE (196 BRUNSWICK BLVD in BUFFALO, NY; small business) in 7 contracts from 2003 to 2006
Contracts for Stenographic Services, Court Reporting Services by Army, U.S. Army Corps of Engineers - civil program financing onlySigned by year: 2000: $0; 2001: $0; 2002: $0; 2003: $2,000; 2004: $0; 2005: $9,040; 2006: -$3,007.
Biggest contracts: with Army for Stenographic Services. Signed on 2005-05-25. Completion date: 2005-09-30.
with U.S. Army Corps of Engineers - civil program financing only for Stenographic Services. Signed on 2005-05-25. Completion date: 2005-09-30.
with U.S. Army Corps of Engineers - civil program financing only for Court Reporting Services. Signed on 2003-06-10. Completion date: 2003-09-30.
, same as above. Signed on 2003-09-05. Completion date: 2003-12-30.
JOHNSON JANITORIAL SERVIE (15 HEDLEY PL in BUFFALO, NY; small business) in 2 contracts from 2003 to 2004
$25,000 with Navy for Custodial Janitorial Services. Signed on 2003-10-24. Completion date: 2004-09-30.
, same as above. Signed on 2004-04-13. Completion date: 2004-02-29.
Top industries in this zip code by the number of employees in 2005:
Educational Services: Colleges, Universities, and Professional Schools (over 1000 employees: 1 establishment, 20-49 employees: 1 establishment)Health Care and Social Assistance: Nursing Care Facilities (250-499: 1)Construction: Commercial and Institutional Building Construction (50-99: 1)Health Care and Social Assistance: Homes for the Elderly (50-99: 1)Accommodation and Food Services: Food Service Contractors (20-49: 1, 5-9: 2, 1-4: 2)Accommodation and Food Services: Limited-Service Restaurants (10-19: 2, 5-9: 1, 1-4: 2)Other Services (except Public Administration): Religious Organizations (5-9: 4, 1-4: 6)Health Care and Social Assistance: Other Individual and Family Services (20-49: 1, 1-4: 1)Wholesale Trade: Other Miscellaneous Durable Goods Merchant Wholesalers (20-49: 1)
People in group quarters in 2010:
922 people in college/university student housing
388 people in nursing facilities/skilled-nursing facilities
25 people in other noninstitutional facilities
22 people in group homes intended for adults
People in group quarters in 2000:
767 people in college dormitories (includes college quarters off campus)
404 people in nursing homes
65 people in other noninstitutional group quarters
52 people in other nonhousehold living situations
12 people in homes for the mentally ill
9 people in other group homes
Fatal accident statistics in 2014:
Fatal accident count: 1Vehicles involved in fatal accidents: 3Fatal accidents caused by drunken drivers: 1Fatalities: 1Persons involved in fatal accidents: 3Pedestrians involved in fatal accidents: 0
Fatal accident statistics in 2012:
Fatal accident count: 2Vehicles involved in fatal accidents: 3Fatal accidents caused by drunken drivers: 0Fatalities: 2Persons involved in fatal accidents: 5Pedestrians involved in fatal accidents: 0
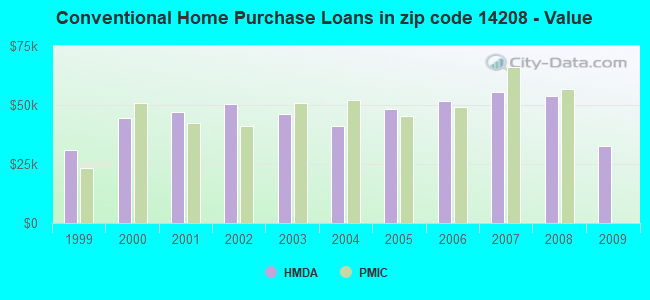
Home Mortgage Disclosure Act Aggregated Statistics For Year 2009(Based on 4 full and 6 partial tracts) A) FHA, FSA/RHS & VA B) Conventional C) Refinancings D) Home Improvement Loans F) Non-occupant Loans on Number Average Value Number Average Value Number Average Value Number Average Value Number Average Value
LOANS ORIGINATED 15 $63,553 9 $32,574 15 $44,399 29 $11,108 7 $37,303 APPLICATIONS APPROVED, NOT ACCEPTED 1 $85,560 0 $0 8 $46,856 11 $17,389 6 $35,333 APPLICATIONS DENIED 7 $61,631 4 $84,158 29 $51,681 60 $11,670 13 $23,324 APPLICATIONS WITHDRAWN 1 $80,590 0 $0 20 $55,454 1 $13,740 0 $0 FILES CLOSED FOR INCOMPLETENESS 2 $52,660 1 $59,320 9 $62,436 6 $32,383 5 $45,466
Aggregated Statistics For Year 2008(Based on 4 full and 6 partial tracts) A) FHA, FSA/RHS & VA B) Conventional C) Refinancings D) Home Improvement Loans E) Loans on Dwellings For 5+ Families F) Non-occupant Loans on G) Loans On Manufactured Number Average Value Number Average Value Number Average Value Number Average Value Number Average Value Number Average Value Number Average Value
LOANS ORIGINATED 16 $60,998 19 $53,694 40 $45,534 35 $19,731 0 $0 20 $40,430 0 $0 APPLICATIONS APPROVED, NOT ACCEPTED 0 $0 8 $16,415 10 $48,516 2 $66,165 0 $0 9 $29,090 0 $0 APPLICATIONS DENIED 7 $56,926 9 $49,112 100 $48,194 99 $18,701 4 $92,260 29 $35,356 3 $29,920 APPLICATIONS WITHDRAWN 7 $153,724 6 $35,108 22 $70,772 8 $44,328 0 $0 0 $0 0 $0 FILES CLOSED FOR INCOMPLETENESS 2 $54,410 2 $40,685 13 $63,795 0 $0 0 $0 5 $43,042 0 $0
Aggregated Statistics For Year 2007(Based on 4 full and 6 partial tracts) A) FHA, FSA/RHS & VA B) Conventional C) Refinancings D) Home Improvement Loans E) Loans on Dwellings For 5+ Families F) Non-occupant Loans on Number Average Value Number Average Value Number Average Value Number Average Value Number Average Value Number Average Value
LOANS ORIGINATED 8 $65,728 49 $55,665 72 $48,224 48 $23,516 1 $61,360 58 $50,389 APPLICATIONS APPROVED, NOT ACCEPTED 1 $47,910 5 $66,526 30 $57,314 8 $21,454 0 $0 7 $49,917 APPLICATIONS DENIED 0 $0 26 $56,034 185 $70,736 148 $18,961 0 $0 46 $35,545 APPLICATIONS WITHDRAWN 2 $73,610 9 $75,271 94 $96,513 10 $36,384 0 $0 12 $49,781 FILES CLOSED FOR INCOMPLETENESS 2 $56,390 2 $67,815 6 $76,652 2 $49,465 0 $0 2 $49,465
Aggregated Statistics For Year 2006(Based on 4 full and 6 partial tracts) A) FHA, FSA/RHS & VA B) Conventional C) Refinancings D) Home Improvement Loans E) Loans on Dwellings For 5+ Families F) Non-occupant Loans on G) Loans On Manufactured Number Average Value Number Average Value Number Average Value Number Average Value Number Average Value Number Average Value Number Average Value
LOANS ORIGINATED 2 $35,615 72 $51,612 135 $45,438 46 $19,089 0 $0 89 $43,233 0 $0 APPLICATIONS APPROVED, NOT ACCEPTED 0 $0 23 $46,422 25 $48,276 5 $7,434 2 $59,540 10 $60,472 0 $0 APPLICATIONS DENIED 0 $0 72 $48,684 252 $53,442 173 $16,431 0 $0 80 $37,635 1 $81,000 APPLICATIONS WITHDRAWN 1 $36,630 10 $51,049 138 $57,933 4 $27,798 0 $0 24 $45,733 4 $26,712 FILES CLOSED FOR INCOMPLETENESS 0 $0 10 $49,009 27 $58,821 2 $19,845 0 $0 12 $34,640 0 $0
Aggregated Statistics For Year 2005(Based on 4 full and 6 partial tracts) A) FHA, FSA/RHS & VA B) Conventional C) Refinancings D) Home Improvement Loans F) Non-occupant Loans on G) Loans On Manufactured Number Average Value Number Average Value Number Average Value Number Average Value Number Average Value Number Average Value
LOANS ORIGINATED 2 $38,150 56 $48,262 94 $46,296 49 $14,216 67 $45,453 0 $0 APPLICATIONS APPROVED, NOT ACCEPTED 2 $39,575 24 $58,982 72 $45,605 16 $35,909 26 $46,940 0 $0 APPLICATIONS DENIED 0 $0 30 $59,479 353 $56,290 193 $23,082 85 $22,349 3 $47,203 APPLICATIONS WITHDRAWN 8 $41,326 30 $69,323 113 $57,626 16 $49,821 18 $73,171 0 $0 FILES CLOSED FOR INCOMPLETENESS 0 $0 13 $59,906 21 $68,068 2 $34,730 4 $48,480 0 $0
Aggregated Statistics For Year 2004(Based on 4 full and 6 partial tracts) A) FHA, FSA/RHS & VA B) Conventional C) Refinancings D) Home Improvement Loans F) Non-occupant Loans on Number Average Value Number Average Value Number Average Value Number Average Value Number Average Value
LOANS ORIGINATED 14 $42,467 66 $41,166 72 $50,064 34 $19,317 60 $38,882 APPLICATIONS APPROVED, NOT ACCEPTED 0 $0 13 $40,887 50 $45,987 9 $24,723 12 $47,497 APPLICATIONS DENIED 2 $15,830 42 $47,908 338 $52,616 129 $19,199 86 $35,575 APPLICATIONS WITHDRAWN 0 $0 6 $66,670 91 $52,813 17 $36,554 9 $50,774 FILES CLOSED FOR INCOMPLETENESS 1 $101,530 19 $64,424 34 $61,188 1 $25,100 7 $70,139
Aggregated Statistics For Year 2003(Based on 4 full and 6 partial tracts) A) FHA, FSA/RHS & VA B) Conventional C) Refinancings D) Home Improvement Loans F) Non-occupant Loans on Number Average Value Number Average Value Number Average Value Number Average Value Number Average Value
LOANS ORIGINATED 17 $52,346 32 $46,287 91 $40,965 25 $12,314 36 $27,608 APPLICATIONS APPROVED, NOT ACCEPTED 2 $51,445 4 $38,582 42 $48,372 8 $16,262 2 $42,585 APPLICATIONS DENIED 9 $61,139 13 $37,803 253 $53,317 74 $13,390 23 $31,202 APPLICATIONS WITHDRAWN 3 $84,953 6 $36,745 106 $52,683 13 $34,027 10 $39,626 FILES CLOSED FOR INCOMPLETENESS 0 $0 0 $0 11 $38,310 2 $16,020 0 $0
Aggregated Statistics For Year 2002(Based on 4 full and 6 partial tracts) A) FHA, FSA/RHS & VA B) Conventional C) Refinancings D) Home Improvement Loans E) Loans on Dwellings For 5+ Families F) Non-occupant Loans on Number Average Value Number Average Value Number Average Value Number Average Value Number Average Value Number Average Value
LOANS ORIGINATED 9 $58,831 27 $50,223 105 $42,192 51 $7,749 0 $0 41 $35,248 APPLICATIONS APPROVED, NOT ACCEPTED 0 $0 6 $51,693 89 $44,028 12 $11,473 0 $0 20 $29,392 APPLICATIONS DENIED 6 $52,303 32 $50,309 356 $47,601 125 $12,901 1 $329,690 45 $40,018 APPLICATIONS WITHDRAWN 4 $76,778 4 $75,980 141 $46,338 15 $36,868 0 $0 7 $47,926 FILES CLOSED FOR INCOMPLETENESS 2 $48,280 8 $34,211 35 $50,132 1 $34,220 0 $0 5 $50,446
Aggregated Statistics For Year 2001(Based on 4 full and 6 partial tracts) A) FHA, FSA/RHS & VA B) Conventional C) Refinancings D) Home Improvement Loans F) Non-occupant Loans on Number Average Value Number Average Value Number Average Value Number Average Value Number Average Value
LOANS ORIGINATED 8 $63,181 31 $46,836 164 $40,330 70 $9,631 56 $36,059 APPLICATIONS APPROVED, NOT ACCEPTED 2 $49,075 17 $47,169 54 $45,690 27 $10,541 13 $35,262 APPLICATIONS DENIED 7 $37,673 62 $47,960 494 $43,764 147 $11,612 65 $38,821 APPLICATIONS WITHDRAWN 1 $49,050 5 $52,106 191 $44,744 12 $19,125 14 $47,621 FILES CLOSED FOR INCOMPLETENESS 3 $19,760 2 $7,915 30 $51,467 1 $36,630 3 $91,687
Aggregated Statistics For Year 2000(Based on 4 full and 6 partial tracts) A) FHA, FSA/RHS & VA B) Conventional C) Refinancings D) Home Improvement Loans E) Loans on Dwellings For 5+ Families F) Non-occupant Loans on Number Average Value Number Average Value Number Average Value Number Average Value Number Average Value Number Average Value
LOANS ORIGINATED 24 $56,698 58 $44,582 197 $43,734 85 $11,432 1 $41,070 29 $35,904 APPLICATIONS APPROVED, NOT ACCEPTED 1 $47,620 15 $46,667 86 $43,185 53 $19,021 0 $0 12 $33,853 APPLICATIONS DENIED 11 $38,629 51 $39,428 413 $38,023 178 $14,334 2 $49,465 60 $31,270 APPLICATIONS WITHDRAWN 2 $32,645 5 $25,666 131 $42,219 27 $25,989 0 $0 13 $27,058 FILES CLOSED FOR INCOMPLETENESS 2 $31,755 1 $34,220 53 $43,841 2 $6,945 0 $0 4 $30,762
Aggregated Statistics For Year 1999(Based on 2 full and 3 partial tracts) A) FHA, FSA/RHS & VA B) Conventional C) Refinancings D) Home Improvement Loans E) Loans on Dwellings For 5+ Families F) Non-occupant Loans on Number Average Value Number Average Value Number Average Value Number Average Value Number Average Value Number Average Value
LOANS ORIGINATED 10 $41,771 16 $30,739 101 $34,966 66 $7,995 0 $0 23 $27,605 APPLICATIONS APPROVED, NOT ACCEPTED 1 $61,920 6 $62,718 66 $35,192 25 $14,916 1 $16,940 9 $30,044 APPLICATIONS DENIED 3 $37,390 17 $44,016 177 $36,873 88 $13,902 0 $0 27 $31,933 APPLICATIONS WITHDRAWN 1 $38,960 4 $37,048 76 $37,178 32 $25,700 1 $54,790 6 $49,002 FILES CLOSED FOR INCOMPLETENESS 1 $52,690 2 $28,380 34 $36,374 2 $19,480 0 $0 5 $40,940
Private Mortgage Insurance Companies Aggregated Statistics For Year 2009(Based on 2 partial tracts) A) Conventional C) Non-occupant Loans on Number Average Value Number Average Value
LOANS ORIGINATED 0 $0 0 $0 APPLICATIONS APPROVED, NOT ACCEPTED 2 $50,195 1 $41,070 APPLICATIONS DENIED 0 $0 0 $0 APPLICATIONS WITHDRAWN 0 $0 0 $0 FILES CLOSED FOR INCOMPLETENESS 0 $0 0 $0
Aggregated Statistics For Year 2008(Based on 4 full and 6 partial tracts) A) Conventional B) Refinancings C) Non-occupant Loans on Number Average Value Number Average Value Number Average Value
LOANS ORIGINATED 8 $56,572 6 $40,478 4 $49,168 APPLICATIONS APPROVED, NOT ACCEPTED 5 $46,130 2 $43,660 1 $22,900 APPLICATIONS DENIED 6 $53,358 0 $0 0 $0 APPLICATIONS WITHDRAWN 0 $0 0 $0 0 $0 FILES CLOSED FOR INCOMPLETENESS 3 $67,110 1 $23,810 1 $109,520
Aggregated Statistics For Year 2007(Based on 4 full and 6 partial tracts) A) Conventional B) Refinancings C) Non-occupant Loans on Number Average Value Number Average Value Number Average Value
LOANS ORIGINATED 30 $66,079 7 $60,577 12 $68,371 APPLICATIONS APPROVED, NOT ACCEPTED 3 $51,520 3 $79,857 0 $0 APPLICATIONS DENIED 1 $75,100 0 $0 0 $0 APPLICATIONS WITHDRAWN 1 $31,140 0 $0 0 $0 FILES CLOSED FOR INCOMPLETENESS 0 $0 0 $0 0 $0
Aggregated Statistics For Year 2006(Based on 4 full and 6 partial tracts) A) Conventional B) Refinancings C) Non-occupant Loans on Number Average Value Number Average Value Number Average Value
LOANS ORIGINATED 23 $49,136 9 $72,224 15 $59,308 APPLICATIONS APPROVED, NOT ACCEPTED 11 $42,968 0 $0 3 $33,373 APPLICATIONS DENIED 3 $65,400 0 $0 3 $65,400 APPLICATIONS WITHDRAWN 1 $47,620 1 $77,570 1 $77,570 FILES CLOSED FOR INCOMPLETENESS 0 $0 0 $0 0 $0
Aggregated Statistics For Year 2005(Based on 4 full and 6 partial tracts) A) Conventional B) Refinancings C) Non-occupant Loans on Number Average Value Number Average Value Number Average Value
LOANS ORIGINATED 27 $45,518 1 $66,170 12 $44,767 APPLICATIONS APPROVED, NOT ACCEPTED 6 $46,840 1 $76,430 3 $50,980 APPLICATIONS DENIED 2 $64,190 0 $0 1 $84,420 APPLICATIONS WITHDRAWN 3 $75,673 0 $0 3 $75,673 FILES CLOSED FOR INCOMPLETENESS 1 $73,010 0 $0 1 $73,010
Aggregated Statistics For Year 2004(Based on 4 full and 6 partial tracts) A) Conventional B) Refinancings C) Non-occupant Loans on Number Average Value Number Average Value Number Average Value
LOANS ORIGINATED 34 $52,271 8 $52,162 6 $61,770 APPLICATIONS APPROVED, NOT ACCEPTED 1 $28,390 1 $30,220 1 $28,390 APPLICATIONS DENIED 2 $29,680 2 $40,560 4 $35,120 APPLICATIONS WITHDRAWN 2 $72,340 0 $0 2 $72,340 FILES CLOSED FOR INCOMPLETENESS 0 $0 0 $0 0 $0
Aggregated Statistics For Year 2003(Based on 4 full and 6 partial tracts) A) Conventional B) Refinancings C) Non-occupant Loans on Number Average Value Number Average Value Number Average Value
LOANS ORIGINATED 14 $50,932 8 $56,404 2 $50,195 APPLICATIONS APPROVED, NOT ACCEPTED 3 $60,100 2 $74,720 1 $84,420 APPLICATIONS DENIED 0 $0 0 $0 0 $0 APPLICATIONS WITHDRAWN 0 $0 0 $0 0 $0 FILES CLOSED FOR INCOMPLETENESS 0 $0 0 $0 0 $0
Aggregated Statistics For Year 2002(Based on 2 full and 4 partial tracts) A) Conventional B) Refinancings C) Non-occupant Loans on Number Average Value Number Average Value Number Average Value
LOANS ORIGINATED 13 $41,195 4 $52,012 6 $35,380 APPLICATIONS APPROVED, NOT ACCEPTED 0 $0 3 $77,813 0 $0 APPLICATIONS DENIED 1 $30,220 1 $84,420 1 $84,420 APPLICATIONS WITHDRAWN 0 $0 0 $0 0 $0 FILES CLOSED FOR INCOMPLETENESS 0 $0 0 $0 0 $0
Aggregated Statistics For Year 2001(Based on 2 full and 6 partial tracts) A) Conventional B) Refinancings C) Non-occupant Loans on Number Average Value Number Average Value Number Average Value
LOANS ORIGINATED 3 $42,210 10 $53,343 6 $42,780 APPLICATIONS APPROVED, NOT ACCEPTED 4 $19,968 4 $49,432 4 $19,968 APPLICATIONS DENIED 0 $0 2 $79,285 1 $66,170 APPLICATIONS WITHDRAWN 0 $0 0 $0 0 $0 FILES CLOSED FOR INCOMPLETENESS 0 $0 0 $0 0 $0
Aggregated Statistics For Year 2000(Based on 4 full and 6 partial tracts) A) Conventional B) Refinancings C) Non-occupant Loans on Number Average Value Number Average Value Number Average Value
LOANS ORIGINATED 22 $50,856 8 $44,052 4 $28,038 APPLICATIONS APPROVED, NOT ACCEPTED 1 $25,100 1 $37,550 1 $25,100 APPLICATIONS DENIED 6 $28,540 2 $62,515 5 $20,102 APPLICATIONS WITHDRAWN 0 $0 2 $47,485 2 $47,485 FILES CLOSED FOR INCOMPLETENESS 0 $0 0 $0 0 $0
Aggregated Statistics For Year 1999(Based on 2 full and 2 partial tracts) A) Conventional B) Refinancings C) Non-occupant Loans on Number Average Value Number Average Value Number Average Value
LOANS ORIGINATED 5 $23,500 13 $41,334 3 $33,973 APPLICATIONS APPROVED, NOT ACCEPTED 0 $0 0 $0 0 $0 APPLICATIONS DENIED 0 $0 0 $0 0 $0 APPLICATIONS WITHDRAWN 1 $34,970 0 $0 0 $0 FILES CLOSED FOR INCOMPLETENESS 0 $0 0 $0 0 $0
Most common first names in zip code 14208 among deceased individuals Name Count Lived (average)
James 212 70.3 years John 186 72.8 years William 148 73.6 years Mary 140 78.8 years Robert 112 69.9 years Willie 106 71.9 years Charles 93 73.1 years George 91 76.4 years Joseph 74 71.2 years Annie 63 76.5 years
Most common last names in zip code 14208 among deceased individuals Last name Count Lived (average)
Williams 135 72.6 years Johnson 114 71.3 years Smith 102 74.1 years Brown 99 70.3 years Jones 81 69.7 years Jackson 81 71.3 years Davis 51 74.0 years Harris 49 72.5 years Lewis 44 73.2 years Robinson 40 74.3 years
Businesses in zip code 14208
Name Count Name Count
Cricket Wireless 2 Tim Hortons 2 H&R Block 1 U-Haul 1 Nike 1

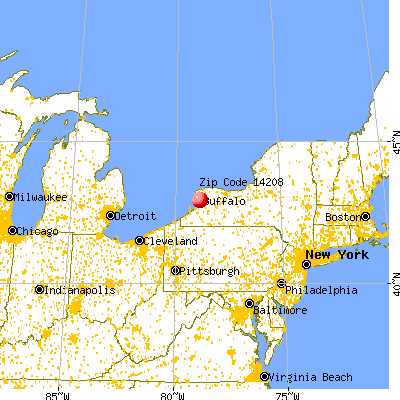

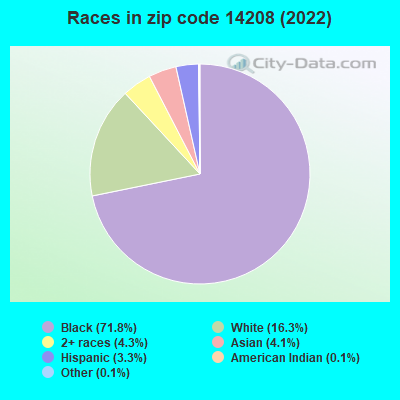


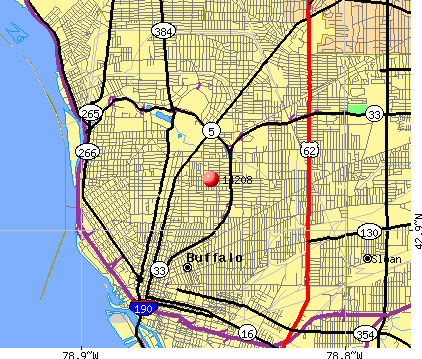 Nearest zip codes: 14209, 14222, 14214, 14211, 14216, 14204.