Estimated zip code population in 2022: 1,302 Zip code population in 2010: 1,273 Zip code population in 2000: 1,163
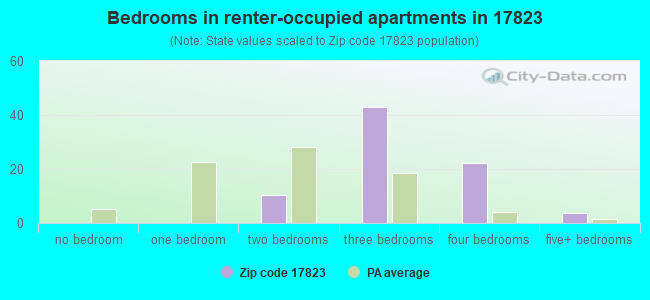
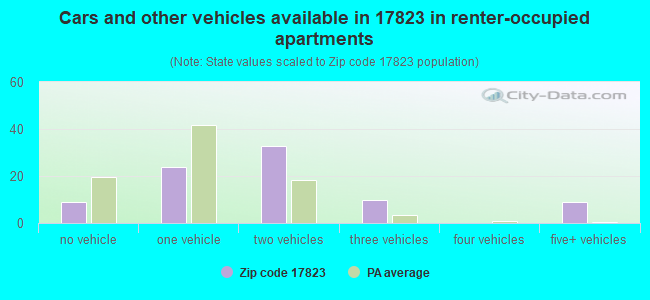
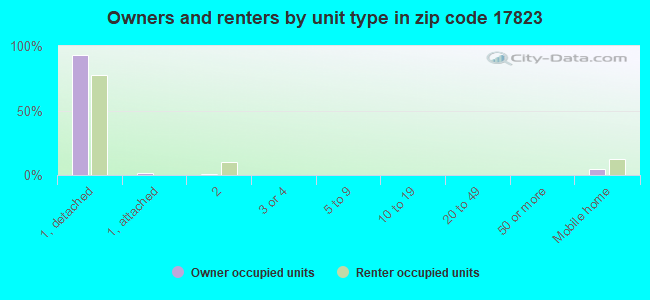
Houses and condos: 542 Renter-occupied apartments: 82
% of renters here:
17%
State:
31%
March 2022 cost of living index in zip code 17823: 92.1 (less than average, U.S. average is 100)
Land area: 34.3 sq. mi. Water area: 0.1 sq. mi.
Population density: 38 people per square mile
(very low).
OSM Map
General Map
Google Map
MSN Map
OSM Map
General Map
Google Map
MSN Map
OSM Map
General Map
Google Map
MSN Map
OSM Map
General Map
Google Map
MSN Map
Please wait while loading the map...
Real estate property taxes paid for housing units in 2022:
This zip code:
1.1% ($2,463)
Pennsylvania:
1.3% ($3,094)
Median real estate property taxes paid for housing units with mortgages in 2022: $2,707 (1.2%) Median real estate property taxes paid for housing units with no mortgage in 2022: $2,226 (1.1%)
Business Search- 14 Million verified businesses
Males: 657
(50.5%)
Females: 644
(49.5%)
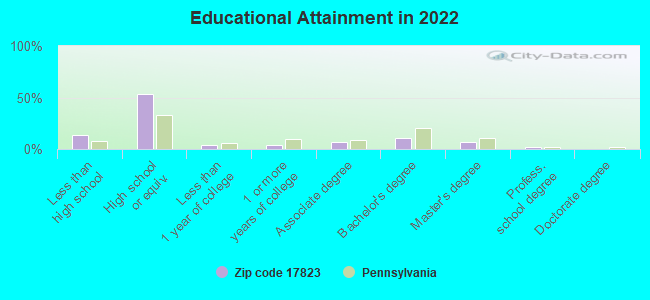
For population 25 years and over in 17823:
High school or higher: 84.5%
Bachelor's degree or higher: 18.6%
Graduate or professional degree: 8.3%
Unemployed: 0.4%
Mean travel time to work (commute): 27.8 minutes
For population 15 years and over in 17823:
Never married: 20.7%
Now married: 69.0%
Separated: 0.3%
Widowed: 5.0%
Divorced: 5.0%
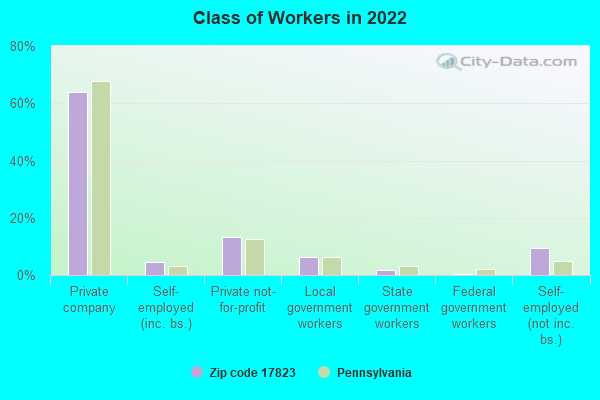
Zip code 17823 compared to state average:
Unemployed percentage significantly below state average.
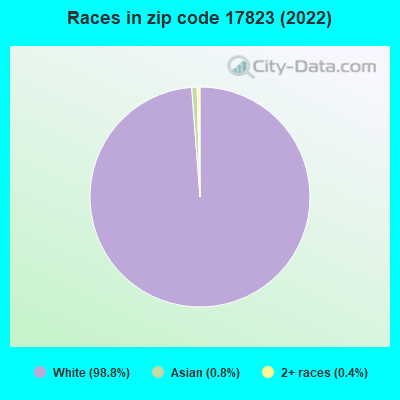
Black race population percentage significantly below state average.
Hispanic race population percentage significantly below state average.
Median age above state average.
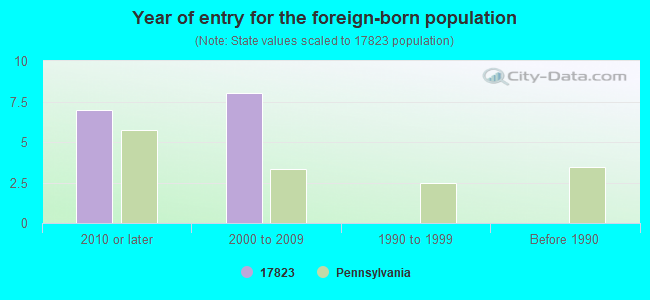
Foreign-born population percentage significantly below state average.
Renting percentage below state average.
Length of stay since moving in significantly above state average.
Number of college students below state average.
Percentage of population with a bachelor's degree or higher below state average.
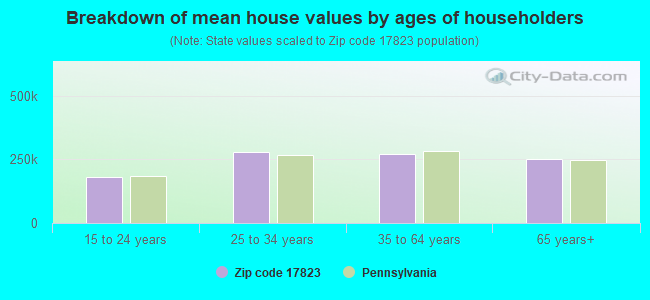
Estimated median house/condo value in 2022: $222,708
17823:
$222,708
Pennsylvania:
$245,500
Median resident age:
This zip code:
46.5 years
Pennsylvania median age:
40.9 years
Average household size:
This zip code:
2.6 people
Pennsylvania:
2.4 people
Averages for the 2020 tax year for zip code 17823, filed in 2021:
Average Adjusted Gross Income (AGI) in 2020: $57,640 (Individual Income Tax Returns)
Here:
$57,640
State:
$75,707
Salary/wage: $46,100 (reported on 77.8% of returns)
Here:
$46,100
State:
$62,806
(% of AGI for various income ranges: 1505.0% for AGIs below $25k, 4974.4% for AGIs $25k-50k, 8112.0% for AGIs $50k-75k, 10638.0% for AGIs $75k-100k, 18832.5% for AGIs $100k-200k)
Taxable interest for individuals: $695 (reported on 33.3% of returns)
This zip code:
$695
Pennsylvania:
$1,633
(% of AGI for various income ranges: 27.5% for AGIs below $25k, 20.0% for AGIs $25k-50k, 36.0% for AGIs $50k-75k, 8.0% for AGIs $75k-100k, 210.0% for AGIs $100k-200k)
Ordinary dividends: $2,018 (reported on 17.5% of returns)
Here:
$2,018
State:
$7,382
(% of AGI for various income ranges: 26.2% for AGIs below $25k, 22.2% for AGIs $25k-50k, 36.0% for AGIs $50k-75k, 407.5% for AGIs $100k-200k)
Net capital gain/loss in AGI: +$6,056 (reported on 14.3% of returns)
Here:
+$6,056
State:
+$23,522
(% of AGI for various income ranges: 63.3% for AGIs $25k-50k, 52.0% for AGIs $50k-75k, 1155.0% for AGIs $100k-200k)
Profit/loss from business: +$17,469 (reported on 20.6% of returns)
Here:
+$17,469
State:
+$16,274
(% of AGI for various income ranges: 283.8% for AGIs below $25k, 243.3% for AGIs $25k-50k, 1134.0% for AGIs $50k-75k, 874.0% for AGIs $75k-100k, 2052.5% for AGIs $100k-200k)
Taxable individual retirement arrangement distribution: $6,886 (reported on 11.1% of returns)
17823:
$6,886
Pennsylvania:
$18,583
(% of AGI for various income ranges: 245.0% for AGIs below $25k, 572.0% for AGIs $50k-75k)
Earned income credit: $2,000 (reported on 7.9% of returns)
Here:
$2,000
State:
$2,100
(% of AGI for various income ranges: 75.0% for AGIs below $25k, 44.4% for AGIs $25k-50k)
Percentage of individuals using paid preparers for their 2020 taxes: 92.1%
Here:
92%
State:
92%
(% for various income ranges: 90.0% for AGIs below $25k, 93.3% for AGIs $25k-50k, 90.0% for AGIs $50k-75k, 100.0% for AGIs $75k-100k, 90.0% for AGIs $100k-200k)
Averages for the 2012 tax year for zip code 17823, filed in 2013:
Average Adjusted Gross Income (AGI) in 2012: $42,770 (Individual Income Tax Returns)
Here:
$42,770
State:
$61,346
Salary/wage: $39,249 (reported on 80.4% of returns)
Here:
$39,249
State:
$51,902
(% of AGI for various income ranges: 61.7% for AGIs below $25k, 78.3% for AGIs $25k-50k, 76.6% for AGIs $50k-75k, 84.2% for AGIs $75k-100k, 63.8% for AGIs $100k-200k)
Taxable interest for individuals: $835 (reported on 41.1% of returns)
This zip code:
$835
Pennsylvania:
$1,588
(% of AGI for various income ranges: 4.0% for AGIs below $25k, 0.8% for AGIs $25k-50k, 0.2% for AGIs $50k-75k, 0.3% for AGIs $75k-100k, 0.5% for AGIs $100k-200k)
Ordinary dividends: $1,125 (reported on 21.4% of returns)
Here:
$1,125
State:
$5,827
(% of AGI for various income ranges: 0.8% for AGIs below $25k, 0.7% for AGIs $25k-50k, 0.3% for AGIs $50k-75k, 1.0% for AGIs $100k-200k)
Net capital gain/loss in AGI: +$1,817 (reported on 10.7% of returns)
Here:
+$1,817
State:
+$14,495
Profit/loss from business: +$8,709 (reported on 19.6% of returns)
Here:
+$8,709
State:
+$16,268
(% of AGI for various income ranges: 5.5% for AGIs below $25k, 4.3% for AGIs $25k-50k, 10.0% for AGIs $50k-75k)
Taxable individual retirement arrangement distribution: $7,086 (reported on 12.5% of returns)
17823:
$7,086
Pennsylvania:
$14,550
Total itemized deductions: $19,627 (24% of AGI, reported on 19.6% of returns)
Here:
$19,627
State:
$23,538
Here:
24.2% of AGI
State:
18.4% of AGI
(% of AGI for various income ranges: 8.5% for AGIs $25k-50k, 8.3% for AGIs $50k-75k, 10.3% for AGIs $75k-100k, 13.1% for AGIs $100k-200k)
Charity contributions: $2,512 (reported on 14.3% of returns)
Here:
$2,512
State:
$4,025
Taxes paid: $6,127 (reported on 19.6% of returns)
17823:
$6,127
State:
$9,982
(% of AGI for various income ranges: 1.7% for AGIs $25k-50k, 2.5% for AGIs $50k-75k, 3.2% for AGIs $75k-100k, 5.1% for AGIs $100k-200k)
Earned income credit: $2,075 (reported on 14.3% of returns)
Here:
$2,075
State:
$2,106
(% of AGI for various income ranges: 4.0% for AGIs below $25k, 1.2% for AGIs $25k-50k)
Percentage of individuals using paid preparers for their 2012 taxes: 67.9%
Here:
68%
State:
53%
(% for various income ranges: 63.6% for AGIs below $25k, 75.0% for AGIs $25k-50k, 66.7% for AGIs $50k-75k, 60.0% for AGIs $75k-100k, 75.0% for AGIs $100k-200k)
Averages for the 2004 tax year for zip code 17823, filed in 2005:
Average Adjusted Gross Income (AGI) in 2004: $36,299 (Individual Income Tax Returns)
Here:
$36,299
State:
$48,049
Salary/wage: $33,536 (reported on 83.3% of returns)
Here:
$33,536
State:
$42,646
(% of AGI for various income ranges: 73.8% for AGIs below $10k, 71.0% for AGIs $10k-25k, 79.6% for AGIs $25k-50k, 82.1% for AGIs $50k-75k, 88.7% for AGIs $75k-100k, 52.4% for AGIs over 100k)
Taxable interest for individuals: $962 (reported on 54.9% of returns)
This zip code:
$962
Pennsylvania:
$1,657
(% of AGI for various income ranges: 10.8% for AGIs below $10k, 3.6% for AGIs $10k-25k, 0.9% for AGIs $25k-50k, 1.3% for AGIs $50k-75k, 0.6% for AGIs $75k-100k, 0.4% for AGIs over 100k)
Taxable dividends: $774 (reported on 25.2% of returns)
Here:
$774
State:
$3,566
(% of AGI for various income ranges: 4.5% for AGIs below $10k, 0.9% for AGIs $10k-25k, 0.3% for AGIs $25k-50k, 0.5% for AGIs $50k-75k, 0.6% for AGIs $75k-100k)
Net capital gain/loss: +$3,000 (reported on 14.8% of returns)
Here:
+$3,000
State:
+$9,716
(% of AGI for various income ranges: 1.2% for AGIs $10k-25k, 0.8% for AGIs $25k-50k, 1.4% for AGIs $50k-75k, 2.8% for AGIs $75k-100k)
Profit/loss from business: +$6,474 (reported on 18.0% of returns)
Here:
+$6,474
State:
+$14,267
(% of AGI for various income ranges: 0.9% for AGIs below $10k, 11.0% for AGIs $10k-25k, 5.0% for AGIs $25k-50k, 1.7% for AGIs $50k-75k)
Profit/loss from farming: +$1,760 (reported on 4.7% of returns)
Here:
+$1,760
State:
+$274
IRA payment deduction: $2,150 (reported on 3.8% of returns)
17823:
$2,150
Pennsylvania:
$2,903
Total itemized deductions: $13,934 (19% of AGI, reported on 17.2% of returns)
Here:
$13,934
State:
$18,804
Here:
18.9% of AGI
State:
19.5% of AGI
(% of AGI for various income ranges: 6.2% for AGIs $25k-50k, 6.9% for AGIs $50k-75k, 11.1% for AGIs $75k-100k, 8.3% for AGIs over 100k)
Charity contributions deductions: $1,726 (2% of AGI, reported on 13.8% of returns)
Here:
$1,726
State:
$3,337
Here:
2.2% of AGI
State:
3.3% of AGI
(% of AGI for various income ranges: 0.5% for AGIs $25k-50k, 0.8% for AGIs $50k-75k, 1.0% for AGIs $75k-100k, 1.0% for AGIs over 100k)
Total tax: $4,244 (reported on 75.4% of returns)
17823:
$4,244
State:
$8,008
(% of AGI for various income ranges: 5.4% for AGIs below $10k, 5.3% for AGIs $10k-25k, 6.7% for AGIs $25k-50k, 8.3% for AGIs $50k-75k, 8.9% for AGIs $75k-100k, 17.8% for AGIs over 100k)
Earned income credit: $1,544 (reported on 10.8% of returns)
Here:
$1,544
State:
$1,643
Percentage of individuals using paid preparers for their 2004 taxes: 67.6%
Here:
68%
State:
56%
(% for various income ranges: 56.5% for AGIs below $10k, 75.8% for AGIs $10k-25k, 66.4% for AGIs $25k-50k, 69.0% for AGIs $50k-75k, 71.8% for AGIs $75k-100k, 75.0% for AGIs over 100k)
Likely homosexual households (counted as self-reported same-sex unmarried-partner households)
Lesbian couples: 0.0% of all households
Gay men: 0.9% of all households
Household received Food Stamps/SNAP in the past 12 months: 20 Household did not receive Food Stamps/SNAP in the past 12 months: 473
Women who had a birth in the past 12 months: 15 (13 now married, 2 unmarried) Women who did not have a birth in the past 12 months: 234 (133 now married, 99 unmarried)
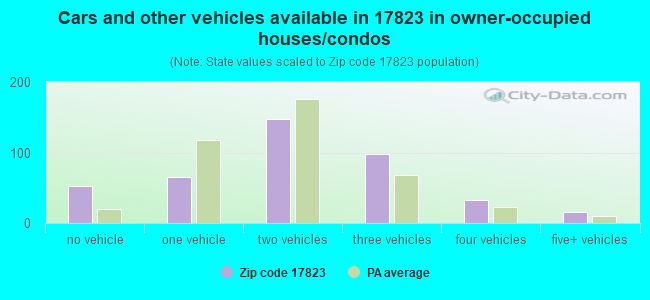
Housing units in zip code 17823 with a mortgage: 229 (42 second mortgage, 34 both second mortgage and home equity loan) Houses without a mortgage: 22
Median monthly owner costs for units with a mortgage: $1,321 Median monthly owner costs for units without a mortgage: $470
Residents with income below the poverty level in 2022:
This zip code:
7.3%
Whole state:
11.8%
Residents with income below 50% of the poverty level in 2022:
This zip code:
4.8%
Whole state:
6.1%
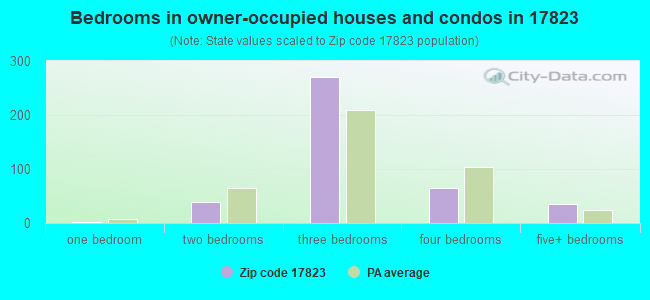
Median number of rooms in houses and condos:
Here:
6.7
State:
6.8
Median number of rooms in apartments:
Here:
6.7
State:
4.3
Notable locations in this zip code not listed on our city pages
Size of family households: 213 2-persons, 77 3-persons, 57 4-persons, 23 5-persons, 6 6-persons, 26 7-or-more-persons
Size of nonfamily households: 71 1-person, 21 2-persons
282 married couples with children.
14 single-parent households (3 men, 11 women).
82.3% of residents of 17823 zip code speak English at home.
17.5% of residents speak other Indo-European language at home (75% very well, 21% well, 3% not well, 1% not at all).
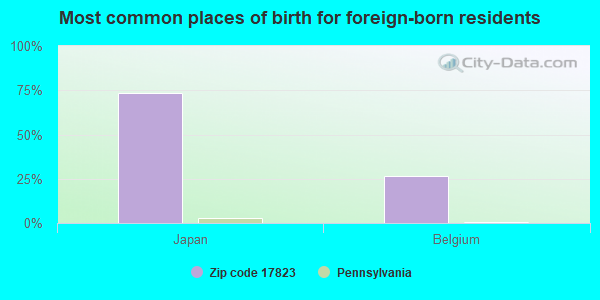
Foreign born population: 15 (1.2%) (87.1% of them are naturalized citizens)
This zip code:
1.2%
Whole state:
7.5%
73%Japan
27%Belgium
57%German
9%American
7%English
5%Pennsylvania German
3%Polish
2%British
2%European
Year of entry for the foreign-born population
72010 or later
82000 to 2009
01990 to 1999
0Before 1990
Private elementary/middle school in in this zip code not listed on the city page:
CHERRYTOWN SCHOOL (Students: 25, Location: 1203 CHERRY TOWN RD, Grades: 1-8)
Housing units lacking complete plumbing facilities: 5.6% Housing units lacking complete kitchen facilities: 6.1%
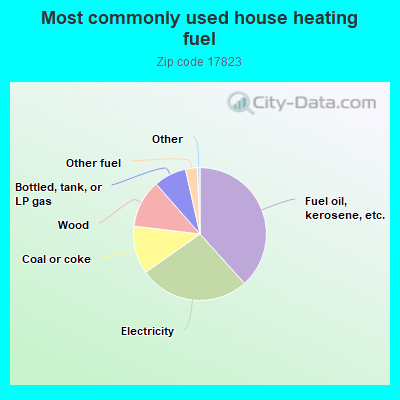
38.5%Fuel oil, kerosene, etc.
27.0%Electricity
11.7%Coal or coke
11.7%Wood
8.0%Bottled, tank, or LP gas
2.9%Other fuel
Population in 1990: 432. Population change in the 1990s: +731 (+169.2%).
Place of birth for U.S.-born residents:
This state: 1,177
Northeast: 21
Midwest: 11
South: 59
West: 5
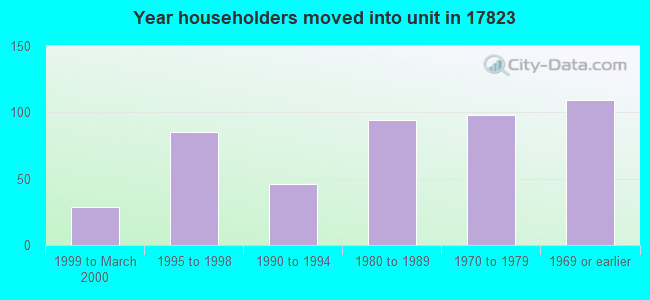
80% of the 17823 zip code residents lived in the same house 5 years ago. Out of people who lived in different houses, 69% lived in this county. Out of people who lived in different counties, 50% lived in Pennsylvania.
94% of the 17823 zip code residents lived in the same house 1 year ago. Out of people who lived in different houses, 56% moved from this county. Out of people who lived in different houses, 29% moved from different county within same state. Out of people who lived in different houses, 15% moved from different state.
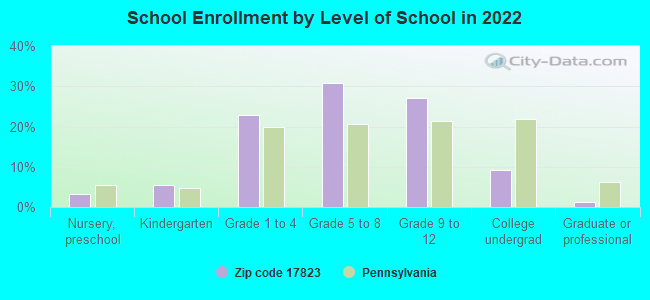
Private vs. public school enrollment:
Students in private schools in grades 1 to 8 (elementary and middle school): 75
Here:
56.7%
Pennsylvania:
15.7%
Students in private schools in grades 9 to 12 (high school): 9
Here:
15.1%
Pennsylvania:
13.4%
Students in private undergraduate colleges: 9
Here:
43.5%
Pennsylvania:
39.8%
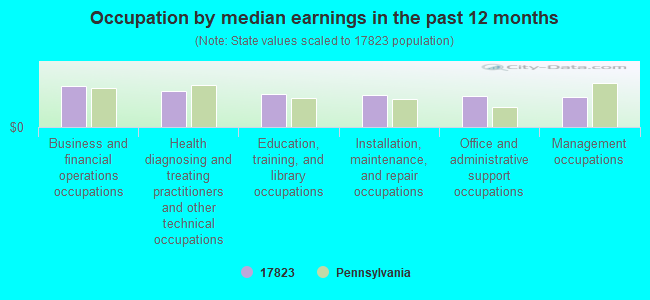
Occupation by median earnings in the past 12 months ($)
61,099Business and financial operations occupations
53,465Health diagnosing and treating practitioners and other technical occupations
50,085Education, training, and library occupations
48,199Installation, maintenance, and repair occupations
46,217Office and administrative support occupations
44,557Management occupations
Top industries in this zip code by the number of employees in 2005:
Administrative and Support and Waste Management and Remediation Services: Solid Waste Collection (5-9 employees: 1 establishment)
Other Services (except Public Administration): Labor Unions and Similar Labor Organizations (5-9: 1)
Construction: New Single-Family Housing Construction (except Operative Builders) (5-9: 1)
Other Services (except Public Administration): Religious Organizations (1-4: 1)
Administrative and Support and Waste Management and Remediation Services: Exterminating and Pest Control Services (1-4: 1)
Fatal accident statistics in 2014:
Fatal accident count: 1
Vehicles involved in fatal accidents: 1
Fatal accidents caused by drunken drivers: 0
Fatalities: 1
Persons involved in fatal accidents: 3
Pedestrians involved in fatal accidents: 0
Most common first names in zip code 17823 among deceased individuals
Name
Count
Lived (average)
John
11
72.5 years
Charles
9
78.4 years
George
9
80.8 years
William
8
74.7 years
Robert
7
73.1 years
Earl
7
75.4 years
Harry
7
76.6 years
Samuel
5
76.0 years
Daniel
4
83.9 years
Guy
4
78.3 years
Most common last names in zip code 17823 among deceased individuals

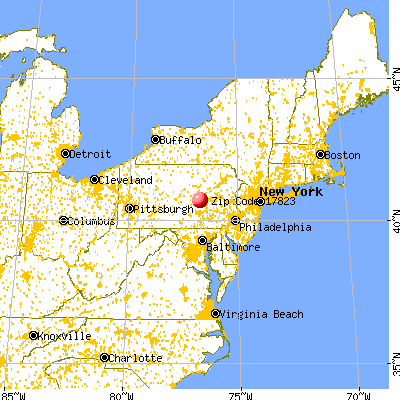


 Nearest zip codes: 17830, 17872, 17801, 17867, 17080, 17881.


 (Students: 25, Location: 1203 CHERRY TOWN RD, Grades: 1-8)