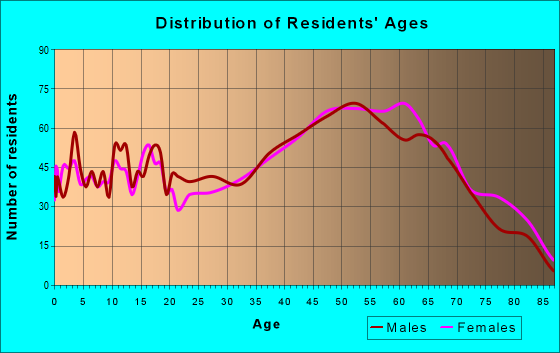
Estimated zip code population in 2022: 8,612 Zip code population in 2010: 8,013 Zip code population in 2000: 8,528
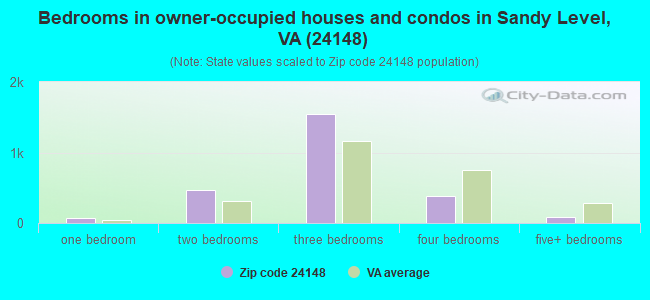
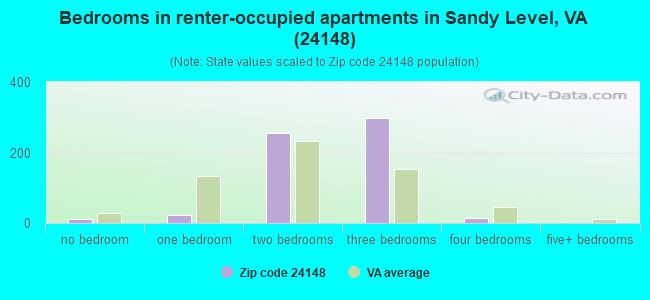
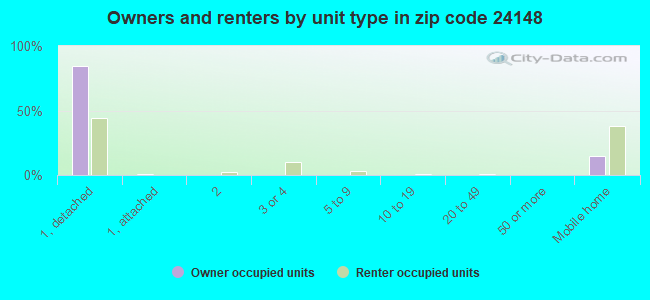
Houses and condos: 3,945 Renter-occupied apartments: 610
% of renters here:
19%
State:
33%
March 2022 cost of living index in zip code 24148: 83.2 (low, U.S. average is 100)
Land area: 71.3 sq. mi. Water area: 0.2 sq. mi.
Population density: 121 people per square mile
(very low).
OSM Map
General Map
Google Map
MSN Map
OSM Map
General Map
Google Map
MSN Map
OSM Map
General Map
Google Map
MSN Map
OSM Map
General Map
Google Map
MSN Map
Please wait while loading the map...
Real estate property taxes paid for housing units in 2022:
This zip code:
0.4% ($633)
Virginia:
0.7% ($2,617)
Median real estate property taxes paid for housing units with mortgages in 2022: $603 (0.4%) Median real estate property taxes paid for housing units with no mortgage in 2022: $679 (0.5%)
Averages for the 2020 tax year for zip code 24148, filed in 2021:
Average Adjusted Gross Income (AGI) in 2020: $45,066 (Individual Income Tax Returns)
Here:
$45,066
State:
$86,446
Salary/wage: $40,259 (reported on 82.8% of returns)
Here:
$40,259
State:
$71,185
(% of AGI for various income ranges: 1150.8% for AGIs below $25k, 3654.2% for AGIs $25k-50k, 6315.8% for AGIs $50k-75k, 10018.3% for AGIs $75k-100k, 14908.9% for AGIs $100k-200k)
Taxable interest for individuals: $1,134 (reported on 25.2% of returns)
This zip code:
$1,134
Virginia:
$1,805
(% of AGI for various income ranges: 20.3% for AGIs below $25k, 17.1% for AGIs $25k-50k, 45.3% for AGIs $50k-75k, 106.1% for AGIs $75k-100k, 137.4% for AGIs $100k-200k)
Ordinary dividends: $5,344 (reported on 11.2% of returns)
Here:
$5,344
State:
$8,327
(% of AGI for various income ranges: 20.7% for AGIs below $25k, 31.5% for AGIs $25k-50k, 79.2% for AGIs $50k-75k, 172.8% for AGIs $75k-100k, 531.6% for AGIs $100k-200k)
Net capital gain/loss in AGI: +$6,234 (reported on 10.0% of returns)
Here:
+$6,234
State:
+$24,644
(% of AGI for various income ranges: 5.0% for AGIs below $25k, 11.6% for AGIs $25k-50k, 33.6% for AGIs $50k-75k, 141.7% for AGIs $75k-100k, 446.3% for AGIs $100k-200k)
Profit/loss from business: +$7,800 (reported on 12.0% of returns)
Here:
+$7,800
State:
+$12,836
(% of AGI for various income ranges: 90.5% for AGIs below $25k, 67.9% for AGIs $25k-50k, 138.9% for AGIs $50k-75k, 55.0% for AGIs $75k-100k, 625.3% for AGIs $100k-200k)
Taxable individual retirement arrangement distribution: $10,621 (reported on 9.7% of returns)
24148:
$10,621
Virginia:
$21,535
(% of AGI for various income ranges: 71.4% for AGIs below $25k, 92.3% for AGIs $25k-50k, 235.8% for AGIs $50k-75k, 258.9% for AGIs $75k-100k, 414.7% for AGIs $100k-200k)
Total itemized deductions: $30,400 (reported on 3.7% of returns)
Here:
$30,400
State:
$33,287
(% of AGI for various income ranges: 85.1% for AGIs $25k-50k, 388.1% for AGIs $50k-75k, 959.5% for AGIs $100k-200k)
Charity contributions: $11,592 (reported on 3.4% of returns)
Here:
$11,592
State:
$10,381
(% of AGI for various income ranges: 22.1% for AGIs $25k-50k, 131.9% for AGIs $50k-75k, 382.1% for AGIs $100k-200k)
Taxes paid: $5,400 (reported on 3.7% of returns)
24148:
$5,400
State:
$8,284
(% of AGI for various income ranges: 12.1% for AGIs $25k-50k, 61.1% for AGIs $50k-75k, 198.9% for AGIs $100k-200k)
Earned income credit: $2,293 (reported on 21.8% of returns)
Here:
$2,293
State:
$2,214
(% of AGI for various income ranges: 109.5% for AGIs below $25k, 75.3% for AGIs $25k-50k)
Percentage of individuals using paid preparers for their 2020 taxes: 89.1%
Here:
89%
State:
92%
(% for various income ranges: 87.2% for AGIs below $25k, 90.6% for AGIs $25k-50k, 88.0% for AGIs $50k-75k, 92.6% for AGIs $75k-100k, 90.0% for AGIs $100k-200k, 100.0% for AGIs over 200k)
Averages for the 2012 tax year for zip code 24148, filed in 2013:
Average Adjusted Gross Income (AGI) in 2012: $39,032 (Individual Income Tax Returns)
Here:
$39,032
State:
$71,192
Salary/wage: $34,558 (reported on 85.0% of returns)
Here:
$34,558
State:
$59,229
(% of AGI for various income ranges: 75.6% for AGIs below $25k, 80.2% for AGIs $25k-50k, 74.9% for AGIs $50k-75k, 78.4% for AGIs $75k-100k, 66.7% for AGIs $100k-200k)
Taxable interest for individuals: $1,245 (reported on 33.9% of returns)
This zip code:
$1,245
Virginia:
$1,600
(% of AGI for various income ranges: 1.4% for AGIs below $25k, 1.0% for AGIs $25k-50k, 1.1% for AGIs $50k-75k, 0.8% for AGIs $75k-100k, 1.1% for AGIs $100k-200k)
Ordinary dividends: $3,811 (reported on 14.1% of returns)
Here:
$3,811
State:
$6,959
(% of AGI for various income ranges: 1.0% for AGIs below $25k, 0.6% for AGIs $25k-50k, 0.9% for AGIs $50k-75k, 0.5% for AGIs $75k-100k, 3.8% for AGIs $100k-200k)
Net capital gain/loss in AGI: +$1,246 (reported on 8.4% of returns)
Here:
+$1,246
State:
+$16,672
(% of AGI for various income ranges: 1.6% for AGIs $100k-200k)
Profit/loss from business: +$5,147 (reported on 11.4% of returns)
Here:
+$5,147
State:
+$14,116
(% of AGI for various income ranges: 4.7% for AGIs below $25k, 0.9% for AGIs $25k-50k, 1.4% for AGIs $50k-75k, 1.3% for AGIs $75k-100k, 0.2% for AGIs $100k-200k)
Taxable individual retirement arrangement distribution: $10,808 (reported on 11.1% of returns)
24148:
$10,808
Virginia:
$16,667
(% of AGI for various income ranges: 2.9% for AGIs below $25k, 2.7% for AGIs $25k-50k, 3.1% for AGIs $50k-75k, 3.1% for AGIs $75k-100k, 3.6% for AGIs $100k-200k)
Total itemized deductions: $17,053 (23% of AGI, reported on 19.8% of returns)
Here:
$17,053
State:
$26,596
Here:
23.4% of AGI
State:
20.1% of AGI
(% of AGI for various income ranges: 5.5% for AGIs below $25k, 7.1% for AGIs $25k-50k, 8.3% for AGIs $50k-75k, 10.0% for AGIs $75k-100k, 12.0% for AGIs $100k-200k)
Charity contributions: $4,316 (reported on 16.5% of returns)
Here:
$4,316
State:
$4,443
(% of AGI for various income ranges: 0.5% for AGIs below $25k, 1.2% for AGIs $25k-50k, 2.1% for AGIs $50k-75k, 2.5% for AGIs $75k-100k, 2.7% for AGIs $100k-200k)
Taxes paid: $4,532 (reported on 19.5% of returns)
24148:
$4,532
State:
$9,951
(% of AGI for various income ranges: 0.5% for AGIs below $25k, 1.1% for AGIs $25k-50k, 2.0% for AGIs $50k-75k, 2.8% for AGIs $75k-100k, 4.7% for AGIs $100k-200k)
Earned income credit: $2,179 (reported on 24.6% of returns)
Here:
$2,179
State:
$2,211
(% of AGI for various income ranges: 7.2% for AGIs below $25k, 1.2% for AGIs $25k-50k)
Percentage of individuals using paid preparers for their 2012 taxes: 62.2%
Here:
62%
State:
46%
(% for various income ranges: 56.0% for AGIs below $25k, 63.7% for AGIs $25k-50k, 71.1% for AGIs $50k-75k, 70.4% for AGIs $75k-100k, 70.0% for AGIs $100k-200k)
Averages for the 2004 tax year for zip code 24148, filed in 2005:
Average Adjusted Gross Income (AGI) in 2004: $34,422 (Individual Income Tax Returns)
Here:
$34,422
State:
$56,704
Salary/wage: $31,052 (reported on 85.6% of returns)
Here:
$31,052
State:
$48,441
(% of AGI for various income ranges: 86.3% for AGIs below $10k, 77.2% for AGIs $10k-25k, 80.6% for AGIs $25k-50k, 83.9% for AGIs $50k-75k, 82.5% for AGIs $75k-100k, 51.1% for AGIs over 100k)
Taxable interest for individuals: $1,389 (reported on 43.0% of returns)
This zip code:
$1,389
Virginia:
$1,688
(% of AGI for various income ranges: 4.3% for AGIs below $10k, 2.1% for AGIs $10k-25k, 1.8% for AGIs $25k-50k, 1.2% for AGIs $50k-75k, 1.2% for AGIs $75k-100k, 2.4% for AGIs over 100k)
Taxable dividends: $2,507 (reported on 17.2% of returns)
Here:
$2,507
State:
$4,028
(% of AGI for various income ranges: 1.7% for AGIs below $10k, 1.0% for AGIs $10k-25k, 0.7% for AGIs $25k-50k, 0.7% for AGIs $50k-75k, 1.2% for AGIs $75k-100k, 3.7% for AGIs over 100k)
Net capital gain/loss: +$2,461 (reported on 11.2% of returns)
Here:
+$2,461
State:
+$14,375
(% of AGI for various income ranges: -0.8% for AGIs below $10k, 0.4% for AGIs $10k-25k, 0.4% for AGIs $25k-50k, 0.3% for AGIs $50k-75k, 0.6% for AGIs $75k-100k, 3.5% for AGIs over 100k)
Profit/loss from business: +$7,998 (reported on 11.6% of returns)
Here:
+$7,998
State:
+$13,342
(% of AGI for various income ranges: 6.6% for AGIs below $10k, 2.5% for AGIs $10k-25k, 2.7% for AGIs $25k-50k, 1.7% for AGIs $50k-75k, 1.4% for AGIs $75k-100k, 5.3% for AGIs over 100k)
IRA payment deduction: $2,795 (reported on 2.2% of returns)
24148:
$2,795
Virginia:
$2,943
(% of AGI for various income ranges: 0.1% for AGIs $10k-25k, 0.2% for AGIs $25k-50k, 0.3% for AGIs $50k-75k, 0.2% for AGIs over 100k)
Total itemized deductions: $14,981 (23% of AGI, reported on 22.1% of returns)
Here:
$14,981
State:
$21,492
Here:
23.2% of AGI
State:
21.0% of AGI
(% of AGI for various income ranges: 7.6% for AGIs below $10k, 6.1% for AGIs $10k-25k, 8.1% for AGIs $25k-50k, 10.4% for AGIs $50k-75k, 12.9% for AGIs $75k-100k, 12.4% for AGIs over 100k)
Charity contributions deductions: $3,422 (5% of AGI, reported on 19.3% of returns)
Here:
$3,422
State:
$3,794
Here:
5.1% of AGI
State:
3.5% of AGI
(% of AGI for various income ranges: 0.9% for AGIs below $10k, 1.1% for AGIs $10k-25k, 1.5% for AGIs $25k-50k, 2.3% for AGIs $50k-75k, 2.9% for AGIs $75k-100k, 2.3% for AGIs over 100k)
Total tax: $3,925 (reported on 73.9% of returns)
24148:
$3,925
State:
$9,537
(% of AGI for various income ranges: 2.4% for AGIs below $10k, 3.6% for AGIs $10k-25k, 6.4% for AGIs $25k-50k, 8.2% for AGIs $50k-75k, 10.2% for AGIs $75k-100k, 18.1% for AGIs over 100k)
Earned income credit: $1,616 (reported on 19.8% of returns)
Here:
$1,616
State:
$1,734
Percentage of individuals using paid preparers for their 2004 taxes: 77.7%
Here:
78%
State:
52%
(% for various income ranges: 70.3% for AGIs below $10k, 79.3% for AGIs $10k-25k, 79.9% for AGIs $25k-50k, 78.5% for AGIs $50k-75k, 79.6% for AGIs $75k-100k, 75.5% for AGIs over 100k)
Household received Food Stamps/SNAP in the past 12 months: 443 Household did not receive Food Stamps/SNAP in the past 12 months: 2,743
Women who had a birth in the past 12 months: 23 (12 now married, 9 unmarried) Women who did not have a birth in the past 12 months: 1,639 (702 now married, 936 unmarried)
Housing units in zip code 24148 with a mortgage: 1,264 (91 second mortgage, 75 both second mortgage and home equity loan) Houses without a mortgage: 114
Median monthly owner costs for units with a mortgage: $970 Median monthly owner costs for units without a mortgage: $342
Residents with income below the poverty level in 2022:
This zip code:
13.9%
Whole state:
10.6%
Residents with income below 50% of the poverty level in 2022:
This zip code:
8.9%
Whole state:
5.2%
Median number of rooms in houses and condos:
Here:
6.2
State:
7.0
Median number of rooms in apartments:
Here:
4.5
State:
4.3
Notable locations in this zip code not listed on our city pages
Notable locations in zip code 24148: Ridgeway Sportsmen Club (A), Lees Ford Camp (B), Martinsville Speedway (C), Forest Park Country Club (D). Display/hide their locations on the map
Churches in zip code 24148 include: Bethel Church (A), Smith Memorial Church (B), Friendly Church (C), Friendship Church (D), Goodwill Church (E), Grace Church (F), Whites Chapel (G), Horse Pasture Church (H), Mayo Church (I). Display/hide their locations on the map
Streams, rivers, and creeks: Turkeypen Branch (A), Turkeycock Creek (B), Toeclout Branch (C), Surry Martin Branch (D), Stuart Creek (E), Stillhouse Run (F), Spencers Mill Creek (G), Reds Creek (H), Middle Creek (I). Display/hide their locations on the map
In group quarters: 261 (-1 institutionalized population)
Size of family households: 1,099 2-persons, 458 3-persons, 289 4-persons, 84 5-persons, 93 6-persons, 1 7-or-more-persons
Size of nonfamily households: 866 1-person, 285 2-persons
1,223 married couples with children.
557 single-parent households (208 men, 349 women).
95.5% of residents of 24148 zip code speak English at home.
2.9% of residents speak Spanish at home (73% very well, 27% well).
0.2% of residents speak other Indo-European language at home (44% very well, 56% well).
1.2% of residents speak Asian or Pacific Island language at home (77% very well, 5% well, 18% not well).
0.2% of residents speak other language at home (100% very well).
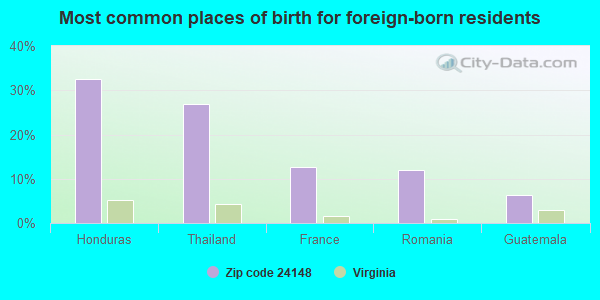
Foreign born population: 128 (1.5%) (69.6% of them are naturalized citizens)
This zip code:
1.5%
Whole state:
12.7%
33%Honduras
27%Thailand
13%France
12%Romania
6%Guatemala
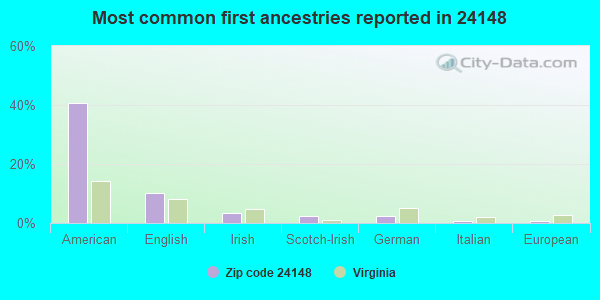
41%American
10%English
3%Irish
3%Scotch-Irish
2%German
1%Italian
1%European
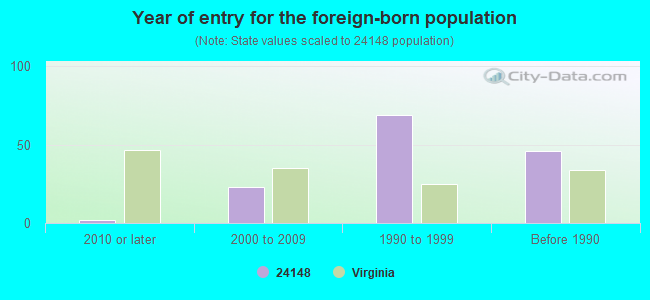
Year of entry for the foreign-born population
22010 or later
232000 to 2009
691990 to 1999
46Before 1990
Facilities with environmental interests located in this zip code:
AMERICAN FURNITURE COMPANY - CENTURY PARK (680 OLD SAND ROAD in RIDGEWAY, VA)
AIR SYNTHETIC MINOR (AIRS/AFS) STATE MASTER (Virginia pollutants databases) - CEDS-30786, AIR PROGRAM (Integrated Compliance Information System) - ICIS-03-1997-0389, FORMAL ENFORCEMENT ACTION CRITERIA AND HAZARDOUS AIR POLLUTANT INVENTORY (Inventory of air pollution sources) TRI REPORTER (Tracking of toxic chemicals releasing facilities) Business SIC classification: RECONSTITUTED WOOD PRODUCTS; WOOD HOUSEHOLD FURNITURE, EXCEPT UPHOLSTERED; HEATING EQUIPMENT, EXCEPT ELECTRIC AND WARM AIR FURNACES Business NAICS classification: HEATING EQUIPMENT (EXCEPT WARM AIR FURNACES) MANUFACTURING.; NONUPHOLSTERED WOOD HOUSEHOLD FURNITURE MANUFACTURING. Alternative names: TRIWOOD INC
ALLIANCE, A ROCK-TENN COMPANY (500 FRITH DRIVE in RIDGEWAY, VA)
Small Quantity Generators, between 100 kg and 1000 kg of hazardous waste/month (Resource Conservation and Recovery Act (tracking hazardous waste)) Organizations: EDWARD DIMMETTE (CONTACT/OPERATOR)
, ROCKTENN CONVERTING CO. (CONTACT/OWNER)
AMFIBE INCORPORATED (420 INDUSTRIAL PARK DRIVE in RIDGEWAY, VA)
AIR SYNTHETIC MINOR (AIRS/AFS) Business SIC classification: YARN SPINNING MILLS
Housing units lacking complete plumbing facilities: 10.5% Housing units lacking complete kitchen facilities: 4.3%
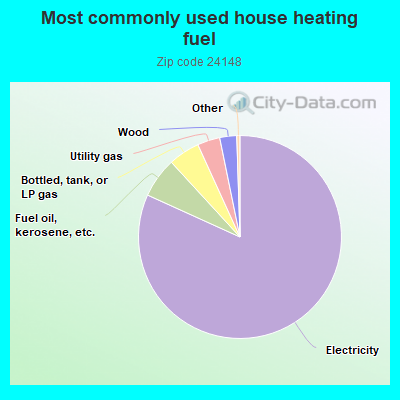
81.7%Electricity
6.4%Fuel oil, kerosene, etc.
5.0%Bottled, tank, or LP gas
3.6%Utility gas
2.7%Wood
Population in 1990: 7,953. Population change in the 1990s: +575 (+7.2%).
Place of birth for U.S.-born residents:
This state: 5,388
Northeast: 267
Midwest: 217
South: 2,502
West: 44
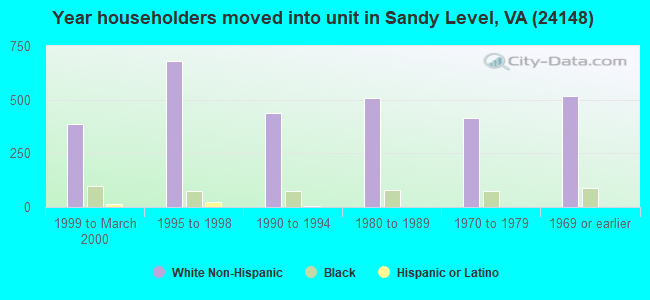
68% of the 24148 zip code residents lived in the same house 5 years ago. Out of people who lived in different houses, 68% lived in this county. Out of people who lived in different counties, 50% lived in Virginia.
92% of the 24148 zip code residents lived in the same house 1 year ago. Out of people who lived in different houses, 63% moved from this county. Out of people who lived in different houses, 19% moved from different county within same state. Out of people who lived in different houses, 16% moved from different state.
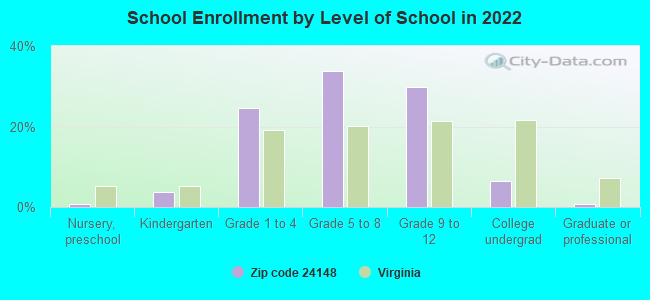
Private vs. public school enrollment:
Students in private schools in grades 1 to 8 (elementary and middle school): 138
Here:
12.6%
Virginia:
13.2%
Students in private schools in grades 9 to 12 (high school): 78
Here:
14.0%
Virginia:
10.2%
Students in private undergraduate colleges: 43
Here:
35.6%
Virginia:
18.7%
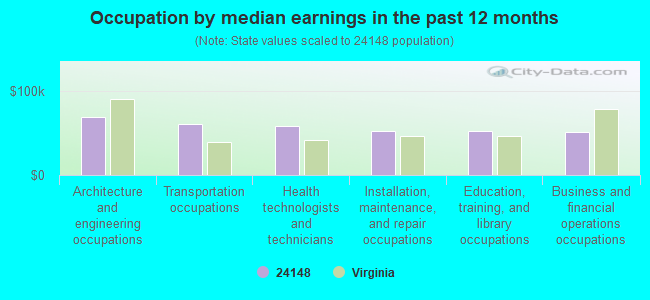
Occupation by median earnings in the past 12 months ($)
68,177Architecture and engineering occupations
60,910Transportation occupations
57,922Health technologists and technicians
52,443Installation, maintenance, and repair occupations
51,742Education, training, and library occupations
50,571Business and financial operations occupations
Top industries in this zip code by the number of employees in 2005:
Accommodation and Food Services: Full-Service Restaurants (50-99: 1, 1-4: 1)
Administrative and Support and Waste Management and Remediation Services: Facilities Support Services (50-99: 1)
People in group quarters in 2010:
115 people in state prisons
38 people in group homes intended for adults
Fatal accident statistics in 2014:
Fatal accident count: 3
Vehicles involved in fatal accidents: 5
Fatal accidents caused by drunken drivers: 1
Fatalities: 4
Persons involved in fatal accidents: 5
Pedestrians involved in fatal accidents: 0
Fatal accident statistics in 2013:
Fatal accident count: 2
Vehicles involved in fatal accidents: 3
Fatal accidents caused by drunken drivers: 1
Fatalities: 2
Persons involved in fatal accidents: 4
Pedestrians involved in fatal accidents: 0
2002 - 2018 National Fire Incident Reporting System (NFIRS) incidents
According to the data from the years 2002 - 2018 the average number of fire incidents per year is 61. The highest number of reported fires - 116 took place in 2006, and the least - 30 in 2012. The data has a decreasing trend.
When looking into fire subcategories, the most incidents belonged to: Outside Fires (45.5%), and Structure Fires (35.4%).
Fire incident types reported to NFIRS in Zip Code 24148
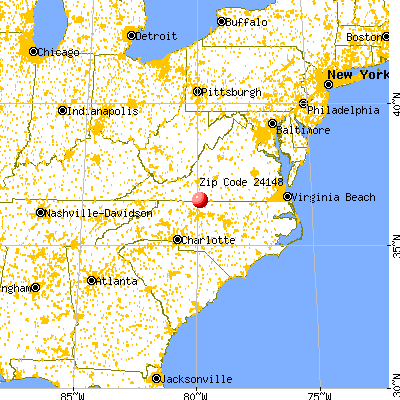


 Nearest zip codes: 27048, 24078, 24112, 27288, 24089, 24168.
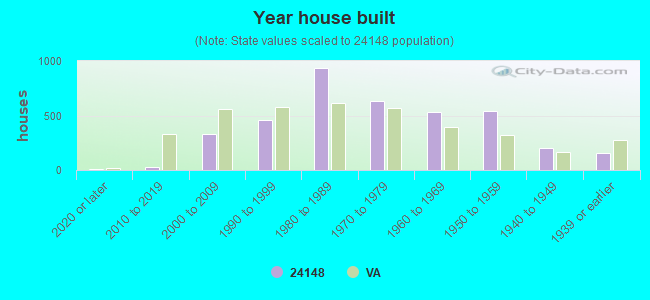


 According to the data from the years 2002 - 2018 the average number of fire incidents per year is 61. The highest number of reported fires - 116 took place in 2006, and the least - 30 in 2012. The data has a decreasing trend.
 When looking into fire subcategories, the most incidents belonged to: Outside Fires (45.5%), and Structure Fires (35.4%).