Estimated zip code population in 2022: 2,486 Zip code population in 2010: 2,656 Zip code population in 2000: 2,603
Houses and condos: 1,017 Renter-occupied apartments: 99
% of renters here:
10%
State:
33%
March 2022 cost of living index in zip code 24431: 82.2 (low, U.S. average is 100)
Land area: 14.2 sq. mi. Water area: 0.1 sq. mi.
Population density: 175 people per square mile
(very low).
OSM Map
General Map
Google Map
MSN Map
OSM Map
General Map
Google Map
MSN Map
OSM Map
General Map
Google Map
MSN Map
OSM Map
General Map
Google Map
MSN Map
Please wait while loading the map...
Real estate property taxes paid for housing units in 2022:
This zip code:
0.5% ($839)
Virginia:
0.7% ($2,617)
Median real estate property taxes paid for housing units with mortgages in 2022: $833 (0.3%) Median real estate property taxes paid for housing units with no mortgage in 2022: $864 (0.5%)
Business Search- 14 Million verified businesses
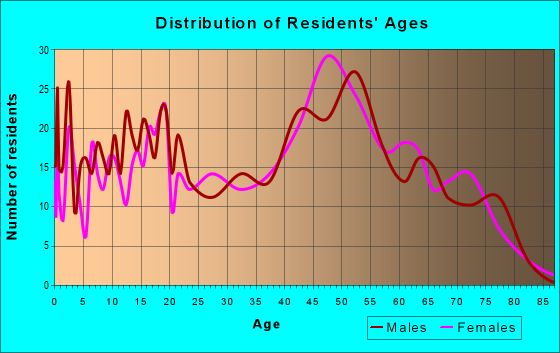
Males: 1,046
(42.1%)
Females: 1,440
(57.9%)
For population 25 years and over in 24431:
High school or higher: 88.9%
Bachelor's degree or higher: 10.3%
Graduate or professional degree: 0.0%
Unemployed: 3.7%
Mean travel time to work (commute): 23.2 minutes
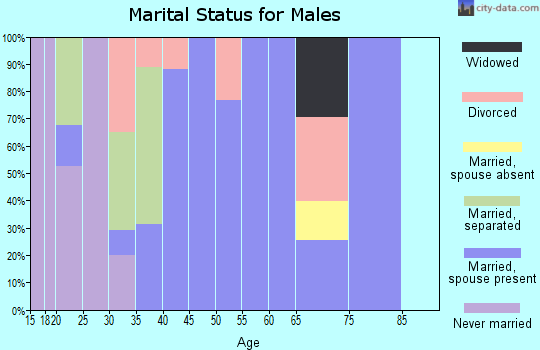
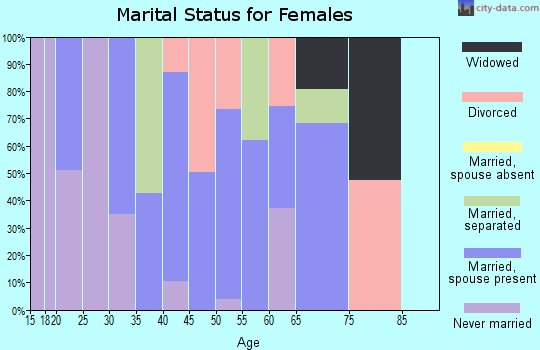
For population 15 years and over in 24431:
Never married: 30.0%
Now married: 47.6%
Separated: 2.6%
Widowed: 8.0%
Divorced: 11.8%
Zip code 24431 compared to state average:
Median house value below state average.
Black race population percentage significantly below state average.
Hispanic race population percentage significantly below state average.
Median age below state average.
Foreign-born population percentage significantly below state average.
Renting percentage significantly below state average.
Length of stay since moving in significantly above state average.
House age below state average.
Number of college students significantly below state average.
Percentage of population with a bachelor's degree or higher significantly below state average.
Averages for the 2020 tax year for zip code 24431, filed in 2021:
Average Adjusted Gross Income (AGI) in 2020: $50,859 (Individual Income Tax Returns)
Here:
$50,859
State:
$86,446
Salary/wage: $44,646 (reported on 87.7% of returns)
Here:
$44,646
State:
$71,185
(% of AGI for various income ranges: 1207.9% for AGIs below $25k, 3593.0% for AGIs $25k-50k, 6973.5% for AGIs $50k-75k, 9221.1% for AGIs $75k-100k, 16420.0% for AGIs $100k-200k)
Taxable interest for individuals: $406 (reported on 24.6% of returns)
This zip code:
$406
Virginia:
$1,805
(% of AGI for various income ranges: 6.2% for AGIs below $25k, 8.8% for AGIs $25k-50k, 22.4% for AGIs $50k-75k, 10.0% for AGIs $75k-100k, 36.7% for AGIs $100k-200k)
Ordinary dividends: $1,315 (reported on 10.0% of returns)
Here:
$1,315
State:
$8,327
(% of AGI for various income ranges: 6.5% for AGIs below $25k, 18.5% for AGIs $25k-50k, 37.6% for AGIs $50k-75k, 26.7% for AGIs $100k-200k)
Net capital gain/loss in AGI: +$1,817 (reported on 9.2% of returns)
Here:
+$1,817
State:
+$24,644
(% of AGI for various income ranges: 8.2% for AGIs $25k-50k, 34.1% for AGIs $50k-75k, 148.9% for AGIs $100k-200k)
Profit/loss from business: +$9,693 (reported on 10.8% of returns)
Here:
+$9,693
State:
+$12,836
(% of AGI for various income ranges: 62.9% for AGIs below $25k, 100.0% for AGIs $25k-50k, 124.1% for AGIs $50k-75k, 668.9% for AGIs $100k-200k)
Taxable individual retirement arrangement distribution: $19,200 (reported on 7.7% of returns)
24431:
$19,200
Virginia:
$21,535
(% of AGI for various income ranges: 155.3% for AGIs below $25k, 425.3% for AGIs $50k-75k, 743.3% for AGIs $100k-200k)
Total itemized deductions: $21,400 (reported on 3.1% of returns)
Here:
$21,400
State:
$33,287
(% of AGI for various income ranges: 951.1% for AGIs $75k-100k)
Charity contributions: $8,300 (reported on 1.5% of returns)
Here:
$8,300
State:
$10,381
(% of AGI for various income ranges: 50.3% for AGIs $25k-50k)
Taxes paid: $5,525 (reported on 3.1% of returns)
24431:
$5,525
State:
$8,284
(% of AGI for various income ranges: 245.6% for AGIs $75k-100k)
Earned income credit: $2,088 (reported on 20.0% of returns)
Here:
$2,088
State:
$2,214
(% of AGI for various income ranges: 96.2% for AGIs below $25k, 65.5% for AGIs $25k-50k)
Percentage of individuals using paid preparers for their 2020 taxes: 94.6%
Here:
95%
State:
92%
(% for various income ranges: 95.2% for AGIs below $25k, 94.9% for AGIs $25k-50k, 91.3% for AGIs $50k-75k, 100.0% for AGIs $75k-100k, 93.3% for AGIs $100k-200k)
Averages for the 2012 tax year for zip code 24431, filed in 2013:
Average Adjusted Gross Income (AGI) in 2012: $38,838 (Individual Income Tax Returns)
Here:
$38,838
State:
$71,192
Salary/wage: $35,567 (reported on 88.9% of returns)
Here:
$35,567
State:
$59,229
(% of AGI for various income ranges: 79.9% for AGIs below $25k, 88.5% for AGIs $25k-50k, 81.2% for AGIs $50k-75k, 83.5% for AGIs $75k-100k, 71.5% for AGIs $100k-200k)
Taxable interest for individuals: $518 (reported on 30.2% of returns)
This zip code:
$518
Virginia:
$1,600
(% of AGI for various income ranges: 0.6% for AGIs below $25k, 0.3% for AGIs $25k-50k, 0.6% for AGIs $50k-75k, 0.3% for AGIs $75k-100k, 0.2% for AGIs $100k-200k)
Ordinary dividends: $1,383 (reported on 9.5% of returns)
Here:
$1,383
State:
$6,959
(% of AGI for various income ranges: 0.6% for AGIs below $25k, 0.5% for AGIs $25k-50k, 0.4% for AGIs $50k-75k, 0.2% for AGIs $100k-200k)
Net capital gain/loss in AGI: +$829 (reported on 5.6% of returns)
Here:
+$829
State:
+$16,672
Profit/loss from business: +$6,493 (reported on 11.1% of returns)
Here:
+$6,493
State:
+$14,116
(% of AGI for various income ranges: 5.5% for AGIs below $25k, 1.5% for AGIs $25k-50k, 2.4% for AGIs $50k-75k, 0.5% for AGIs $75k-100k)
Taxable individual retirement arrangement distribution: $11,773 (reported on 8.7% of returns)
24431:
$11,773
Virginia:
$16,667
(% of AGI for various income ranges: 2.7% for AGIs below $25k, 1.8% for AGIs $25k-50k, 3.0% for AGIs $50k-75k, 7.2% for AGIs $75k-100k)
Total itemized deductions: $17,167 (23% of AGI, reported on 19.0% of returns)
Here:
$17,167
State:
$26,596
Here:
23.2% of AGI
State:
20.1% of AGI
(% of AGI for various income ranges: 3.5% for AGIs below $25k, 6.8% for AGIs $25k-50k, 8.9% for AGIs $50k-75k, 11.5% for AGIs $75k-100k, 11.3% for AGIs $100k-200k)
Charity contributions: $3,300 (reported on 12.7% of returns)
Here:
$3,300
State:
$4,443
(% of AGI for various income ranges: 0.5% for AGIs $25k-50k, 1.4% for AGIs $50k-75k, 1.6% for AGIs $75k-100k, 1.8% for AGIs $100k-200k)
Taxes paid: $4,996 (reported on 19.0% of returns)
24431:
$4,996
State:
$9,951
(% of AGI for various income ranges: 2.0% for AGIs $25k-50k, 2.1% for AGIs $50k-75k, 3.5% for AGIs $75k-100k, 4.5% for AGIs $100k-200k)
Earned income credit: $2,025 (reported on 22.2% of returns)
Here:
$2,025
State:
$2,211
(% of AGI for various income ranges: 5.8% for AGIs below $25k, 1.2% for AGIs $25k-50k)
Percentage of individuals using paid preparers for their 2012 taxes: 45.2%
Here:
45%
State:
46%
(% for various income ranges: 41.8% for AGIs below $25k, 45.9% for AGIs $25k-50k, 42.1% for AGIs $50k-75k, 62.5% for AGIs $75k-100k, 57.1% for AGIs $100k-200k)
Averages for the 2004 tax year for zip code 24431, filed in 2005:
Average Adjusted Gross Income (AGI) in 2004: $33,968 (Individual Income Tax Returns)
Here:
$33,968
State:
$56,704
Salary/wage: $31,279 (reported on 89.6% of returns)
Here:
$31,279
State:
$48,441
(% of AGI for various income ranges: 84.1% for AGIs below $10k, 80.0% for AGIs $10k-25k, 88.7% for AGIs $25k-50k, 85.3% for AGIs $50k-75k, 82.5% for AGIs $75k-100k, 52.2% for AGIs over 100k)
Taxable interest for individuals: $642 (reported on 38.1% of returns)
This zip code:
$642
Virginia:
$1,688
(% of AGI for various income ranges: 1.4% for AGIs below $10k, 1.0% for AGIs $10k-25k, 0.8% for AGIs $25k-50k, 0.4% for AGIs $50k-75k, 0.8% for AGIs $75k-100k, 0.4% for AGIs over 100k)
Taxable dividends: $1,211 (reported on 10.8% of returns)
Here:
$1,211
State:
$4,028
(% of AGI for various income ranges: 1.3% for AGIs below $10k, 0.2% for AGIs $10k-25k, 0.6% for AGIs $25k-50k, 0.2% for AGIs $50k-75k, 0.4% for AGIs $75k-100k, 0.3% for AGIs over 100k)
Net capital gain/loss: +$1,043 (reported on 7.6% of returns)
Here:
+$1,043
State:
+$14,375
(% of AGI for various income ranges: 0.1% for AGIs $10k-25k, -0.0% for AGIs $25k-50k, 0.2% for AGIs $50k-75k, 1.2% for AGIs $75k-100k)
Profit/loss from business: +$6,378 (reported on 12.0% of returns)
Here:
+$6,378
State:
+$13,342
(% of AGI for various income ranges: 9.5% for AGIs below $10k, 3.9% for AGIs $10k-25k, 2.4% for AGIs $25k-50k, 2.4% for AGIs $50k-75k)
IRA payment deduction: $2,000 (reported on 1.2% of returns)
24431:
$2,000
Virginia:
$2,943
Total itemized deductions: $13,629 (23% of AGI, reported on 21.1% of returns)
Here:
$13,629
State:
$21,492
Here:
22.8% of AGI
State:
21.0% of AGI
(% of AGI for various income ranges: 5.6% for AGIs $10k-25k, 6.5% for AGIs $25k-50k, 9.4% for AGIs $50k-75k, 12.4% for AGIs $75k-100k, 12.7% for AGIs over 100k)
Charity contributions deductions: $2,429 (4% of AGI, reported on 15.9% of returns)
Here:
$2,429
State:
$3,794
Here:
3.9% of AGI
State:
3.5% of AGI
(% of AGI for various income ranges: 0.4% for AGIs $10k-25k, 0.8% for AGIs $25k-50k, 1.2% for AGIs $50k-75k, 2.0% for AGIs $75k-100k, 2.4% for AGIs over 100k)
Total tax: $3,594 (reported on 76.3% of returns)
24431:
$3,594
State:
$9,537
(% of AGI for various income ranges: 2.4% for AGIs below $10k, 4.2% for AGIs $10k-25k, 6.4% for AGIs $25k-50k, 8.4% for AGIs $50k-75k, 10.7% for AGIs $75k-100k, 17.2% for AGIs over 100k)
Earned income credit: $1,638 (reported on 18.2% of returns)
Here:
$1,638
State:
$1,734
Percentage of individuals using paid preparers for their 2004 taxes: 54.4%
Here:
54%
State:
52%
(% for various income ranges: 49.3% for AGIs below $10k, 53.0% for AGIs $10k-25k, 59.0% for AGIs $25k-50k, 56.5% for AGIs $50k-75k, 50.0% for AGIs $75k-100k, 48.0% for AGIs over 100k)
Likely homosexual households (counted as self-reported same-sex unmarried-partner households)
Lesbian couples: 2.9% of all households
Gay men: 0.0% of all households
Household received Food Stamps/SNAP in the past 12 months: 155 Household did not receive Food Stamps/SNAP in the past 12 months: 814
Women who had a birth in the past 12 months: 57 (16 now married, 39 unmarried) Women who did not have a birth in the past 12 months: 502 (171 now married, 333 unmarried)
Housing units in zip code 24431 with a mortgage: 400 Houses without a mortgage: 57
Median monthly owner costs for units with a mortgage: $1,073 Median monthly owner costs for units without a mortgage: $340
Residents with income below the poverty level in 2022:
This zip code:
21.7%
Whole state:
10.6%
Residents with income below 50% of the poverty level in 2022:
This zip code:
3.7%
Whole state:
5.2%
Median number of rooms in houses and condos:
Here:
5.9
State:
7.0
Median number of rooms in apartments:
Here:
3.9
State:
4.3
Notable locations in this zip code not listed on our city pages
Churches in zip code 24431 include: Trinity Church (A), Morning Star Church (B), Mount Bethel Church (C), Pleasant Hill Church (D). Display/hide their locations on the map
Size of family households: 293 2-persons, 229 3-persons, 158 4-persons, 33 5-persons
Size of nonfamily households: 194 1-person, 44 2-persons
106 married couples with children.
305 single-parent households (49 men, 256 women).
98.1% of residents of 24431 zip code speak English at home.
0.7% of residents speak other Indo-European language at home (100% very well).
0.6% of residents speak other language at home (100% very well).
Foreign born population: 10 (0.4%) (100.0% of them are naturalized citizens)
This zip code:
0.4%
Whole state:
12.7%
60%Kuwait
23%German
23%English
13%American
12%Irish
11%European
3%Italian
3%Scotch-Irish
Year of entry for the foreign-born population
02010 or later
02000 to 2009
01990 to 1999
27Before 1990
Facilities with environmental interests located in this zip code:
BLUE RIDGE MHC LLC (10 COLBY AVE in CRIMORA, VA)
National Pollutant Discharge Elimination System NON-MAJOR (Tracking pollutant discharge elimination systems) - permit Business SIC classification: OPERATORS OF RESIDENTIAL MOBILE HOME SITES Alternative names: BLUE RIDGE MOBILE HOME PARK, HOMES BY BLUE RIDGE LTD
Housing units lacking complete plumbing facilities: 2.1% Housing units lacking complete kitchen facilities: 2.1%
63.6%Electricity
23.6%Fuel oil, kerosene, etc.
9.3%Wood
3.6%Bottled, tank, or LP gas
Population in 1990: 2,153. Population change in the 1990s: +450 (+20.9%).
Place of birth for U.S.-born residents:
This state: 2,107
Northeast: 186
South: 114
West: 30
67% of the 24431 zip code residents lived in the same house 5 years ago. Out of people who lived in different houses, 46% lived in this county. Out of people who lived in different counties, 50% lived in Virginia.
89% of the 24431 zip code residents lived in the same house 1 year ago. Out of people who lived in different houses, 66% moved from this county. Out of people who lived in different houses, 10% moved from different county within same state. Out of people who lived in different houses, 19% moved from different state.
Private vs. public school enrollment:
Students in private schools in grades 1 to 8 (elementary and middle school):
Here:
0.0%
Virginia:
13.2%
Students in private schools in grades 9 to 12 (high school): 20
Here:
40.9%
Virginia:
10.2%
Students in private undergraduate colleges:
Here:
0.0%
Virginia:
18.7%
Occupation by median earnings in the past 12 months ($)
63,593Construction and extraction occupations
52,805Installation, maintenance, and repair occupations
52,773Sales and related occupations
52,010Production occupations
45,135Management occupations
30,560Office and administrative support occupations
Top industries in this zip code by the number of employees in 2005:
Administrative and Support and Waste Management and Remediation Services: Solid Waste Collection (10-19: 1)
Health Care and Social Assistance: Offices of Dentists (5-9: 1)
Other Services (except Public Administration): Religious Organizations (1-4: 3)
Real Estate and Rental and Leasing: Lessors of Other Real Estate Property (1-4: 2)
Construction: Painting and Wall Covering Contractors (1-4: 1)
Health Care and Social Assistance: Offices of Chiropractors (1-4: 1)
Fatal accident statistics in 2014:
Fatal accident count: 1
Vehicles involved in fatal accidents: 1
Fatal accidents caused by drunken drivers: 1
Fatalities: 1
Persons involved in fatal accidents: 2
Pedestrians involved in fatal accidents: 0
Fatal accident statistics in 2013:
Fatal accident count: 1
Vehicles involved in fatal accidents: 1
Fatal accidents caused by drunken drivers: 0
Fatalities: 1
Persons involved in fatal accidents: 2
Pedestrians involved in fatal accidents: 0
2002 - 2018 National Fire Incident Reporting System (NFIRS) incidents
According to the data from the years 2002 - 2018 the average number of fire incidents per year is 21. The highest number of fire incidents - 34 took place in 2003, and the least - 10 in 2016. The data has an increasing trend.
When looking into fire subcategories, the most reports belonged to: Structure Fires (67.4%), and Outside Fires (22.9%).
Fire incident types reported to NFIRS in Zip Code 24431


 Nearest zip codes: 24441, 22980, 24437, 22943, 22939, 22932.


 According to the data from the years 2002 - 2018 the average number of fire incidents per year is 21. The highest number of fire incidents - 34 took place in 2003, and the least - 10 in 2016. The data has an increasing trend.
 When looking into fire subcategories, the most reports belonged to: Structure Fires (67.4%), and Outside Fires (22.9%).