Estimated zip code population in 2022: 9,244
Zip code population in 2010: 9,203
Zip code population in 2000: 8,714
Houses and condos: 4,088
Renter-occupied apartments: 761
% of renters here:
22%State:
33%
March 2022 cost of living index in zip code 24531: 83.8
(less than average, U.S. average is 100)
Land area: 197.5
sq. mi.
Water area: 1.2
sq. mi.
Population density: 47 people per square mile (very low).
OSM Map
General Map
Google Map
MSN Map
OSM Map
General Map
Google Map
MSN Map
OSM Map
General Map
Google Map
MSN Map
OSM Map
General Map
Google Map
MSN Map
Please wait while loading the map...
Real estate property taxes paid for housing units in 2022:
This zip code:
0.6% ($845)Virginia:
0.7% ($2,617)
Median real estate property taxes paid for housing units with mortgages in 2022: $775 (0.5%)
Median real estate property taxes paid for housing units with no mortgage in 2022: $932 (0.7%)
Profiles of local businesses
Business Search - 14 Million verified businesses
Males: 5,024 Females: 4,220
For population 25 years and over in 24531:
High school or higher: 79.5%Bachelor's degree or higher: 14.7%Graduate or professional degree: 5.2%Unemployed: 3.9%Mean travel time to work (commute): 24.5 minutes
For population 15 years and over in 24531:
Never married: 31.8%Now married: 41.9%Separated: 5.1%Widowed: 9.3%Divorced: 11.9%
Zip code 24531 compared to state average:
Median household income below state average. Median house value significantly below state average. Hispanic race population percentage significantly below state average. Median age significantly above state average. Foreign-born population percentage significantly below state average. Length of stay since moving in significantly above state average. Number of college students below state average. Percentage of population with a bachelor's degree or higher significantly below state average. 6,485 70.2% White 2,372 25.7% Black 209 2.3% Two or more races 136 1.5% Hispanic or Latino 23 0.2% Some other race 12 0.1% Asian 6 0.06% American Indian
Data:
Median household income ($)
Median household income (% change since 2000)
Household income diversity
Ratio of average income to average house value (%)
Ratio of average income to average rent
Median household income ($) - White
Median household income ($) - Black or African American
Median household income ($) - Asian
Median household income ($) - Hispanic or Latino
Median household income ($) - American Indian and Alaska Native
Median household income ($) - Multirace
Median household income ($) - Other Race
Median household income for houses/condos with a mortgage ($)
Median household income for apartments without a mortgage ($)
Races - White alone (%)
Races - White alone (% change since 2000)
Races - Black alone (%)
Races - Black alone (% change since 2000)
Races - American Indian alone (%)
Races - American Indian alone (% change since 2000)
Races - Asian alone (%)
Races - Asian alone (% change since 2000)
Races - Hispanic (%)
Races - Hispanic (% change since 2000)
Races - Native Hawaiian and Other Pacific Islander alone (%)
Races - Native Hawaiian and Other Pacific Islander alone (% change since 2000)
Races - Two or more races (%)
Races - Two or more races (% change since 2000)
Races - Other race alone (%)
Races - Other race alone (% change since 2000)
Racial diversity
Unemployment (%)
Unemployment (% change since 2000)
Unemployment (%) - White
Unemployment (%) - Black or African American
Unemployment (%) - Asian
Unemployment (%) - Hispanic or Latino
Unemployment (%) - American Indian and Alaska Native
Unemployment (%) - Multirace
Unemployment (%) - Other Race
Population density (people per square mile)
Population - Males (%)
Population - Females (%)
Population - Males (%) - White
Population - Males (%) - Black or African American
Population - Males (%) - Asian
Population - Males (%) - Hispanic or Latino
Population - Males (%) - American Indian and Alaska Native
Population - Males (%) - Multirace
Population - Males (%) - Other Race
Population - Females (%) - White
Population - Females (%) - Black or African American
Population - Females (%) - Asian
Population - Females (%) - Hispanic or Latino
Population - Females (%) - American Indian and Alaska Native
Population - Females (%) - Multirace
Population - Females (%) - Other Race
Coronavirus confirmed cases (Apr 24, 2024)
Deaths caused by coronavirus (Apr 24, 2024)
Coronavirus confirmed cases (per 100k population) (Apr 24, 2024)
Deaths caused by coronavirus (per 100k population) (Apr 24, 2024)
Daily increase in number of cases (Apr 24, 2024)
Weekly increase in number of cases (Apr 24, 2024)
Cases doubled (in days) (Apr 24, 2024)
Hospitalized patients (Apr 18, 2022)
Negative test results (Apr 18, 2022)
Total test results (Apr 18, 2022)
COVID Vaccine doses distributed (per 100k population) (Sep 19, 2023)
COVID Vaccine doses administered (per 100k population) (Sep 19, 2023)
COVID Vaccine doses distributed (Sep 19, 2023)
COVID Vaccine doses administered (Sep 19, 2023)
Likely homosexual households (%)
Likely homosexual households (% change since 2000)
Likely homosexual households - Lesbian couples (%)
Likely homosexual households - Lesbian couples (% change since 2000)
Likely homosexual households - Gay men (%)
Likely homosexual households - Gay men (% change since 2000)
Cost of living index
Median gross rent ($)
Median contract rent ($)
Median monthly housing costs ($)
Median house or condo value ($)
Median house or condo value ($ change since 2000)
Mean house or condo value by units in structure - 1, detached ($)
Mean house or condo value by units in structure - 1, attached ($)
Mean house or condo value by units in structure - 2 ($)
Mean house or condo value by units in structure by units in structure - 3 or 4 ($)
Mean house or condo value by units in structure - 5 or more ($)
Mean house or condo value by units in structure - Boat, RV, van, etc. ($)
Mean house or condo value by units in structure - Mobile home ($)
Median house or condo value ($) - White
Median house or condo value ($) - Black or African American
Median house or condo value ($) - Asian
Median house or condo value ($) - Hispanic or Latino
Median house or condo value ($) - American Indian and Alaska Native
Median house or condo value ($) - Multirace
Median house or condo value ($) - Other Race
Median resident age
Resident age diversity
Median resident age - Males
Median resident age - Females
Median resident age - White
Median resident age - Black or African American
Median resident age - Asian
Median resident age - Hispanic or Latino
Median resident age - American Indian and Alaska Native
Median resident age - Multirace
Median resident age - Other Race
Median resident age - Males - White
Median resident age - Males - Black or African American
Median resident age - Males - Asian
Median resident age - Males - Hispanic or Latino
Median resident age - Males - American Indian and Alaska Native
Median resident age - Males - Multirace
Median resident age - Males - Other Race
Median resident age - Females - White
Median resident age - Females - Black or African American
Median resident age - Females - Asian
Median resident age - Females - Hispanic or Latino
Median resident age - Females - American Indian and Alaska Native
Median resident age - Females - Multirace
Median resident age - Females - Other Race
Commute - mean travel time to work (minutes)
Travel time to work - Less than 5 minutes (%)
Travel time to work - Less than 5 minutes (% change since 2000)
Travel time to work - 5 to 9 minutes (%)
Travel time to work - 5 to 9 minutes (% change since 2000)
Travel time to work - 10 to 19 minutes (%)
Travel time to work - 10 to 19 minutes (% change since 2000)
Travel time to work - 20 to 29 minutes (%)
Travel time to work - 20 to 29 minutes (% change since 2000)
Travel time to work - 30 to 39 minutes (%)
Travel time to work - 30 to 39 minutes (% change since 2000)
Travel time to work - 40 to 59 minutes (%)
Travel time to work - 40 to 59 minutes (% change since 2000)
Travel time to work - 60 to 89 minutes (%)
Travel time to work - 60 to 89 minutes (% change since 2000)
Travel time to work - 90 or more minutes (%)
Travel time to work - 90 or more minutes (% change since 2000)
Marital status - Never married (%)
Marital status - Now married (%)
Marital status - Separated (%)
Marital status - Widowed (%)
Marital status - Divorced (%)
Median family income ($)
Median family income (% change since 2000)
Median non-family income ($)
Median non-family income (% change since 2000)
Median per capita income ($)
Median per capita income (% change since 2000)
Median family income ($) - White
Median family income ($) - Black or African American
Median family income ($) - Asian
Median family income ($) - Hispanic or Latino
Median family income ($) - American Indian and Alaska Native
Median family income ($) - Multirace
Median family income ($) - Other Race
Median year house/condo built
Median year apartment built
Year house built - Built 2005 or later (%)
Year house built - Built 2000 to 2004 (%)
Year house built - Built 1990 to 1999 (%)
Year house built - Built 1980 to 1989 (%)
Year house built - Built 1970 to 1979 (%)
Year house built - Built 1960 to 1969 (%)
Year house built - Built 1950 to 1959 (%)
Year house built - Built 1940 to 1949 (%)
Year house built - Built 1939 or earlier (%)
Average household size
Household density (households per square mile)
Average household size - White
Average household size - Black or African American
Average household size - Asian
Average household size - Hispanic or Latino
Average household size - American Indian and Alaska Native
Average household size - Multirace
Average household size - Other Race
Occupied housing units (%)
Vacant housing units (%)
Owner occupied housing units (%)
Renter occupied housing units (%)
Vacancy status - For rent (%)
Vacancy status - For sale only (%)
Vacancy status - Rented or sold, not occupied (%)
Vacancy status - For seasonal, recreational, or occasional use (%)
Vacancy status - For migrant workers (%)
Vacancy status - Other vacant (%)
Residents with income below the poverty level (%)
Residents with income below 50% of the poverty level (%)
Children below poverty level (%)
Poor families by family type - Married-couple family (%)
Poor families by family type - Male, no wife present (%)
Poor families by family type - Female, no husband present (%)
Poverty status for native-born residents (%)
Poverty status for foreign-born residents (%)
Poverty among high school graduates not in families (%)
Poverty among people who did not graduate high school not in families (%)
Residents with income below the poverty level (%) - White
Residents with income below the poverty level (%) - Black or African American
Residents with income below the poverty level (%) - Asian
Residents with income below the poverty level (%) - Hispanic or Latino
Residents with income below the poverty level (%) - American Indian and Alaska Native
Residents with income below the poverty level (%) - Multirace
Residents with income below the poverty level (%) - Other Race
Air pollution - Air Quality Index (AQI)
Air pollution - CO
Air pollution - NO2
Air pollution - SO2
Air pollution - Ozone
Air pollution - PM10
Air pollution - PM25
Air pollution - Pb
Crime - Murders per 100,000 population
Crime - Rapes per 100,000 population
Crime - Robberies per 100,000 population
Crime - Assaults per 100,000 population
Crime - Burglaries per 100,000 population
Crime - Thefts per 100,000 population
Crime - Auto thefts per 100,000 population
Crime - Arson per 100,000 population
Crime - City-data.com crime index
Crime - Violent crime index
Crime - Property crime index
Crime - Murders per 100,000 population (5 year average)
Crime - Rapes per 100,000 population (5 year average)
Crime - Robberies per 100,000 population (5 year average)
Crime - Assaults per 100,000 population (5 year average)
Crime - Burglaries per 100,000 population (5 year average)
Crime - Thefts per 100,000 population (5 year average)
Crime - Auto thefts per 100,000 population (5 year average)
Crime - Arson per 100,000 population (5 year average)
Crime - City-data.com crime index (5 year average)
Crime - Violent crime index (5 year average)
Crime - Property crime index (5 year average)
1996 Presidential Elections Results (%) - Democratic Party (Clinton)
1996 Presidential Elections Results (%) - Republican Party (Dole)
1996 Presidential Elections Results (%) - Other
2000 Presidential Elections Results (%) - Democratic Party (Gore)
2000 Presidential Elections Results (%) - Republican Party (Bush)
2000 Presidential Elections Results (%) - Other
2004 Presidential Elections Results (%) - Democratic Party (Kerry)
2004 Presidential Elections Results (%) - Republican Party (Bush)
2004 Presidential Elections Results (%) - Other
2008 Presidential Elections Results (%) - Democratic Party (Obama)
2008 Presidential Elections Results (%) - Republican Party (McCain)
2008 Presidential Elections Results (%) - Other
2012 Presidential Elections Results (%) - Democratic Party (Obama)
2012 Presidential Elections Results (%) - Republican Party (Romney)
2012 Presidential Elections Results (%) - Other
2016 Presidential Elections Results (%) - Democratic Party (Clinton)
2016 Presidential Elections Results (%) - Republican Party (Trump)
2016 Presidential Elections Results (%) - Other
2020 Presidential Elections Results (%) - Democratic Party (Biden)
2020 Presidential Elections Results (%) - Republican Party (Trump)
2020 Presidential Elections Results (%) - Other
Ancestries Reported - Arab (%)
Ancestries Reported - Czech (%)
Ancestries Reported - Danish (%)
Ancestries Reported - Dutch (%)
Ancestries Reported - English (%)
Ancestries Reported - French (%)
Ancestries Reported - French Canadian (%)
Ancestries Reported - German (%)
Ancestries Reported - Greek (%)
Ancestries Reported - Hungarian (%)
Ancestries Reported - Irish (%)
Ancestries Reported - Italian (%)
Ancestries Reported - Lithuanian (%)
Ancestries Reported - Norwegian (%)
Ancestries Reported - Polish (%)
Ancestries Reported - Portuguese (%)
Ancestries Reported - Russian (%)
Ancestries Reported - Scotch-Irish (%)
Ancestries Reported - Scottish (%)
Ancestries Reported - Slovak (%)
Ancestries Reported - Subsaharan African (%)
Ancestries Reported - Swedish (%)
Ancestries Reported - Swiss (%)
Ancestries Reported - Ukrainian (%)
Ancestries Reported - United States (%)
Ancestries Reported - Welsh (%)
Ancestries Reported - West Indian (%)
Ancestries Reported - Other (%)
Educational Attainment - No schooling completed (%)
Educational Attainment - Less than high school (%)
Educational Attainment - High school or equivalent (%)
Educational Attainment - Less than 1 year of college (%)
Educational Attainment - 1 or more years of college (%)
Educational Attainment - Associate degree (%)
Educational Attainment - Bachelor's degree (%)
Educational Attainment - Master's degree (%)
Educational Attainment - Professional school degree (%)
Educational Attainment - Doctorate degree (%)
School Enrollment - Nursery, preschool (%)
School Enrollment - Kindergarten (%)
School Enrollment - Grade 1 to 4 (%)
School Enrollment - Grade 5 to 8 (%)
School Enrollment - Grade 9 to 12 (%)
School Enrollment - College undergrad (%)
School Enrollment - Graduate or professional (%)
School Enrollment - Not enrolled in school (%)
School enrollment - Public schools (%)
School enrollment - Private schools (%)
School enrollment - Not enrolled (%)
Median number of rooms in houses and condos
Median number of rooms in apartments
Housing units lacking complete plumbing facilities (%)
Housing units lacking complete kitchen facilities (%)
Density of houses
Urban houses (%)
Rural houses (%)
Households with people 60 years and over (%)
Households with people 65 years and over (%)
Households with people 75 years and over (%)
Households with one or more nonrelatives (%)
Households with no nonrelatives (%)
Population in households (%)
Family households (%)
Nonfamily households (%)
Population in families (%)
Family households with own children (%)
Median number of bedrooms in owner occupied houses
Mean number of bedrooms in owner occupied houses
Median number of bedrooms in renter occupied houses
Mean number of bedrooms in renter occupied houses
Median number of vehichles in owner occupied houses
Mean number of vehichles in owner occupied houses
Median number of vehichles in renter occupied houses
Mean number of vehichles in renter occupied houses
Mortgage status - with mortgage (%)
Mortgage status - with second mortgage (%)
Mortgage status - with home equity loan (%)
Mortgage status - with both second mortgage and home equity loan (%)
Mortgage status - without a mortgage (%)
Average family size
Average family size - White
Average family size - Black or African American
Average family size - Asian
Average family size - Hispanic or Latino
Average family size - American Indian and Alaska Native
Average family size - Multirace
Average family size - Other Race
Geographical mobility - Same house 1 year ago (%)
Geographical mobility - Moved within same county (%)
Geographical mobility - Moved from different county within same state (%)
Geographical mobility - Moved from different state (%)
Geographical mobility - Moved from abroad (%)
Place of birth - Born in state of residence (%)
Place of birth - Born in other state (%)
Place of birth - Native, outside of US (%)
Place of birth - Foreign born (%)
Housing units in structures - 1, detached (%)
Housing units in structures - 1, attached (%)
Housing units in structures - 2 (%)
Housing units in structures - 3 or 4 (%)
Housing units in structures - 5 to 9 (%)
Housing units in structures - 10 to 19 (%)
Housing units in structures - 20 to 49 (%)
Housing units in structures - 50 or more (%)
Housing units in structures - Mobile home (%)
Housing units in structures - Boat, RV, van, etc. (%)
House/condo owner moved in on average (years ago)
Renter moved in on average (years ago)
Year householder moved into unit - Moved in 1999 to March 2000 (%)
Year householder moved into unit - Moved in 1995 to 1998 (%)
Year householder moved into unit - Moved in 1990 to 1994 (%)
Year householder moved into unit - Moved in 1980 to 1989 (%)
Year householder moved into unit - Moved in 1970 to 1979 (%)
Year householder moved into unit - Moved in 1969 or earlier (%)
Means of transportation to work - Drove car alone (%)
Means of transportation to work - Carpooled (%)
Means of transportation to work - Public transportation (%)
Means of transportation to work - Bus or trolley bus (%)
Means of transportation to work - Streetcar or trolley car (%)
Means of transportation to work - Subway or elevated (%)
Means of transportation to work - Railroad (%)
Means of transportation to work - Ferryboat (%)
Means of transportation to work - Taxicab (%)
Means of transportation to work - Motorcycle (%)
Means of transportation to work - Bicycle (%)
Means of transportation to work - Walked (%)
Means of transportation to work - Other means (%)
Working at home (%)
Industry diversity
Most Common Industries - Agriculture, forestry, fishing and hunting, and mining (%)
Most Common Industries - Agriculture, forestry, fishing and hunting (%)
Most Common Industries - Mining, quarrying, and oil and gas extraction (%)
Most Common Industries - Construction (%)
Most Common Industries - Manufacturing (%)
Most Common Industries - Wholesale trade (%)
Most Common Industries - Retail trade (%)
Most Common Industries - Transportation and warehousing, and utilities (%)
Most Common Industries - Transportation and warehousing (%)
Most Common Industries - Utilities (%)
Most Common Industries - Information (%)
Most Common Industries - Finance and insurance, and real estate and rental and leasing (%)
Most Common Industries - Finance and insurance (%)
Most Common Industries - Real estate and rental and leasing (%)
Most Common Industries - Professional, scientific, and management, and administrative and waste management services (%)
Most Common Industries - Professional, scientific, and technical services (%)
Most Common Industries - Management of companies and enterprises (%)
Most Common Industries - Administrative and support and waste management services (%)
Most Common Industries - Educational services, and health care and social assistance (%)
Most Common Industries - Educational services (%)
Most Common Industries - Health care and social assistance (%)
Most Common Industries - Arts, entertainment, and recreation, and accommodation and food services (%)
Most Common Industries - Arts, entertainment, and recreation (%)
Most Common Industries - Accommodation and food services (%)
Most Common Industries - Other services, except public administration (%)
Most Common Industries - Public administration (%)
Occupation diversity
Most Common Occupations - Management, business, science, and arts occupations (%)
Most Common Occupations - Management, business, and financial occupations (%)
Most Common Occupations - Management occupations (%)
Most Common Occupations - Business and financial operations occupations (%)
Most Common Occupations - Computer, engineering, and science occupations (%)
Most Common Occupations - Computer and mathematical occupations (%)
Most Common Occupations - Architecture and engineering occupations (%)
Most Common Occupations - Life, physical, and social science occupations (%)
Most Common Occupations - Education, legal, community service, arts, and media occupations (%)
Most Common Occupations - Community and social service occupations (%)
Most Common Occupations - Legal occupations (%)
Most Common Occupations - Education, training, and library occupations (%)
Most Common Occupations - Arts, design, entertainment, sports, and media occupations (%)
Most Common Occupations - Healthcare practitioners and technical occupations (%)
Most Common Occupations - Health diagnosing and treating practitioners and other technical occupations (%)
Most Common Occupations - Health technologists and technicians (%)
Most Common Occupations - Service occupations (%)
Most Common Occupations - Healthcare support occupations (%)
Most Common Occupations - Protective service occupations (%)
Most Common Occupations - Fire fighting and prevention, and other protective service workers including supervisors (%)
Most Common Occupations - Law enforcement workers including supervisors (%)
Most Common Occupations - Food preparation and serving related occupations (%)
Most Common Occupations - Building and grounds cleaning and maintenance occupations (%)
Most Common Occupations - Personal care and service occupations (%)
Most Common Occupations - Sales and office occupations (%)
Most Common Occupations - Sales and related occupations (%)
Most Common Occupations - Office and administrative support occupations (%)
Most Common Occupations - Natural resources, construction, and maintenance occupations (%)
Most Common Occupations - Farming, fishing, and forestry occupations (%)
Most Common Occupations - Construction and extraction occupations (%)
Most Common Occupations - Installation, maintenance, and repair occupations (%)
Most Common Occupations - Production, transportation, and material moving occupations (%)
Most Common Occupations - Production occupations (%)
Most Common Occupations - Transportation occupations (%)
Most Common Occupations - Material moving occupations (%)
People in Group quarters - Institutionalized population (%)
People in Group quarters - Correctional institutions (%)
People in Group quarters - Federal prisons and detention centers (%)
People in Group quarters - Halfway houses (%)
People in Group quarters - Local jails and other confinement facilities (including police lockups) (%)
People in Group quarters - Military disciplinary barracks (%)
People in Group quarters - State prisons (%)
People in Group quarters - Other types of correctional institutions (%)
People in Group quarters - Nursing homes (%)
People in Group quarters - Hospitals/wards, hospices, and schools for the handicapped (%)
People in Group quarters - Hospitals/wards and hospices for chronically ill (%)
People in Group quarters - Hospices or homes for chronically ill (%)
People in Group quarters - Military hospitals or wards for chronically ill (%)
People in Group quarters - Other hospitals or wards for chronically ill (%)
People in Group quarters - Hospitals or wards for drug/alcohol abuse (%)
People in Group quarters - Mental (Psychiatric) hospitals or wards (%)
People in Group quarters - Schools, hospitals, or wards for the mentally retarded (%)
People in Group quarters - Schools, hospitals, or wards for the physically handicapped (%)
People in Group quarters - Institutions for the deaf (%)
People in Group quarters - Institutions for the blind (%)
People in Group quarters - Orthopedic wards and institutions for the physically handicapped (%)
People in Group quarters - Wards in general hospitals for patients who have no usual home elsewhere (%)
People in Group quarters - Wards in military hospitals for patients who have no usual home elsewhere (%)
People in Group quarters - Juvenile institutions (%)
People in Group quarters - Long-term care (%)
People in Group quarters - Homes for abused, dependent, and neglected children (%)
People in Group quarters - Residential treatment centers for emotionally disturbed children (%)
People in Group quarters - Training schools for juvenile delinquents (%)
People in Group quarters - Short-term care, detention or diagnostic centers for delinquent children (%)
People in Group quarters - Type of juvenile institution unknown (%)
People in Group quarters - Noninstitutionalized population (%)
People in Group quarters - College dormitories (includes college quarters off campus) (%)
People in Group quarters - Military quarters (%)
People in Group quarters - On base (%)
People in Group quarters - Barracks, unaccompanied personnel housing (UPH), (Enlisted/Officer), ;and similar group living quarters for military personnel (%)
People in Group quarters - Transient quarters for temporary residents (%)
People in Group quarters - Military ships (%)
People in Group quarters - Group homes (%)
People in Group quarters - Homes or halfway houses for drug/alcohol abuse (%)
People in Group quarters - Homes for the mentally ill (%)
People in Group quarters - Homes for the mentally retarded (%)
People in Group quarters - Homes for the physically handicapped (%)
People in Group quarters - Other group homes (%)
People in Group quarters - Religious group quarters (%)
People in Group quarters - Dormitories (%)
People in Group quarters - Agriculture workers' dormitories on farms (%)
People in Group quarters - Job Corps and vocational training facilities (%)
People in Group quarters - Other workers' dormitories (%)
People in Group quarters - Crews of maritime vessels (%)
People in Group quarters - Other nonhousehold living situations (%)
People in Group quarters - Other noninstitutional group quarters (%)
Residents speaking English at home (%)
Residents speaking English at home - Born in the United States (%)
Residents speaking English at home - Native, born elsewhere (%)
Residents speaking English at home - Foreign born (%)
Residents speaking Spanish at home (%)
Residents speaking Spanish at home - Born in the United States (%)
Residents speaking Spanish at home - Native, born elsewhere (%)
Residents speaking Spanish at home - Foreign born (%)
Residents speaking other language at home (%)
Residents speaking other language at home - Born in the United States (%)
Residents speaking other language at home - Native, born elsewhere (%)
Residents speaking other language at home - Foreign born (%)
Class of Workers - Employee of private company (%)
Class of Workers - Self-employed in own incorporated business (%)
Class of Workers - Private not-for-profit wage and salary workers (%)
Class of Workers - Local government workers (%)
Class of Workers - State government workers (%)
Class of Workers - Federal government workers (%)
Class of Workers - Self-employed workers in own not incorporated business and Unpaid family workers (%)
House heating fuel used in houses and condos - Utility gas (%)
House heating fuel used in houses and condos - Bottled, tank, or LP gas (%)
House heating fuel used in houses and condos - Electricity (%)
House heating fuel used in houses and condos - Fuel oil, kerosene, etc. (%)
House heating fuel used in houses and condos - Coal or coke (%)
House heating fuel used in houses and condos - Wood (%)
House heating fuel used in houses and condos - Solar energy (%)
House heating fuel used in houses and condos - Other fuel (%)
House heating fuel used in houses and condos - No fuel used (%)
House heating fuel used in apartments - Utility gas (%)
House heating fuel used in apartments - Bottled, tank, or LP gas (%)
House heating fuel used in apartments - Electricity (%)
House heating fuel used in apartments - Fuel oil, kerosene, etc. (%)
House heating fuel used in apartments - Coal or coke (%)
House heating fuel used in apartments - Wood (%)
House heating fuel used in apartments - Solar energy (%)
House heating fuel used in apartments - Other fuel (%)
House heating fuel used in apartments - No fuel used (%)
Armed forces status - In Armed Forces (%)
Armed forces status - Civilian (%)
Armed forces status - Civilian - Veteran (%)
Armed forces status - Civilian - Nonveteran (%)
Fatal accidents locations in years 2005-2021
Fatal accidents locations in 2005
Fatal accidents locations in 2006
Fatal accidents locations in 2007
Fatal accidents locations in 2008
Fatal accidents locations in 2009
Fatal accidents locations in 2010
Fatal accidents locations in 2011
Fatal accidents locations in 2012
Fatal accidents locations in 2013
Fatal accidents locations in 2014
Fatal accidents locations in 2015
Fatal accidents locations in 2016
Fatal accidents locations in 2017
Fatal accidents locations in 2018
Fatal accidents locations in 2019
Fatal accidents locations in 2020
Fatal accidents locations in 2021
Alcohol use - People drinking some alcohol every month (%)
Alcohol use - People not drinking at all (%)
Alcohol use - Average days/month drinking alcohol
Alcohol use - Average drinks/week
Alcohol use - Average days/year people drink much
Audiometry - Average condition of hearing (%)
Audiometry - People that can hear a whisper from across a quiet room (%)
Audiometry - People that can hear normal voice from across a quiet room (%)
Audiometry - Ears ringing, roaring, buzzing (%)
Audiometry - Had a job exposure to loud noise (%)
Audiometry - Had off-work exposure to loud noise (%)
Blood Pressure & Cholesterol - Has high blood pressure (%)
Blood Pressure & Cholesterol - Checking blood pressure at home (%)
Blood Pressure & Cholesterol - Frequently checking blood cholesterol (%)
Blood Pressure & Cholesterol - Has high cholesterol level (%)
Consumer Behavior - Money monthly spent on food at supermarket/grocery store
Consumer Behavior - Money monthly spent on food at other stores
Consumer Behavior - Money monthly spent on eating out
Consumer Behavior - Money monthly spent on carryout/delivered foods
Consumer Behavior - Income spent on food at supermarket/grocery store (%)
Consumer Behavior - Income spent on food at other stores (%)
Consumer Behavior - Income spent on eating out (%)
Consumer Behavior - Income spent on carryout/delivered foods (%)
Current Health Status - General health condition (%)
Current Health Status - Blood donors (%)
Current Health Status - Has blood ever tested for HIV virus (%)
Current Health Status - Left-handed people (%)
Dermatology - People using sunscreen (%)
Diabetes - Diabetics (%)
Diabetes - Had a blood test for high blood sugar (%)
Diabetes - People taking insulin (%)
Diet Behavior & Nutrition - Diet health (%)
Diet Behavior & Nutrition - Milk product consumption (# of products/month)
Diet Behavior & Nutrition - Meals not home prepared (#/week)
Diet Behavior & Nutrition - Meals from fast food or pizza place (#/week)
Diet Behavior & Nutrition - Ready-to-eat foods (#/month)
Diet Behavior & Nutrition - Frozen meals/pizza (#/month)
Drug Use - People that ever used marijuana or hashish (%)
Drug Use - Ever used hard drugs (%)
Drug Use - Ever used any form of cocaine (%)
Drug Use - Ever used heroin (%)
Drug Use - Ever used methamphetamine (%)
Health Insurance - People covered by health insurance (%)
Kidney Conditions-Urology - Avg. # of times urinating at night
Medical Conditions - People with asthma (%)
Medical Conditions - People with anemia (%)
Medical Conditions - People with psoriasis (%)
Medical Conditions - People with overweight (%)
Medical Conditions - Elderly people having difficulties in thinking or remembering (%)
Medical Conditions - People who ever received blood transfusion (%)
Medical Conditions - People having trouble seeing even with glass/contacts (%)
Medical Conditions - People with arthritis (%)
Medical Conditions - People with gout (%)
Medical Conditions - People with congestive heart failure (%)
Medical Conditions - People with coronary heart disease (%)
Medical Conditions - People with angina pectoris (%)
Medical Conditions - People who ever had heart attack (%)
Medical Conditions - People who ever had stroke (%)
Medical Conditions - People with emphysema (%)
Medical Conditions - People with thyroid problem (%)
Medical Conditions - People with chronic bronchitis (%)
Medical Conditions - People with any liver condition (%)
Medical Conditions - People who ever had cancer or malignancy (%)
Mental Health - People who have little interest in doing things (%)
Mental Health - People feeling down, depressed, or hopeless (%)
Mental Health - People who have trouble sleeping or sleeping too much (%)
Mental Health - People feeling tired or having little energy (%)
Mental Health - People with poor appetite or overeating (%)
Mental Health - People feeling bad about themself (%)
Mental Health - People who have trouble concentrating on things (%)
Mental Health - People moving or speaking slowly or too fast (%)
Mental Health - People having thoughts they would be better off dead (%)
Oral Health - Average years since last visit a dentist
Oral Health - People embarrassed because of mouth (%)
Oral Health - People with gum disease (%)
Oral Health - General health of teeth and gums (%)
Oral Health - Average days a week using dental floss/device
Oral Health - Average days a week using mouthwash for dental problem
Oral Health - Average number of teeth
Pesticide Use - Households using pesticides to control insects (%)
Pesticide Use - Households using pesticides to kill weeds (%)
Physical Activity - People doing vigorous-intensity work activities (%)
Physical Activity - People doing moderate-intensity work activities (%)
Physical Activity - People walking or bicycling (%)
Physical Activity - People doing vigorous-intensity recreational activities (%)
Physical Activity - People doing moderate-intensity recreational activities (%)
Physical Activity - Average hours a day doing sedentary activities
Physical Activity - Average hours a day watching TV or videos
Physical Activity - Average hours a day using computer
Physical Functioning - People having limitations keeping them from working (%)
Physical Functioning - People limited in amount of work they can do (%)
Physical Functioning - People that need special equipment to walk (%)
Physical Functioning - People experiencing confusion/memory problems (%)
Physical Functioning - People requiring special healthcare equipment (%)
Prescription Medications - Average number of prescription medicines taking
Preventive Aspirin Use - Adults 40+ taking low-dose aspirin (%)
Reproductive Health - Vaginal deliveries (%)
Reproductive Health - Cesarean deliveries (%)
Reproductive Health - Deliveries resulted in a live birth (%)
Reproductive Health - Pregnancies resulted in a delivery (%)
Reproductive Health - Women breastfeeding newborns (%)
Reproductive Health - Women that had a hysterectomy (%)
Reproductive Health - Women that had both ovaries removed (%)
Reproductive Health - Women that have ever taken birth control pills (%)
Reproductive Health - Women taking birth control pills (%)
Reproductive Health - Women that have ever used Depo-Provera or injectables (%)
Reproductive Health - Women that have ever used female hormones (%)
Sexual Behavior - People 18+ that ever had sex (vaginal, anal, or oral) (%)
Sexual Behavior - Males 18+ that ever had vaginal sex with a woman (%)
Sexual Behavior - Males 18+ that ever performed oral sex on a woman (%)
Sexual Behavior - Males 18+ that ever had anal sex with a woman (%)
Sexual Behavior - Males 18+ that ever had any sex with a man (%)
Sexual Behavior - Females 18+ that ever had vaginal sex with a man (%)
Sexual Behavior - Females 18+ that ever performed oral sex on a man (%)
Sexual Behavior - Females 18+ that ever had anal sex with a man (%)
Sexual Behavior - Females 18+ that ever had any kind of sex with a woman (%)
Sexual Behavior - Average age people first had sex
Sexual Behavior - Average number of female sex partners in lifetime (males 18+)
Sexual Behavior - Average number of female vaginal sex partners in lifetime (males 18+)
Sexual Behavior - Average age people first performed oral sex on a woman (18+)
Sexual Behavior - Average number of woman performed oral sex on in lifetime (18+)
Sexual Behavior - Average number of male sex partners in lifetime (males 18+)
Sexual Behavior - Average number of male anal sex partners in lifetime (males 18+)
Sexual Behavior - Average age people first performed oral sex on a man (18+)
Sexual Behavior - Average number of male oral sex partners in lifetime (18+)
Sexual Behavior - People using protection when performing oral sex (%)
Sexual Behavior - Average number of times people have vaginal or anal sex a year
Sexual Behavior - People having sex without condom (%)
Sexual Behavior - Average number of male sex partners in lifetime (females 18+)
Sexual Behavior - Average number of male vaginal sex partners in lifetime (females 18+)
Sexual Behavior - Average number of female sex partners in lifetime (females 18+)
Sexual Behavior - Circumcised males 18+ (%)
Sleep Disorders - Average hours sleeping at night
Sleep Disorders - People that has trouble sleeping (%)
Smoking-Cigarette Use - People smoking cigarettes (%)
Taste & Smell - People 40+ having problems with smell (%)
Taste & Smell - People 40+ having problems with taste (%)
Taste & Smell - People 40+ that ever had wisdom teeth removed (%)
Taste & Smell - People 40+ that ever had tonsils teeth removed (%)
Taste & Smell - People 40+ that ever had a loss of consciousness because of a head injury (%)
Taste & Smell - People 40+ that ever had a broken nose or other serious injury to face or skull (%)
Taste & Smell - People 40+ that ever had two or more sinus infections (%)
Weight - Average height (inches)
Weight - Average weight (pounds)
Weight - Average BMI
Weight - People that are obese (%)
Weight - People that ever were obese (%)
Weight - People trying to lose weight (%)
100%
rural population.
Estimated median house/condo value in 2022: $147,442
24531:
$147,442Virginia:
$365,700
Median resident age: This zip code:
47.3 yearsVirginia median age:
39.0 years
Average household size: This zip code:
2.4 peopleVirginia:
2.5 people
Averages for the 2020 tax year for zip code 24531, filed in 2021:
Average Adjusted Gross Income (AGI) in 2020: $52,638 (Individual Income Tax Returns) Here:
$52,638State:
$86,446
Salary/wage: $43,153 (reported on 81.3% of returns )Here:
$43,153State:
$71,185
(% of AGI for various income ranges: 1135.1% for AGIs below $25k , 3595.2% for AGIs $25k-50k , 6182.2% for AGIs $50k-75k , 9632.9% for AGIs $75k-100k , 15191.5% for AGIs $100k-200k ) Taxable interest for individuals: $1,274 (reported on 25.4% of returns )This zip code:
$1,274Virginia:
$1,805
(% of AGI for various income ranges: 18.3% for AGIs below $25k , 27.1% for AGIs $25k-50k , 41.0% for AGIs $50k-75k , 51.0% for AGIs $75k-100k , 182.5% for AGIs $100k-200k ) Ordinary dividends: $4,456 (reported on 14.5% of returns )(% of AGI for various income ranges: 19.4% for AGIs below $25k , 26.2% for AGIs $25k-50k , 107.0% for AGIs $50k-75k , 115.7% for AGIs $75k-100k , 349.0% for AGIs $100k-200k ) Net capital gain/loss in AGI: +$12,029 (reported on 12.6% of returns )Here:
+$12,029State:
+$24,644
(% of AGI for various income ranges: 20.1% for AGIs below $25k , 33.5% for AGIs $25k-50k , 84.5% for AGIs $50k-75k , 339.0% for AGIs $75k-100k , 538.0% for AGIs $100k-200k ) Profit/loss from business: +$9,622 (reported on 12.6% of returns )Here:
+$9,622State:
+$12,836
(% of AGI for various income ranges: 90.5% for AGIs below $25k , 74.5% for AGIs $25k-50k , 130.0% for AGIs $50k-75k , 318.1% for AGIs $75k-100k , 837.0% for AGIs $100k-200k ) Taxable individual retirement arrangement distribution: $13,445 (reported on 10.6% of returns )24531:
$13,445Virginia:
$21,535
(% of AGI for various income ranges: 71.8% for AGIs below $25k , 101.5% for AGIs $25k-50k , 220.5% for AGIs $50k-75k , 354.3% for AGIs $75k-100k , 981.0% for AGIs $100k-200k ) Total itemized deductions: $27,964 (reported on 6.1% of returns )Here:
$27,964State:
$33,287
(% of AGI for various income ranges: 191.7% for AGIs $25k-50k , 221.5% for AGIs $50k-75k , 371.9% for AGIs $75k-100k , 873.0% for AGIs $100k-200k ) Charity contributions: $13,594 (reported on 4.7% of returns )Here:
$13,594State:
$10,381
(% of AGI for various income ranges: 55.6% for AGIs $25k-50k , 94.8% for AGIs $50k-75k , 74.8% for AGIs $75k-100k , 379.0% for AGIs $100k-200k ) Taxes paid: $5,114 (reported on 6.1% of returns )(% of AGI for various income ranges: 21.8% for AGIs $25k-50k , 36.8% for AGIs $50k-75k , 76.7% for AGIs $75k-100k , 188.0% for AGIs $100k-200k ) Earned income credit: $2,176 (reported on 20.1% of returns )(% of AGI for various income ranges: 103.3% for AGIs below $25k , 72.1% for AGIs $25k-50k ) Percentage of individuals using paid preparers for their 2020 taxes: 91.9%(% for various income ranges: 89.8% for AGIs below $25k , 93.3% for AGIs $25k-50k , 90.9% for AGIs $50k-75k , 93.5% for AGIs $75k-100k , 97.0% for AGIs $100k-200k , 83.3% for AGIs over 200k )
Averages for the 2012 tax year for zip code 24531, filed in 2013:
Average Adjusted Gross Income (AGI) in 2012: $44,474 (Individual Income Tax Returns) Here:
$44,474State:
$71,192
Salary/wage: $35,446 (reported on 84.4% of returns )Here:
$35,446State:
$59,229
(% of AGI for various income ranges: 76.8% for AGIs below $25k , 79.8% for AGIs $25k-50k , 77.4% for AGIs $50k-75k , 76.3% for AGIs $75k-100k , 66.5% for AGIs $100k-200k , 17.5% for AGIs over 200k ) Taxable interest for individuals: $1,702 (reported on 32.3% of returns )This zip code:
$1,702Virginia:
$1,600
(% of AGI for various income ranges: 1.8% for AGIs below $25k , 0.9% for AGIs $25k-50k , 1.3% for AGIs $50k-75k , 1.2% for AGIs $75k-100k , 1.5% for AGIs $100k-200k , 0.9% for AGIs over 200k ) Ordinary dividends: $3,561 (reported on 15.6% of returns )(% of AGI for various income ranges: 1.4% for AGIs below $25k , 0.5% for AGIs $25k-50k , 0.9% for AGIs $50k-75k , 1.3% for AGIs $75k-100k , 2.4% for AGIs $100k-200k , 1.3% for AGIs over 200k ) Net capital gain/loss in AGI: +$8,265 (reported on 12.0% of returns )Here:
+$8,265State:
+$16,672
(% of AGI for various income ranges: 0.7% for AGIs below $25k , 0.6% for AGIs $25k-50k , 1.4% for AGIs $50k-75k , 1.0% for AGIs $75k-100k , 2.7% for AGIs $100k-200k , 7.8% for AGIs over 200k ) Profit/loss from business: +$10,341 (reported on 12.3% of returns )Here:
+$10,341State:
+$14,116
(% of AGI for various income ranges: 5.3% for AGIs below $25k , 1.2% for AGIs $25k-50k , 1.8% for AGIs $50k-75k , 0.8% for AGIs $75k-100k , 8.5% for AGIs $100k-200k ) Taxable individual retirement arrangement distribution: $11,842 (reported on 10.6% of returns )24531:
$11,842Virginia:
$16,667
(% of AGI for various income ranges: 3.0% for AGIs below $25k , 2.6% for AGIs $25k-50k , 2.6% for AGIs $50k-75k , 3.8% for AGIs $75k-100k , 4.7% for AGIs $100k-200k ) Total itemized deductions: $20,488 (21% of AGI, reported on 20.9% of returns )Here:
$20,488State:
$26,596
Here:
21.1% of AGIState:
20.1% of AGI
(% of AGI for various income ranges: 6.0% for AGIs below $25k , 7.5% for AGIs $25k-50k , 8.5% for AGIs $50k-75k , 10.7% for AGIs $75k-100k , 14.5% for AGIs $100k-200k , 10.8% for AGIs over 200k ) Charity contributions: $5,511 (reported on 18.1% of returns )(% of AGI for various income ranges: 0.9% for AGIs below $25k , 1.8% for AGIs $25k-50k , 2.3% for AGIs $50k-75k , 2.5% for AGIs $75k-100k , 4.4% for AGIs $100k-200k , 1.3% for AGIs over 200k ) Taxes paid: $5,677 (reported on 20.6% of returns )(% of AGI for various income ranges: 0.8% for AGIs below $25k , 1.4% for AGIs $25k-50k , 1.9% for AGIs $50k-75k , 3.0% for AGIs $75k-100k , 4.9% for AGIs $100k-200k , 4.0% for AGIs over 200k ) Earned income credit: $2,071 (reported on 23.4% of returns )(% of AGI for various income ranges: 6.5% for AGIs below $25k , 1.1% for AGIs $25k-50k ) Percentage of individuals using paid preparers for their 2012 taxes: 59.1%(% for various income ranges: 53.2% for AGIs below $25k , 58.0% for AGIs $25k-50k , 65.3% for AGIs $50k-75k , 66.7% for AGIs $75k-100k , 76.2% for AGIs $100k-200k , 100.0% for AGIs over 200k )
Averages for the 2004 tax year for zip code 24531, filed in 2005:
Average Adjusted Gross Income (AGI) in 2004: $35,295 (Individual Income Tax Returns) Here:
$35,295State:
$56,704
Salary/wage: $30,234 (reported on 85.2% of returns )Here:
$30,234State:
$48,441
(% of AGI for various income ranges: 207.3% for AGIs below $10k , 78.0% for AGIs $10k-25k , 83.0% for AGIs $25k-50k , 81.5% for AGIs $50k-75k , 73.3% for AGIs $75k-100k , 38.9% for AGIs over 100k ) Taxable interest for individuals: $1,696 (reported on 40.4% of returns )This zip code:
$1,696Virginia:
$1,688
(% of AGI for various income ranges: 13.3% for AGIs below $10k , 2.4% for AGIs $10k-25k , 1.4% for AGIs $25k-50k , 1.2% for AGIs $50k-75k , 2.4% for AGIs $75k-100k , 2.3% for AGIs over 100k ) Taxable dividends: $4,333 (reported on 17.8% of returns )(% of AGI for various income ranges: 5.1% for AGIs below $10k , 1.0% for AGIs $10k-25k , 0.8% for AGIs $25k-50k , 1.2% for AGIs $50k-75k , 2.0% for AGIs $75k-100k , 5.9% for AGIs over 100k ) Net capital gain/loss: +$5,916 (reported on 14.2% of returns )Here:
+$5,916State:
+$14,375
(% of AGI for various income ranges: 4.9% for AGIs below $10k , 1.2% for AGIs $10k-25k , 1.4% for AGIs $25k-50k , 1.4% for AGIs $50k-75k , 3.1% for AGIs $75k-100k , 5.0% for AGIs over 100k ) Profit/loss from business: +$7,966 (reported on 12.8% of returns )Here:
+$7,966State:
+$13,342
(% of AGI for various income ranges: 3.1% for AGIs below $10k , 2.5% for AGIs $10k-25k , 2.3% for AGIs $25k-50k , 1.8% for AGIs $50k-75k , 1.7% for AGIs $75k-100k , 5.9% for AGIs over 100k ) IRA payment deduction: $2,969 (reported on 2.6% of returns )24531:
$2,969Virginia:
$2,943
(% of AGI for various income ranges: 0.3% for AGIs $10k-25k , 0.3% for AGIs $25k-50k , 0.3% for AGIs $50k-75k , 0.1% for AGIs over 100k ) Total itemized deductions: $16,128 (22% of AGI, reported on 22.4% of returns )Here:
$16,128State:
$21,492
Here:
22.2% of AGIState:
21.0% of AGI
(% of AGI for various income ranges: 19.8% for AGIs below $10k , 7.2% for AGIs $10k-25k , 7.9% for AGIs $25k-50k , 11.5% for AGIs $50k-75k , 13.4% for AGIs $75k-100k , 11.4% for AGIs over 100k ) Charity contributions deductions: $4,782 (6% of AGI, reported on 20.2% of returns )Here:
6.3% of AGIState:
3.5% of AGI
(% of AGI for various income ranges: 1.5% for AGIs below $10k , 1.0% for AGIs $10k-25k , 1.9% for AGIs $25k-50k , 3.1% for AGIs $50k-75k , 3.7% for AGIs $75k-100k , 4.1% for AGIs over 100k ) Total tax: $4,680 (reported on 70.4% of returns )(% of AGI for various income ranges: 7.1% for AGIs below $10k , 3.6% for AGIs $10k-25k , 6.4% for AGIs $25k-50k , 8.1% for AGIs $50k-75k , 10.6% for AGIs $75k-100k , 18.0% for AGIs over 100k ) Earned income credit: $1,770 (reported on 21.4% of returns )Percentage of individuals using paid preparers for their 2004 taxes: 66.1%(% for various income ranges: 59.9% for AGIs below $10k , 66.3% for AGIs $10k-25k , 65.5% for AGIs $25k-50k , 72.0% for AGIs $50k-75k , 67.1% for AGIs $75k-100k , 79.8% for AGIs over 100k )
Estimated median household income in 2022: This zip code:
$48,313Virginia:
$85,873
Nearest zip codes: 24549 ,
24527 ,
24161 ,
24530 ,
24139 ,
24557 .
Percentage of family households: This zip code:
33.9%Virginia:
45.8%
Percentage of households with unmarried partners: This zip code:
3.6%Virginia:
48.6%
No gay or lesbian households reported
Household received Food Stamps/SNAP in the past 12 months: 867Household did not receive Food Stamps/SNAP in the past 12 months: 2,646
Women who had a birth in the past 12 months: 137 (104 now married , 33 unmarried) Women who did not have a birth in the past 12 months: 1,463 (583 now married , 881 unmarried)
Housing units in zip code 24531 with a mortgage: 993 (75
second mortgage , 50
both second mortgage and home equity loan )
Houses without a mortgage: 28
Median monthly owner costs for units with a mortgage: $1,073
Median monthly owner costs for units without a mortgage: $331
Residents with income below the poverty level in 2022:
This zip code:
19.2%Whole state:
10.6%
Residents with income below 50% of the poverty level in 2022:
This zip code:
11.4%Whole state:
5.2%
Median number of rooms in houses and condos: Median number of rooms in apartments: Notable locations in this zip code not listed on our city pages
Click to draw/clear zip code borders Notable locations in zip code 24531: (A) , Walkers Well (B) , Tight Squeeze (C) , Pittsylvania Church Camp (D) , Gretna Rolling Mill (E) , State Prison Camp Number 15 (F) , The Cedars Country Club (G) , Cherrystone Youth Camp (H) , Burnt Chimney (I) , Vanderhyde Dairy (J) , Willis Hall (K) , Pruden Hall (L) , Chatham Town Hall (M) , Pittsylvania County Public Library (N) , Pittsylvania County Jail (O) , Pittsylvania County Courthouse (P) , Climax Volunteer Fire Company (Q) , Chatham Volunteer Fire Department (R) , Callands Volunteer Fire Department and Rescue Squad (S) , Chatham Police Department (T) . Display/hide their locations on the map
Shopping Center: (1) . Display/hide its location on the map
Churches in zip code 24531 include: (A) , Banister Church (B) , Banister Springs Church (C) , Belle Grove Church (D) , Beverly Chapel (E) , Saint Lukes Church (F) , Saint Pauls Church (G) , Salem Church (H) , Callands Church (I) . Display/hide their locations on the map
Cemeteries: (1) , Chatham Burial Park (2) , Hillcrest Memorial Park (3) , Atkinson Cemetery (4) . Display/hide their locations on the map
Reservoirs: (A) , Selfs Lake (B) , Burton Lake (C) . Display/hide their locations on the map
Streams, rivers, and creeks: (A) , White Oak Creek (B) , Wet Sleeve Creek (C) , Turkeycock Creek (D) , Tompkins Branch (E) , Tomahawk Creek (F) , Tanyard Branch (G) , Strawberry Creek (H) , Snow Creek (I) . Display/hide their locations on the map
Park in zip code 24531: (1) . Display/hide its location on the map
Year house built (houses)
0 2020 or later188 2010 to 2019432 2000 to 2009518 1990 to 1999449 1980 to 1989534 1970 to 1979462 1960 to 1969524 1950 to 1959174 1940 to 1949721 1939 or earlier
Zip code 24531 household income distribution in 2022 387 Less than $10,000151 $10,000 to $14,999227 $15,000 to $19,999150 $20,000 to $24,999242 $25,000 to $29,999215 $30,000 to $34,999178 $35,000 to $39,999108 $40,000 to $44,999124 $45,000 to $49,999322 $50,000 to $59,999313 $60,000 to $74,999314 $75,000 to $99,999316 $100,000 to $124,999185 $125,000 to $149,99992 $150,000 to $199,999118 $200,000 or moreEstimate of home value of owner-occupied houses/condos in 2022 in zip code 24531 23 Less than $10,000112 $10,000 to $14,99918 $15,000 to $19,99927 $20,000 to $24,99915 $25,000 to $29,99927 $30,000 to $34,999106 $40,000 to $49,99957 $50,000 to $59,999255 $60,000 to $69,999104 $70,000 to $79,99949 $80,000 to $89,99972 $90,000 to $99,999342 $100,000 to $124,999131 $125,000 to $149,999304 $150,000 to $174,999104 $175,000 to $199,999315 $200,000 to $249,999185 $250,000 to $299,999134 $300,000 to $399,99945 $400,000 to $499,99940 $500,000 to $749,999Rent paid by renters in 2022 in zip code 24531 3 Less than $10014 $150 to $19947 $200 to $24911 $250 to $29920 $300 to $34953 $350 to $399142 $400 to $44952 $450 to $499106 $500 to $54920 $550 to $59994 $600 to $64932 $650 to $69943 $750 to $79916 $800 to $89927 $900 to $99911 $1,000 to $1,249100 No cash rent
Median gross rent in 2022: $777.
Median price asked for vacant for-sale houses and condos in 2022: $101,148.
Estimated median house (or condo) value in 2022 for: White Non-Hispanic householders: $162,207Black or African American householders: $133,509American Indian or Alaska Native householders: $233,952Asian householders: $67,586Hispanic or Latino householders: $176,764Estimated median house or condo value in 2022: $147,442
24531:
$147,442Virginia:
$365,700
Lower value quartile - upper value quartile: $81,988 - $229,835
Mean price in 2022: Detached houses: $324,179Here:
$324,179State:
$472,865
Mobile homes: $114,478Here:
$114,478State:
$100,736
Housing units in structures:
One, detached: 3,274One, attached: 17Two: 443 or 4: 1310 to 19: 1320 to 49: 41Mobile homes: 659Unemployment : 3.9%
Means of transportation to work in zip code 24531 80.0% 2,565 Drove a car alone8.1% 261 Carpooled0.3% 10 Bus or trolley bus0.7% 23 Bicycle3.6% 116 Walked2.3% 75 Other means1.6% 52 Worked at homeTravel time to work (commute) in zip code 24531 235 Less than 5 minutes380 5 to 9 minutes334 10 to 14 minutes344 15 to 19 minutes557 20 to 24 minutes98 25 to 29 minutes360 30 to 34 minutes167 35 to 39 minutes106 40 to 44 minutes168 45 to 59 minutes149 60 to 89 minutes107 90 or more minutes
Percentage of zip code residents living and working in this county: 67.6%
Household type by relationship:
Households: 9,244
Male householders: 1,691 (449 living alone ), Female householders: 1,737 (774 living alone )1,358 spouses (1,337 opposite-sex spouses ), 184 unmarried partners , (172 opposite-sex unmarried partners ), 2,255 children (2,112 natural , 20 adopted , 125 stepchildren ), 137 grandchildren , 154 brothers or sisters , 241 parents , 0 foster children , 212 other relatives , 135 non-relatives In group quarters: 1,152 (-1 institutionalized population )
Size of family households: 1,092 2-persons , 402 3-persons , 334 4-persons , 193 5-persons , 82 6-persons , 25 7-or-more-persons
Size of nonfamily households: 1,224 1-person , 61 2-persons , 10 3-persons
862 married couples with children. single-parent households (85 men , 313 women ).
98.0% of residents of 24531 zip code speak English at home. of residents speak Spanish at home (27% very well, 61% well, 12% not well ).of residents speak other Indo-European language at home (100% very well ).of residents speak Asian or Pacific Island language at home (100% very well ).
Foreign born population: 98 (1.1%)
(24.7%
of them are naturalized citizens )
This zip code:
1.1%Whole state:
12.7%
25% Honduras 21% Costa Rica 17% Democratic Republic of Congo (Zaire) 13% Laos 3% Romania 3% Guyana 2% Sweden 25% American 21% English 6% Irish 3% African 2% German 1% European 1% Italian
Year of entry for the foreign-born population
27 2010 or later 39 2000 to 2009 41 1990 to 1999 31 Before 1990
Facilities with environmental interests located in this zip code:
CHATHAM CLEANERS (37 NORTH MAIN STREET in CHATHAM, VA)
AIR MINOR (AIRS/AFS) STATE MASTER (Virginia pollutants databases) - CEDS-30929, AIR PROGRAM (Resource Conservation and Recovery Act (tracking hazardous waste)) Business SIC classification: DRYCLEANING PLANTS, EXCEPT RUG CLEANINGBusiness NAICS classification: DRYCLEANING AND LAUNDRY SERVICES (EXCEPT COIN-OPERATED).Organizations: OPERNAME (CONTACT/OPERATOR)
CHATHAM KNITTING MILLS (119 S MAIN STREET in CHATHAM, VA)
AIR MINOR (AIRS/AFS) STATE MASTER (Virginia pollutants databases) - CEDS-30198, AIR PROGRAM CRITERIA AND HAZARDOUS AIR POLLUTANT INVENTORY (Inventory of air pollution sources) Business SIC classification: KNIT OUTERWEAR MILLSBusiness NAICS classification: OUTERWEAR KNITTING MILLS.
CENTRAL MIDDLE (245 CENTRAL SCHOOL LN in CHATHAM, VA)
(National Center for Education Statistics) - STATE ID-0711660 Organizations: PITTSYLVANIA COUNTY PUBLIC SCHOOLS (SCHOOL DISTRICT)
CHATHAM DIVERSION CENTER (RT 6 BOX 50 in CHATHAM, VA)
(National Center for Education Statistics) - STATE ID-9000025 Organizations: DEPARTMENT OF CORRECTIONAL EDUCATION (SCHOOL DISTRICT)
CHATHAM ELEM. (100 CHATHAM ELEMENTARY LN in CHATHAM, VA)
(National Center for Education Statistics) - STATE ID-0710640 Organizations: PITTSYLVANIA COUNTY PUBLIC SCHOOLS (SCHOOL DISTRICT)
CHESAPEAKE & POTOMAC TELEPHONE CO (CENTER ST in CHATHAM, VA)
(Resource Conservation and Recovery Act (tracking hazardous waste)) Organizations: OPERNAME (CONTACT/OPERATOR)
, CHESAPEAKE & POTOMAC TELEPHONE COMPANY (CONTACT/OWNER)
A S D AUCTIONS INC (RTE 29 N RT 2 BOX102M in CHATHAM, VA)
(Resource Conservation and Recovery Act (tracking hazardous waste)) Organizations: CARSON AND MYRA LESTER (CONTACT/OWNER)
CHATHAM TOWN - SEWAGE TREATMEN (ST RT 1432 in CHATHAM, VA)
National Pollutant Discharge Elimination System NON-MAJOR (Tracking pollutant discharge elimination systems) - permit Business SIC classification: SEWERAGE SYSTEMSAlternative names: CHATHAM,TOWN OF
CHATHAM MIDDLE SCHOOL (11650 US HWY 29N in CHATHAM, VA)
AIR MINOR (AIRS/AFS) Business SIC classification: ELEMENTARY AND SECONDARY SCHOOLS
Housing units lacking complete plumbing facilities: 3.8%
Housing units lacking complete kitchen facilities: 3.0%
66.8% Electricity 11.2% Bottled, tank, or LP gas 9.8% Fuel oil, kerosene, etc. 6.1% Utility gas 5.9% Wood
Population in 1990: 7,825. Population change in the 1990s: +889 (+11.4%).
Place of birth for U.S.-born residents:
This state: 6,707Northeast: 827Midwest: 217South: 1,209West: 86
67% of the 24531 zip code residents lived in the same house 5 years ago.
Out of people who lived in different houses, 66% lived in this county.
Out of people who lived in different counties, 50% lived in Virginia.
94% of the 24531 zip code residents lived in the same house 1 year ago.
Out of people who lived in different houses, 44% moved from this county.
Out of people who lived in different houses, 32% moved from different county within same state.
Out of people who lived in different houses, 28% moved from different state.
Private vs. public school enrollment:
Students in private schools in grades 1 to 8 (elementary and middle school): 148
Students in private schools in grades 9 to 12 (high school): 94
Students in private undergraduate colleges: 14
Occupation by median earnings in the past 12 months ($)
105,792 Health diagnosing and treating practitioners and other technical occupations 91,464 Arts, design, entertainment, sports, and media occupations 90,806 Computer and mathematical occupations 58,725 Management occupations 50,367 Education, training, and library occupations 44,849 Production occupations
Companies with federal contracts located in this zip code:
MEDAGLIA ENGINEERING CORPORATI (9221 ANDERSON MILL RD in CHATHAM, VA; small business)
$53,643 with Navy for Maintenance, Repair or Alteration of Real Property -- Other Non-Building Facilities. Taking place in MD. Signed on 1999-10-28. Completion date: 2000-09-30.
Top industries in this zip code by the number of employees in 2005:
Educational Services: Elementary and Secondary Schools (100-249 employees: 1 establishment, 50-99 employees: 1 establishment, 20-49 employees: 2 establishments)Administrative and Support and Waste Management and Remediation Services: Temporary Help Services (100-249: 1)Accommodation and Food Services: Limited-Service Restaurants (20-49: 3, 10-19: 1, 5-9: 1)Management of Companies and Enterprises: Corporate, Subsidiary, and Regional Managing Offices (50-99: 1, 20-49: 1)Health Care and Social Assistance: Other Individual and Family Services (50-99: 1, 1-4: 1)Construction: Highway, Street, and Bridge Construction (50-99: 1)Administrative and Support and Waste Management and Remediation Services: Professional Employer Organizations (50-99: 1)
People in group quarters in 2010:
496 people in state prisons
119 people in local jails and other municipal confinement facilities
52 people in nursing facilities/skilled-nursing facilities
48 people in residential treatment centers for adults
2 people in workers' group living quarters and job corps centers
People in group quarters in 2000:
106 people in local jails and other confinement facilities (including police lockups)
79 people in state prisons
58 people in other noninstitutional group quarters
Fatal accident statistics in 2014:
Fatal accident count: 4Vehicles involved in fatal accidents: 7Fatal accidents caused by drunken drivers: 1Fatalities: 4Persons involved in fatal accidents: 10Pedestrians involved in fatal accidents: 0
Fatal accident statistics in 2012:
Fatal accident count: 5Vehicles involved in fatal accidents: 6Fatal accidents caused by drunken drivers: 0Fatalities: 5Persons involved in fatal accidents: 10Pedestrians involved in fatal accidents: 0
Home Mortgage Disclosure Act Aggregated Statistics For Year 2009(Based on 2 full and 12 partial tracts) A) FHA, FSA/RHS & VA B) Conventional C) Refinancings D) Home Improvement Loans E) Loans on Dwellings For 5+ Families F) Non-occupant Loans on G) Loans On Manufactured Number Average Value Number Average Value Number Average Value Number Average Value Number Average Value Number Average Value Number Average Value
LOANS ORIGINATED 42 $101,467 37 $129,317 164 $115,959 40 $34,034 2 $501,550 21 $165,142 32 $80,773 APPLICATIONS APPROVED, NOT ACCEPTED 2 $82,925 4 $45,825 18 $75,053 0 $0 0 $0 3 $68,540 1 $41,070 APPLICATIONS DENIED 11 $95,234 13 $79,478 110 $95,791 18 $69,121 0 $0 2 $132,575 42 $74,983 APPLICATIONS WITHDRAWN 5 $108,436 7 $210,209 67 $105,955 0 $0 0 $0 6 $204,240 2 $84,000 FILES CLOSED FOR INCOMPLETENESS 4 $72,768 2 $85,875 22 $128,585 0 $0 0 $0 1 $102,730 5 $64,778
Aggregated Statistics For Year 2008(Based on 2 full and 12 partial tracts) A) FHA, FSA/RHS & VA B) Conventional C) Refinancings D) Home Improvement Loans F) Non-occupant Loans on G) Loans On Manufactured Number Average Value Number Average Value Number Average Value Number Average Value Number Average Value Number Average Value
LOANS ORIGINATED 54 $100,492 71 $124,245 161 $114,100 43 $50,127 31 $119,973 45 $72,035 APPLICATIONS APPROVED, NOT ACCEPTED 3 $79,737 0 $0 37 $72,595 3 $36,043 6 $44,293 3 $71,703 APPLICATIONS DENIED 14 $93,929 19 $68,245 208 $101,193 28 $52,361 8 $83,826 44 $84,279 APPLICATIONS WITHDRAWN 11 $100,221 5 $85,266 58 $104,547 7 $79,893 2 $77,015 7 $106,421 FILES CLOSED FOR INCOMPLETENESS 2 $106,005 2 $137,595 9 $151,856 0 $0 0 $0 2 $146,475
Aggregated Statistics For Year 2007(Based on 2 full and 12 partial tracts) A) FHA, FSA/RHS & VA B) Conventional C) Refinancings D) Home Improvement Loans F) Non-occupant Loans on G) Loans On Manufactured Number Average Value Number Average Value Number Average Value Number Average Value Number Average Value Number Average Value
LOANS ORIGINATED 35 $97,693 128 $100,438 225 $92,238 56 $71,723 28 $109,945 69 $71,378 APPLICATIONS APPROVED, NOT ACCEPTED 0 $0 13 $66,636 49 $100,015 11 $45,224 5 $55,366 7 $85,414 APPLICATIONS DENIED 11 $113,547 40 $66,518 265 $96,026 50 $40,062 11 $85,677 66 $55,451 APPLICATIONS WITHDRAWN 2 $60,040 11 $128,441 133 $92,102 17 $73,615 5 $153,272 13 $71,092 FILES CLOSED FOR INCOMPLETENESS 1 $93,550 4 $133,708 19 $107,832 2 $22,980 1 $189,310 0 $0
Aggregated Statistics For Year 2006(Based on 2 full and 12 partial tracts) A) FHA, FSA/RHS & VA B) Conventional C) Refinancings D) Home Improvement Loans F) Non-occupant Loans on G) Loans On Manufactured Number Average Value Number Average Value Number Average Value Number Average Value Number Average Value Number Average Value
LOANS ORIGINATED 31 $85,348 133 $95,422 228 $94,122 45 $28,550 46 $109,982 74 $59,966 APPLICATIONS APPROVED, NOT ACCEPTED 2 $56,950 19 $78,223 56 $83,154 7 $40,234 3 $96,587 19 $66,209 APPLICATIONS DENIED 7 $83,909 57 $86,956 255 $80,027 44 $35,217 19 $84,846 79 $59,526 APPLICATIONS WITHDRAWN 4 $73,195 20 $110,769 174 $84,946 10 $37,983 2 $89,725 25 $72,719 FILES CLOSED FOR INCOMPLETENESS 0 $0 7 $147,316 13 $100,242 4 $185,332 0 $0 2 $55,655
Aggregated Statistics For Year 2005(Based on 2 full and 12 partial tracts) A) FHA, FSA/RHS & VA B) Conventional C) Refinancings D) Home Improvement Loans F) Non-occupant Loans on G) Loans On Manufactured Number Average Value Number Average Value Number Average Value Number Average Value Number Average Value Number Average Value
LOANS ORIGINATED 29 $93,586 128 $102,117 272 $83,294 81 $33,458 45 $114,485 65 $61,785 APPLICATIONS APPROVED, NOT ACCEPTED 1 $76,730 23 $52,447 49 $64,633 6 $17,148 3 $44,947 18 $52,892 APPLICATIONS DENIED 12 $70,552 65 $67,395 312 $75,655 61 $28,496 13 $70,845 106 $63,465 APPLICATIONS WITHDRAWN 3 $98,487 20 $105,453 146 $85,049 16 $58,339 4 $147,995 34 $68,640 FILES CLOSED FOR INCOMPLETENESS 2 $70,935 10 $73,910 30 $92,221 2 $19,980 0 $0 0 $0
Aggregated Statistics For Year 2004(Based on 2 full and 12 partial tracts) A) FHA, FSA/RHS & VA B) Conventional C) Refinancings D) Home Improvement Loans E) Loans on Dwellings For 5+ Families F) Non-occupant Loans on G) Loans On Manufactured Number Average Value Number Average Value Number Average Value Number Average Value Number Average Value Number Average Value Number Average Value
LOANS ORIGINATED 24 $95,172 132 $76,567 314 $82,256 53 $26,383 2 $292,735 36 $78,729 80 $56,504 APPLICATIONS APPROVED, NOT ACCEPTED 0 $0 36 $65,318 74 $65,442 13 $24,244 0 $0 2 $65,845 26 $57,037 APPLICATIONS DENIED 10 $68,544 61 $71,198 278 $75,910 33 $16,918 1 $40,750 4 $25,990 83 $60,481 APPLICATIONS WITHDRAWN 1 $50,190 19 $95,962 126 $94,328 11 $25,015 0 $0 2 $191,980 19 $81,185 FILES CLOSED FOR INCOMPLETENESS 0 $0 4 $57,478 13 $59,225 0 $0 0 $0 0 $0 1 $35,410
Aggregated Statistics For Year 2003(Based on 2 full and 12 partial tracts) A) FHA, FSA/RHS & VA B) Conventional C) Refinancings D) Home Improvement Loans F) Non-occupant Loans on Number Average Value Number Average Value Number Average Value Number Average Value Number Average Value
LOANS ORIGINATED 31 $89,932 128 $88,474 488 $82,147 38 $17,941 55 $77,821 APPLICATIONS APPROVED, NOT ACCEPTED 3 $52,600 8 $51,664 70 $68,966 6 $37,160 4 $72,120 APPLICATIONS DENIED 4 $56,158 59 $54,992 202 $74,098 20 $28,909 11 $55,699 APPLICATIONS WITHDRAWN 4 $73,435 19 $68,031 111 $86,644 5 $42,022 3 $50,440 FILES CLOSED FOR INCOMPLETENESS 6 $55,950 5 $82,898 22 $82,192 0 $0 2 $99,910
Aggregated Statistics For Year 2002(Based on 2 full and 12 partial tracts) A) FHA, FSA/RHS & VA B) Conventional C) Refinancings D) Home Improvement Loans E) Loans on Dwellings For 5+ Families F) Non-occupant Loans on Number Average Value Number Average Value Number Average Value Number Average Value Number Average Value Number Average Value
LOANS ORIGINATED 33 $73,348 111 $72,779 324 $79,797 34 $23,295 2 $744,330 32 $58,623 APPLICATIONS APPROVED, NOT ACCEPTED 1 $78,600 49 $47,731 101 $69,635 4 $53,132 0 $0 4 $101,912 APPLICATIONS DENIED 8 $53,574 73 $48,430 259 $66,595 11 $14,724 0 $0 13 $50,043 APPLICATIONS WITHDRAWN 6 $111,403 7 $63,250 105 $75,737 3 $68,893 0 $0 2 $37,660 FILES CLOSED FOR INCOMPLETENESS 2 $99,160 4 $60,508 24 $63,166 0 $0 0 $0 2 $51,955
Aggregated Statistics For Year 2001(Based on 2 full and 12 partial tracts) A) FHA, FSA/RHS & VA B) Conventional C) Refinancings D) Home Improvement Loans F) Non-occupant Loans on Number Average Value Number Average Value Number Average Value Number Average Value Number Average Value
LOANS ORIGINATED 31 $77,297 138 $63,112 335 $73,335 39 $13,325 33 $55,117 APPLICATIONS APPROVED, NOT ACCEPTED 3 $69,380 37 $61,676 70 $59,422 7 $38,699 4 $33,052 APPLICATIONS DENIED 3 $79,067 109 $44,835 266 $61,146 17 $13,594 14 $40,815 APPLICATIONS WITHDRAWN 8 $88,390 26 $59,537 120 $64,177 4 $19,128 0 $0 FILES CLOSED FOR INCOMPLETENESS 0 $0 0 $0 45 $85,271 1 $41,510 0 $0
Aggregated Statistics For Year 2000(Based on 2 full and 12 partial tracts) A) FHA, FSA/RHS & VA B) Conventional C) Refinancings D) Home Improvement Loans E) Loans on Dwellings For 5+ Families F) Non-occupant Loans on Number Average Value Number Average Value Number Average Value Number Average Value Number Average Value Number Average Value
LOANS ORIGINATED 42 $72,188 183 $60,802 182 $64,688 41 $18,591 1 $73,010 29 $44,462 APPLICATIONS APPROVED, NOT ACCEPTED 10 $48,098 57 $54,869 54 $52,212 7 $14,323 0 $0 0 $0 APPLICATIONS DENIED 19 $48,899 179 $51,686 246 $54,514 48 $20,200 0 $0 9 $36,946 APPLICATIONS WITHDRAWN 10 $66,631 32 $56,237 69 $58,002 2 $23,625 0 $0 2 $23,980 FILES CLOSED FOR INCOMPLETENESS 2 $118,895 2 $55,950 12 $48,759 3 $47,680 0 $0 0 $0
Aggregated Statistics For Year 1999(Based on 1 full and 6 partial tracts) A) FHA, FSA/RHS & VA B) Conventional C) Refinancings D) Home Improvement Loans F) Non-occupant Loans on Number Average Value Number Average Value Number Average Value Number Average Value Number Average Value
LOANS ORIGINATED 16 $89,447 131 $57,652 151 $57,709 37 $19,238 14 $52,218 APPLICATIONS APPROVED, NOT ACCEPTED 0 $0 37 $57,083 47 $50,100 4 $29,712 4 $65,482 APPLICATIONS DENIED 1 $114,820 140 $49,900 125 $53,561 28 $16,560 12 $48,068 APPLICATIONS WITHDRAWN 5 $80,886 21 $66,421 44 $59,904 2 $34,735 1 $63,900 FILES CLOSED FOR INCOMPLETENESS 0 $0 2 $71,885 11 $53,502 0 $0 0 $0
Private Mortgage Insurance Companies Aggregated Statistics For Year 2009(Based on 2 full and 10 partial tracts) A) Conventional B) Refinancings Number Average Value Number Average Value
LOANS ORIGINATED 7 $197,550 3 $242,903 APPLICATIONS APPROVED, NOT ACCEPTED 0 $0 3 $146,703 APPLICATIONS DENIED 0 $0 0 $0 APPLICATIONS WITHDRAWN 0 $0 1 $114,620 FILES CLOSED FOR INCOMPLETENESS 0 $0 0 $0
Aggregated Statistics For Year 2008(Based on 2 full and 12 partial tracts) A) Conventional B) Refinancings C) Non-occupant Loans on Number Average Value Number Average Value Number Average Value
LOANS ORIGINATED 13 $146,100 6 $141,477 2 $40,185 APPLICATIONS APPROVED, NOT ACCEPTED 5 $117,536 1 $174,540 0 $0 APPLICATIONS DENIED 0 $0 4 $137,550 0 $0 APPLICATIONS WITHDRAWN 0 $0 0 $0 0 $0 FILES CLOSED FOR INCOMPLETENESS 0 $0 0 $0 0 $0
Aggregated Statistics For Year 2007(Based on 2 full and 10 partial tracts) A) Conventional B) Refinancings C) Non-occupant Loans on D) Loans On Manufactured Number Average Value Number Average Value Number Average Value Number Average Value
LOANS ORIGINATED 25 $91,806 23 $139,064 4 $71,935 2 $76,340 APPLICATIONS APPROVED, NOT ACCEPTED 1 $129,790 9 $121,049 0 $0 0 $0 APPLICATIONS DENIED 0 $0 0 $0 0 $0 0 $0 APPLICATIONS WITHDRAWN 0 $0 0 $0 0 $0 0 $0 FILES CLOSED FOR INCOMPLETENESS 0 $0 0 $0 0 $0 0 $0
Aggregated Statistics For Year 2006(Based on 2 full and 12 partial tracts) A) Conventional B) Refinancings C) Non-occupant Loans on D) Loans On Manufactured Number Average Value Number Average Value Number Average Value Number Average Value
LOANS ORIGINATED 23 $85,733 14 $110,673 8 $59,692 1 $116,650 APPLICATIONS APPROVED, NOT ACCEPTED 3 $120,307 7 $78,883 1 $73,330 0 $0 APPLICATIONS DENIED 0 $0 0 $0 0 $0 0 $0 APPLICATIONS WITHDRAWN 2 $39,965 0 $0 0 $0 0 $0 FILES CLOSED FOR INCOMPLETENESS 0 $0 0 $0 0 $0 0 $0
Aggregated Statistics For Year 2005(Based on 2 full and 12 partial tracts) A) Conventional B) Refinancings C) Non-occupant Loans on D) Loans On Manufactured Number Average Value Number Average Value Number Average Value Number Average Value
LOANS ORIGINATED 27 $82,173 23 $124,869 3 $121,547 3 $61,993 APPLICATIONS APPROVED, NOT ACCEPTED 3 $97,407 8 $92,318 0 $0 0 $0 APPLICATIONS DENIED 0 $0 1 $114,620 0 $0 0 $0 APPLICATIONS WITHDRAWN 0 $0 1 $115,620 0 $0 0 $0 FILES CLOSED FOR INCOMPLETENESS 0 $0 0 $0 0 $0 0 $0
Aggregated Statistics For Year 2004(Based on 2 full and 12 partial tracts) A) Conventional B) Refinancings C) Non-occupant Loans on D) Loans On Manufactured Number Average Value Number Average Value Number Average Value Number Average Value
LOANS ORIGINATED 31 $86,391 27 $117,906 3 $42,607 5 $80,712 APPLICATIONS APPROVED, NOT ACCEPTED 3 $90,877 6 $106,653 0 $0 1 $41,070 APPLICATIONS DENIED 0 $0 0 $0 0 $0 0 $0 APPLICATIONS WITHDRAWN 9 $106,766 3 $77,027 0 $0 0 $0 FILES CLOSED FOR INCOMPLETENESS 0 $0 0 $0 0 $0 0 $0
Aggregated Statistics For Year 2003(Based on 2 full and 12 partial tracts) A) Conventional B) Refinancings C) Non-occupant Loans on Number Average Value Number Average Value Number Average Value
LOANS ORIGINATED 27 $77,384 59 $96,428 4 $34,012 APPLICATIONS APPROVED, NOT ACCEPTED 2 $67,170 6 $71,453 2 $43,770 APPLICATIONS DENIED 1 $73,520 2 $109,960 0 $0 APPLICATIONS WITHDRAWN 1 $117,070 1 $146,370 0 $0 FILES CLOSED FOR INCOMPLETENESS 0 $0 2 $86,920 0 $0
Aggregated Statistics For Year 2002(Based on 2 full and 12 partial tracts) A) Conventional B) Refinancings C) Non-occupant Loans on Number Average Value Number Average Value Number Average Value
LOANS ORIGINATED 24 $72,297 39 $96,541 6 $65,098 APPLICATIONS APPROVED, NOT ACCEPTED 0 $0 14 $93,146 0 $0 APPLICATIONS DENIED 2 $50,955 1 $44,980 2 $50,955 APPLICATIONS WITHDRAWN 2 $47,955 4 $107,032 0 $0 FILES CLOSED FOR INCOMPLETENESS 0 $0 0 $0 0 $0
Aggregated Statistics For Year 2001(Based on 2 full and 10 partial tracts) A) Conventional B) Refinancings C) Non-occupant Loans on Number Average Value Number Average Value Number Average Value
LOANS ORIGINATED 10 $81,965 19 $91,496 1 $42,960 APPLICATIONS APPROVED, NOT ACCEPTED 3 $138,560 9 $105,098 2 $172,605 APPLICATIONS DENIED 0 $0 4 $54,450 0 $0 APPLICATIONS WITHDRAWN 0 $0 1 $45,990 0 $0 FILES CLOSED FOR INCOMPLETENESS 0 $0 0 $0 0 $0
Aggregated Statistics For Year 2000(Based on 2 full and 10 partial tracts) A) Conventional B) Refinancings C) Non-occupant Loans on Number Average Value Number Average Value Number Average Value
LOANS ORIGINATED 22 $91,351 6 $105,997 6 $70,937 APPLICATIONS APPROVED, NOT ACCEPTED 2 $142,870 0 $0 0 $0 APPLICATIONS DENIED 0 $0 3 $95,147 0 $0 APPLICATIONS WITHDRAWN 0 $0 0 $0 0 $0 FILES CLOSED FOR INCOMPLETENESS 0 $0 0 $0 0 $0
Aggregated Statistics For Year 1999(Based on 1 full and 6 partial tracts) A) Conventional B) Refinancings Number Average Value Number Average Value
LOANS ORIGINATED 9 $79,758 9 $77,033 APPLICATIONS APPROVED, NOT ACCEPTED 2 $137,705 2 $117,405 APPLICATIONS DENIED 2 $59,905 0 $0 APPLICATIONS WITHDRAWN 0 $0 0 $0 FILES CLOSED FOR INCOMPLETENESS 0 $0 0 $0
2002 - 2018 National Fire Incident Reporting System (NFIRS) incidents See full 2006 National Fire Incident Reporting System statistics for zip code 24531, Virginia
Most common first names in zip code 24531 among deceased individuals Name Count Lived (average)
James 107 74.9 years William 93 73.4 years John 90 72.7 years Mary 85 78.9 years Robert 58 73.0 years Willie 45 70.7 years George 43 75.6 years Annie 37 79.7 years Charles 32 74.5 years Henry 30 75.0 years
Most common last names in zip code 24531 among deceased individuals Last name Count Lived (average)
Shelton 84 76.8 years Reynolds 81 79.0 years Jones 74 76.1 years Adkins 69 71.9 years Motley 58 77.7 years Clark 45 73.9 years White 44 70.7 years Davis 44 76.0 years Gibson 41 73.8 years Carter 37 74.3 years
Businesses in zip code 24531
Name Count Name Count
Advance Auto Parts 1 Lane Furniture 1 CVS 1 McDonald's 1 FedEx 1 Pizza Hut 1 H&R Block 1 U-Haul 1 Hardee's 1 UPS 2
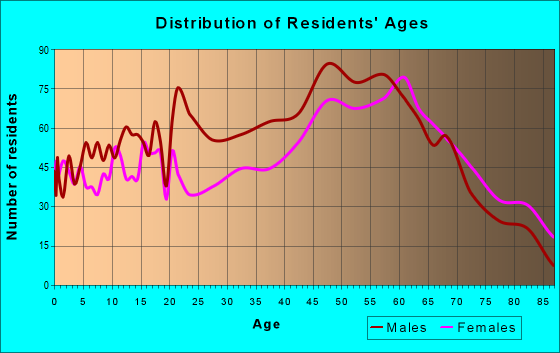
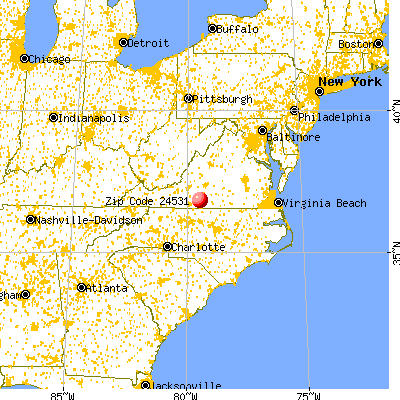


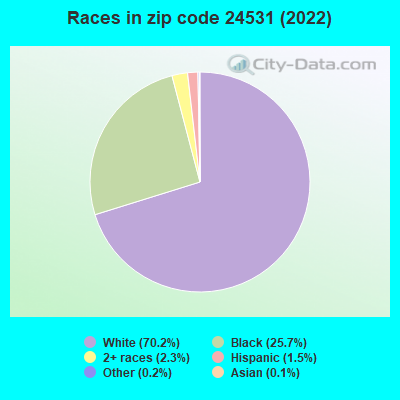


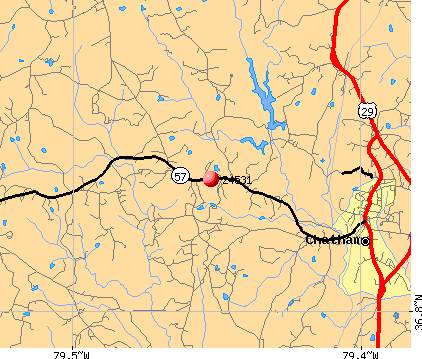 Nearest zip codes: 24549, 24527, 24161, 24530, 24139, 24557.


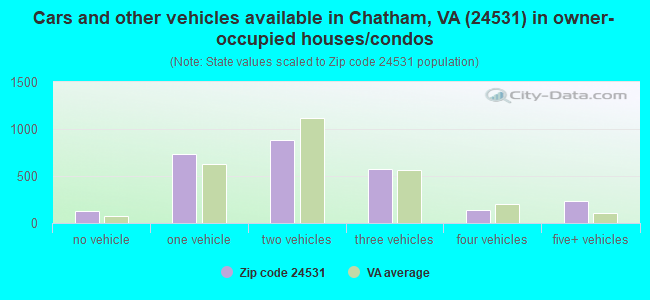
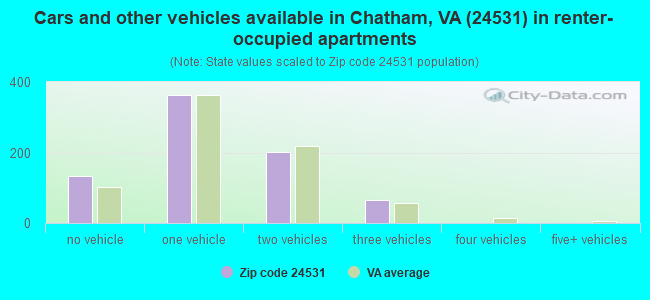


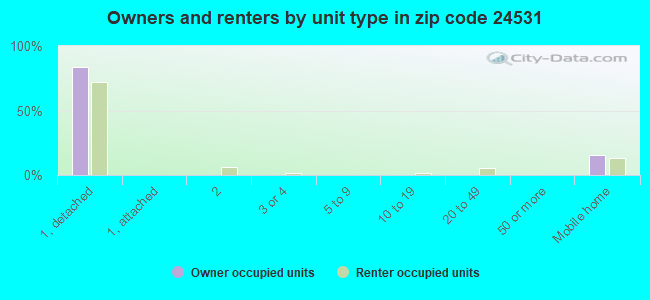
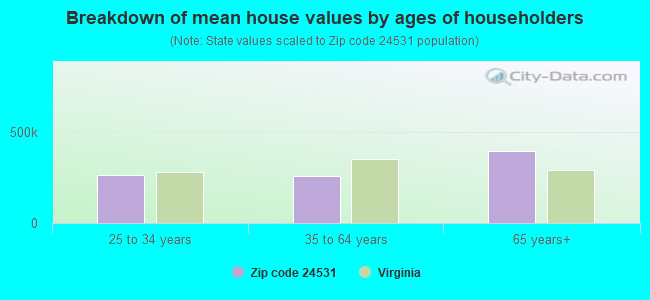


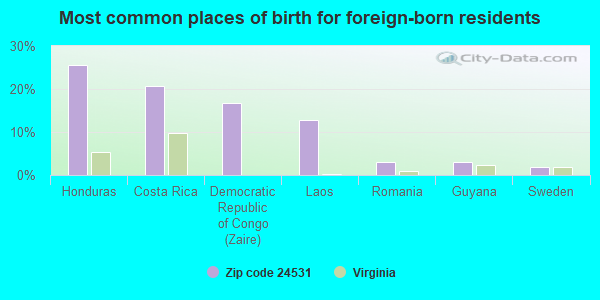
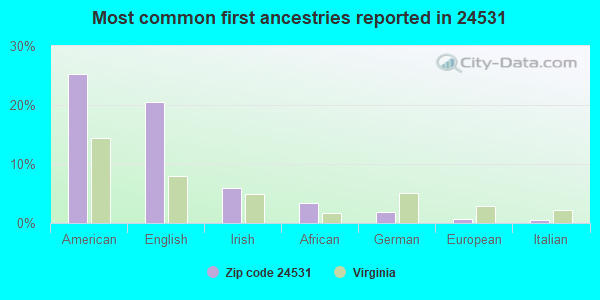
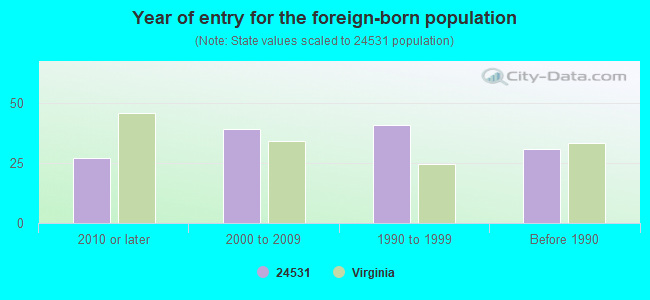


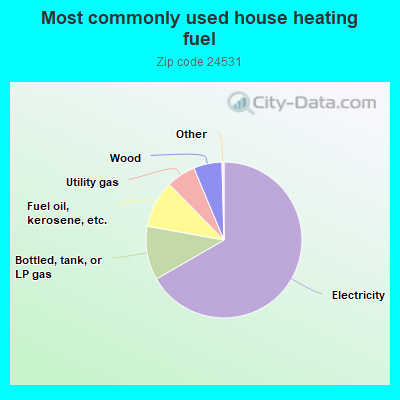
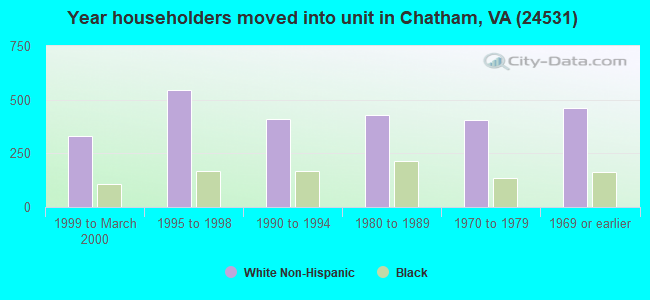
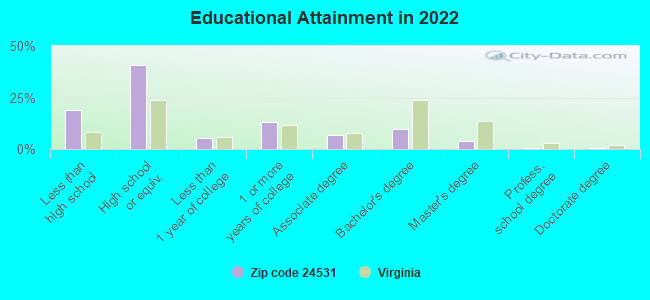
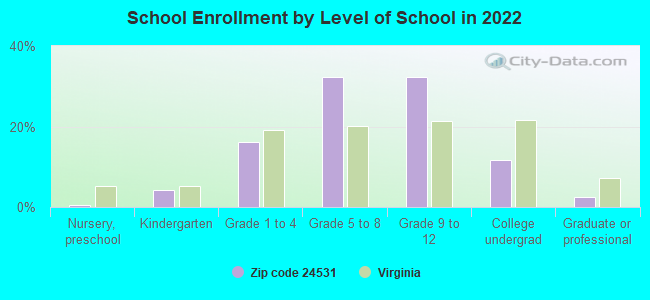

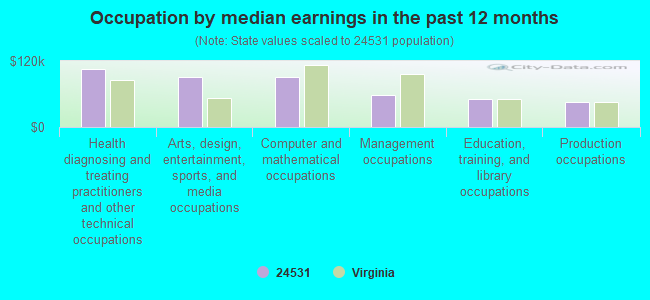
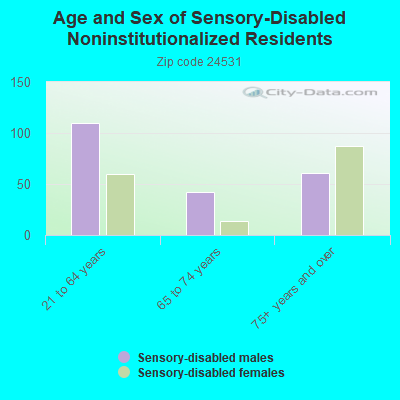
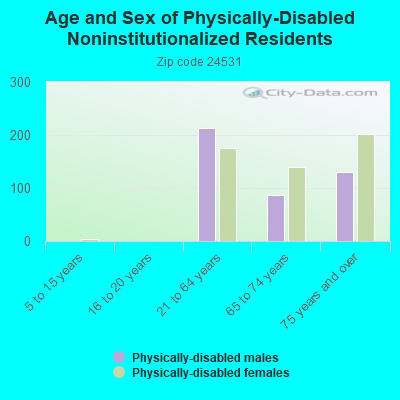
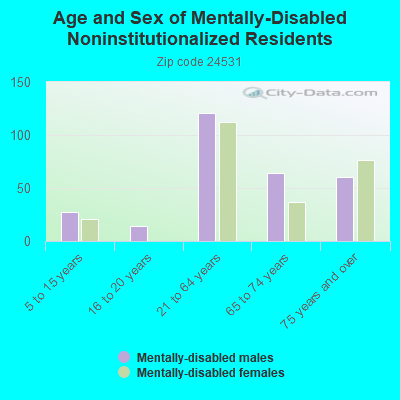
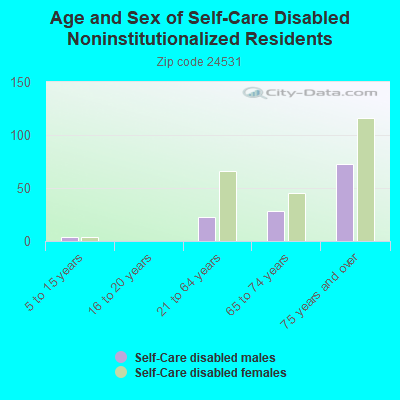


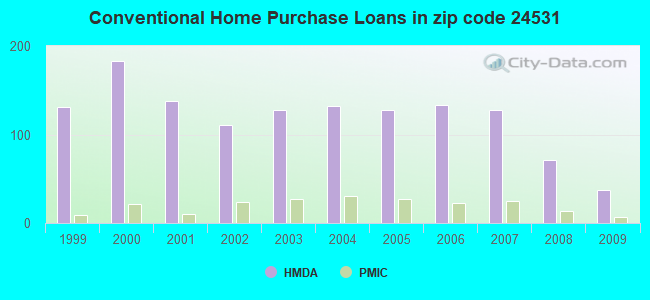
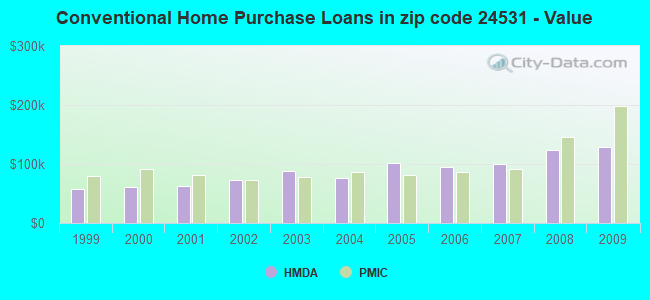
 Based on the data from the years 2002 - 2018 the average number of fire incidents per year is 78. The highest number of fires - 128 took place in 2006, and the least - 48 in 2009. The data has a dropping trend.
 When looking into fire subcategories, the most incidents belonged to: Outside Fires (44.4%), and Structure Fires (38.2%).