Estimated zip code population in 2022: 1,746 Zip code population in 2010: 2,234 Zip code population in 2000: 2,082
Houses and condos: 870 Renter-occupied apartments: 126
% of renters here:
18%
State:
26%
March 2022 cost of living index in zip code 25033: 83.4 (less than average, U.S. average is 100)
Land area: 24.9 sq. mi. Water area: 0.7 sq. mi.
Population density: 70 people per square mile
(very low).
OSM Map
General Map
Google Map
MSN Map
OSM Map
General Map
Google Map
MSN Map
OSM Map
General Map
Google Map
MSN Map
OSM Map
General Map
Google Map
MSN Map
Please wait while loading the map...
Real estate property taxes paid for housing units in 2022:
This zip code:
0.7% ($805)
West Virginia:
0.5% ($821)
Median real estate property taxes paid for housing units with mortgages in 2022: $1,015 (0.5%) Median real estate property taxes paid for housing units with no mortgage in 2022: $655 (0.7%)
Estimated median house/condo value in 2022: $122,335
25033:
$122,335
West Virginia:
$155,100
According to our research of West Virginia and other state lists, there were 5 registered sex offenders living in 25033 zip code as of April 23, 2024. The ratio of all residents to sex offenders in zip code 25033 is 396 to 1. The ratio of registered sex offenders to all residents in this zip code is near the state average.
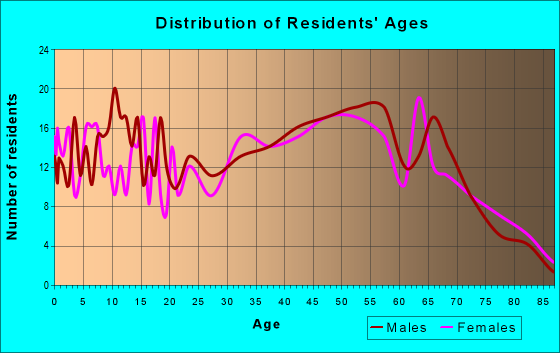
Median resident age:
This zip code:
49.7 years
West Virginia median age:
42.9 years
Average household size:
This zip code:
2.4 people
West Virginia:
2.3 people
Averages for the 2020 tax year for zip code 25033, filed in 2021:
Average Adjusted Gross Income (AGI) in 2020: $52,922 (Individual Income Tax Returns)
Here:
$52,922
State:
$56,292
Salary/wage: $50,163 (reported on 80.4% of returns)
Here:
$50,163
State:
$49,093
(% of AGI for various income ranges: 1186.0% for AGIs below $25k, 3159.6% for AGIs $25k-50k, 6387.3% for AGIs $50k-75k, 9092.9% for AGIs $75k-100k, 19726.2% for AGIs $100k-200k)
Taxable interest for individuals: $532 (reported on 25.8% of returns)
This zip code:
$532
West Virginia:
$1,141
(% of AGI for various income ranges: 5.5% for AGIs below $25k, 10.0% for AGIs $25k-50k, 20.9% for AGIs $50k-75k, 25.7% for AGIs $75k-100k, 71.2% for AGIs $100k-200k)
Ordinary dividends: $1,543 (reported on 7.2% of returns)
Here:
$1,543
State:
$5,456
(% of AGI for various income ranges: 12.9% for AGIs $25k-50k, 96.2% for AGIs $100k-200k)
Net capital gain/loss in AGI: +$583 (reported on 6.2% of returns)
Here:
+$583
State:
+$11,656
(% of AGI for various income ranges: 7.0% for AGIs below $25k, 30.0% for AGIs $75k-100k)
Profit/loss from business: +$8,322 (reported on 9.3% of returns)
Here:
+$8,322
State:
+$12,084
(% of AGI for various income ranges: 82.0% for AGIs below $25k, 123.6% for AGIs $50k-75k, 641.4% for AGIs $75k-100k)
Taxable individual retirement arrangement distribution: $13,700 (reported on 7.2% of returns)
25033:
$13,700
West Virginia:
$15,311
(% of AGI for various income ranges: 63.5% for AGIs below $25k, 116.7% for AGIs $25k-50k, 501.8% for AGIs $50k-75k)
Earned income credit: $2,300 (reported on 14.4% of returns)
Here:
$2,300
State:
$2,258
(% of AGI for various income ranges: 75.5% for AGIs below $25k, 71.2% for AGIs $25k-50k)
Percentage of individuals using paid preparers for their 2020 taxes: 93.8%
Here:
94%
State:
93%
(% for various income ranges: 90.3% for AGIs below $25k, 93.1% for AGIs $25k-50k, 93.3% for AGIs $50k-75k, 100.0% for AGIs $75k-100k, 118.2% for AGIs $100k-200k, 0.0% for AGIs over 200k)
Averages for the 2012 tax year for zip code 25033, filed in 2013:
Average Adjusted Gross Income (AGI) in 2012: $46,187 (Individual Income Tax Returns)
Here:
$46,187
State:
$48,628
Salary/wage: $43,263 (reported on 85.7% of returns)
Here:
$43,263
State:
$42,328
(% of AGI for various income ranges: 72.2% for AGIs below $25k, 81.0% for AGIs $25k-50k, 82.1% for AGIs $50k-75k, 89.6% for AGIs $75k-100k, 76.0% for AGIs $100k-200k)
Taxable interest for individuals: $919 (reported on 28.6% of returns)
This zip code:
$919
West Virginia:
$1,211
(% of AGI for various income ranges: 1.1% for AGIs below $25k, 0.4% for AGIs $25k-50k, 0.4% for AGIs $50k-75k, 0.1% for AGIs $75k-100k, 0.9% for AGIs $100k-200k)
Ordinary dividends: $900 (reported on 8.8% of returns)
Here:
$900
State:
$4,262
(% of AGI for various income ranges: 0.4% for AGIs below $25k, 0.4% for AGIs $100k-200k)
Net capital gain/loss in AGI: +$1,750 (reported on 4.4% of returns)
Here:
+$1,750
State:
+$8,875
Profit/loss from business: +$10,150 (reported on 8.8% of returns)
Here:
+$10,150
State:
+$13,636
(% of AGI for various income ranges: 3.3% for AGIs below $25k, 2.2% for AGIs $25k-50k, 6.3% for AGIs $75k-100k)
Taxable individual retirement arrangement distribution: $9,033 (reported on 6.6% of returns)
25033:
$9,033
West Virginia:
$11,787
Total itemized deductions: $18,100 (18% of AGI, reported on 17.6% of returns)
Here:
$18,100
State:
$21,148
Here:
18.5% of AGI
State:
18.1% of AGI
(% of AGI for various income ranges: 4.9% for AGIs $25k-50k, 6.9% for AGIs $50k-75k, 9.3% for AGIs $75k-100k, 9.3% for AGIs $100k-200k)
Charity contributions: $4,190 (reported on 11.0% of returns)
Here:
$4,190
State:
$4,508
(% of AGI for various income ranges: 1.2% for AGIs $50k-75k, 1.8% for AGIs $75k-100k, 1.4% for AGIs $100k-200k)
Taxes paid: $6,688 (reported on 17.6% of returns)
25033:
$6,688
State:
$8,103
(% of AGI for various income ranges: 1.0% for AGIs $25k-50k, 1.7% for AGIs $50k-75k, 2.8% for AGIs $75k-100k, 4.9% for AGIs $100k-200k)
Earned income credit: $2,231 (reported on 17.6% of returns)
Here:
$2,231
State:
$2,140
(% of AGI for various income ranges: 5.6% for AGIs below $25k, 1.2% for AGIs $25k-50k)
Percentage of individuals using paid preparers for their 2012 taxes: 58.2%
Here:
58%
State:
49%
(% for various income ranges: 55.6% for AGIs below $25k, 56.5% for AGIs $25k-50k, 66.7% for AGIs $50k-75k, 55.6% for AGIs $75k-100k, 62.5% for AGIs $100k-200k)
Averages for the 2004 tax year for zip code 25033, filed in 2005:
Average Adjusted Gross Income (AGI) in 2004: $38,328 (Individual Income Tax Returns)
Here:
$38,328
State:
$37,498
Salary/wage: $36,105 (reported on 89.7% of returns)
Here:
$36,105
State:
$33,645
(% of AGI for various income ranges: 97.2% for AGIs below $10k, 77.3% for AGIs $10k-25k, 84.8% for AGIs $25k-50k, 91.9% for AGIs $50k-75k, 89.5% for AGIs $75k-100k, 74.6% for AGIs over 100k)
Taxable interest for individuals: $851 (reported on 37.3% of returns)
This zip code:
$851
West Virginia:
$1,465
(% of AGI for various income ranges: 3.3% for AGIs below $10k, 1.5% for AGIs $10k-25k, 1.1% for AGIs $25k-50k, 0.2% for AGIs $50k-75k, 0.6% for AGIs $75k-100k, 0.8% for AGIs over 100k)
Taxable dividends: $789 (reported on 10.2% of returns)
Here:
$789
State:
$2,913
(% of AGI for various income ranges: 0.2% for AGIs $10k-25k, 0.0% for AGIs $25k-50k, 0.0% for AGIs $50k-75k, 0.1% for AGIs $75k-100k, 0.8% for AGIs over 100k)
Net capital gain/loss: +$3,000 (reported on 5.6% of returns)
Here:
+$3,000
State:
+$6,331
Profit/loss from business: +$4,723 (reported on 10.7% of returns)
Here:
+$4,723
State:
+$11,074
(% of AGI for various income ranges: 7.9% for AGIs below $10k, 2.9% for AGIs $10k-25k, 1.8% for AGIs $25k-50k, 0.7% for AGIs $50k-75k, 1.2% for AGIs $75k-100k)
Total itemized deductions: $14,513 (17% of AGI, reported on 17.5% of returns)
Here:
$14,513
State:
$16,976
Here:
17.2% of AGI
State:
19.0% of AGI
(% of AGI for various income ranges: 2.3% for AGIs $10k-25k, 5.5% for AGIs $25k-50k, 6.8% for AGIs $50k-75k, 10.7% for AGIs $75k-100k, 8.4% for AGIs over 100k)
Charity contributions deductions: $3,075 (3% of AGI, reported on 12.2% of returns)
Here:
$3,075
State:
$3,529
Here:
3.3% of AGI
State:
3.7% of AGI
(% of AGI for various income ranges: 0.8% for AGIs $25k-50k, 0.8% for AGIs $50k-75k, 1.9% for AGIs $75k-100k, 1.6% for AGIs over 100k)
Total tax: $5,069 (reported on 74.1% of returns)
25033:
$5,069
State:
$5,372
(% of AGI for various income ranges: 1.9% for AGIs below $10k, 3.5% for AGIs $10k-25k, 6.0% for AGIs $25k-50k, 8.5% for AGIs $50k-75k, 10.9% for AGIs $75k-100k, 19.7% for AGIs over 100k)
Earned income credit: $1,594 (reported on 17.6% of returns)
Here:
$1,594
State:
$1,662
Percentage of individuals using paid preparers for their 2004 taxes: 59.9%
Here:
60%
State:
55%
(% for various income ranges: 58.0% for AGIs below $10k, 58.5% for AGIs $10k-25k, 60.6% for AGIs $25k-50k, 56.5% for AGIs $50k-75k, 61.8% for AGIs $75k-100k, 81.0% for AGIs over 100k)
Household received Food Stamps/SNAP in the past 12 months: 67 Household did not receive Food Stamps/SNAP in the past 12 months: 640
Women who had a birth in the past 12 months: 22 (23 now married, 0 unmarried) Women who did not have a birth in the past 12 months: 302 (152 now married, 149 unmarried)
Housing units in zip code 25033 with a mortgage: 256 (11 second mortgage, 11 both second mortgage and home equity loan) Houses without a mortgage: 14
Median monthly owner costs for units with a mortgage: $1,206 Median monthly owner costs for units without a mortgage: $366
Residents with income below the poverty level in 2022:
This zip code:
14.5%
Whole state:
17.9%
Residents with income below 50% of the poverty level in 2022:
This zip code:
3.9%
Whole state:
9.7%
Median number of rooms in houses and condos:
Here:
6.2
State:
6.5
Median number of rooms in apartments:
Here:
5.5
State:
4.7
Notable locations in this zip code not listed on our city pages
Notable locations in zip code 25033: Buffalo Volunteer Fire Department (A), Buffalo Town Hall (B), Buffalo Branch Putnam County Library (C). Display/hide their locations on the map
Churches in zip code 25033 include: Cross Creek Church (A), Dunlap Chapel (B), Otter Branch Church (C), Grandview Church (D), Buffalo Presbyterian Church (E). Display/hide their locations on the map
Cemeteries: Kirkpatrick Cemetery (1), Jackson Cemetery (2), Buffalo Memorial Park (3), Atkeson Cemetery (4), Buffalo Baptist Church Cemetery (5). Display/hide their locations on the map
Streams, rivers, and creeks: Turkey Branch (A), Otter Branch (B), Lukes Branch (C), Jakes Run (D), Isaacs Branch (E), Flat Branch (F), Eighteenmile Creek (G), Dunlap Branch (H), Dales Branch (I). Display/hide their locations on the map
In group quarters: 27 (-1 institutionalized population)
Size of family households: 253 2-persons, 109 3-persons, 49 4-persons, 67 5-persons, 11 6-persons
Size of nonfamily households: 190 1-person, 34 2-persons
199 married couples with children.
51 single-parent households (34 men, 17 women).
99.9% of residents of 25033 zip code speak English at home.
0.1% of residents speak other Indo-European language at home (100% very well).
Foreign born population: 17 (1.0%) (100.0% of them are naturalized citizens)
This zip code:
1.0%
Whole state:
1.8%
93%Malaysia
36%American
18%English
14%Irish
5%German
4%European
4%Scotch-Irish
2%Italian
Year of entry for the foreign-born population
02010 or later
222000 to 2009
01990 to 1999
0Before 1990
Facilities with environmental interests located in this zip code:
DOOLEY, RICK (2606 BUFFALO RD in BUFFALO, WV)
(Integrated Compliance Information System) - ICIS-03-2000-0332, FORMAL ENFORCEMENT ACTION
AMERICAN ELECTRIC POWER (AEP) (1/2 MILE EAST ON WRIGHT LANE in BUFFALO, WV)
HAZARDOUS WASTE BIENNIAL REPORTER (Resource Conservation and Recovery Act (tracking hazardous waste)) (Resource Conservation and Recovery Act (tracking hazardous waste))
Housing units lacking complete plumbing facilities: 2.8% Housing units lacking complete kitchen facilities: 1.3%
58.8%Electricity
26.0%Utility gas
11.0%Bottled, tank, or LP gas
1.7%Wood
1.6%Fuel oil, kerosene, etc.
1.2%Other fuel
Population in 1990: 1,898. Population change in the 1990s: +184 (+9.7%).
Place of birth for U.S.-born residents:
This state: 1,379
Northeast: 21
Midwest: 91
South: 214
West: 14
67% of the 25033 zip code residents lived in the same house 5 years ago. Out of people who lived in different houses, 57% lived in this county. Out of people who lived in different counties, 50% lived in West Virginia.
94% of the 25033 zip code residents lived in the same house 1 year ago. Out of people who lived in different houses, 63% moved from this county. Out of people who lived in different houses, 30% moved from different county within same state. Out of people who lived in different houses, 5% moved from different state.
Private vs. public school enrollment:
Students in private schools in grades 1 to 8 (elementary and middle school):
Here:
0.0%
West Virginia:
12.2%
Students in private schools in grades 9 to 12 (high school):
Here:
0.0%
West Virginia:
8.8%
Students in private undergraduate colleges:
Here:
0.0%
West Virginia:
17.3%
Occupation by median earnings in the past 12 months ($)
101,721Transportation occupations
67,913Management occupations
53,484Installation, maintenance, and repair occupations
36,910Office and administrative support occupations
35,594Sales and related occupations
34,020Education, training, and library occupations
Top industries in this zip code by the number of employees in 2005:
Professional, Scientific, and Technical Services: Offices of Lawyers (10-19 employees: 1 establishment)
Construction: Other Heavy and Civil Engineering Construction (10-19: 1)
Health Care and Social Assistance: Homes for the Elderly (10-19: 1)
Wholesale Trade: Recyclable Material Merchant Wholesalers (10-19: 1)
Accommodation and Food Services: Limited-Service Restaurants (10-19: 1)
Health Care and Social Assistance: Home Health Care Services (10-19: 1)
Construction: Oil and Gas Pipeline and Related Structures Construction (5-9: 1)
Arts, Entertainment, and Recreation: Other Spectator Sports (5-9: 1)
People in group quarters in 2010:
12 people in nursing facilities/skilled-nursing facilities
People in group quarters in 2000:
9 people in other noninstitutional group quarters
Fatal accident statistics in 2014:
Fatal accident count: 1
Vehicles involved in fatal accidents: 1
Fatal accidents caused by drunken drivers: 1
Fatalities: 1
Persons involved in fatal accidents: 1
Pedestrians involved in fatal accidents: 0
Home Mortgage Disclosure Act Aggregated Statistics For Year 2009 (Based on 2 partial tracts)
A) FHA, FSA/RHS & VA Home Purchase Loans
B) Conventional Home Purchase Loans
C) Refinancings
D) Home Improvement Loans
F) Non-occupant Loans on < 5 Family Dwellings (A B C & D)
G) Loans On Manufactured Home Dwelling (A B C & D)
Number
Average Value
Number
Average Value
Number
Average Value
Number
Average Value
Number
Average Value
Number
Average Value
LOANS ORIGINATED
18
$128,519
27
$129,908
111
$122,884
15
$39,947
7
$87,110
15
$42,835
APPLICATIONS APPROVED, NOT ACCEPTED
0
$0
2
$43,330
11
$127,296
2
$15,325
0
$0
2
$43,330
APPLICATIONS DENIED
5
$153,236
12
$32,849
41
$118,594
6
$44,738
5
$35,086
15
$38,467
APPLICATIONS WITHDRAWN
1
$119,420
4
$95,640
22
$111,012
2
$132,100
1
$73,980
5
$48,824
FILES CLOSED FOR INCOMPLETENESS
0
$0
0
$0
1
$95,110
1
$84,540
0
$0
1
$84,540
Aggregated Statistics For Year 2008 (Based on 2 partial tracts)
A) FHA, FSA/RHS & VA Home Purchase Loans
B) Conventional Home Purchase Loans
C) Refinancings
D) Home Improvement Loans
F) Non-occupant Loans on < 5 Family Dwellings (A B C & D)
G) Loans On Manufactured Home Dwelling (A B C & D)
Number
Average Value
Number
Average Value
Number
Average Value
Number
Average Value
Number
Average Value
Number
Average Value
LOANS ORIGINATED
16
$137,186
52
$105,172
71
$111,009
18
$32,996
10
$78,732
24
$55,174
APPLICATIONS APPROVED, NOT ACCEPTED
4
$133,685
7
$78,506
4
$105,945
2
$43,855
0
$0
6
$59,180
APPLICATIONS DENIED
3
$182,473
25
$82,050
35
$87,292
6
$29,767
3
$116,247
30
$62,175
APPLICATIONS WITHDRAWN
0
$0
3
$52,137
6
$105,680
1
$118,360
1
$32,760
1
$4,230
FILES CLOSED FOR INCOMPLETENESS
0
$0
0
$0
2
$115,190
0
$0
0
$0
1
$62,350
Aggregated Statistics For Year 2007 (Based on 2 partial tracts)
A) FHA, FSA/RHS & VA Home Purchase Loans
B) Conventional Home Purchase Loans
C) Refinancings
D) Home Improvement Loans
E) Loans on Dwellings For 5+ Families
F) Non-occupant Loans on < 5 Family Dwellings (A B C & D)
G) Loans On Manufactured Home Dwelling (A B C & D)
Number
Average Value
Number
Average Value
Number
Average Value
Number
Average Value
Number
Average Value
Number
Average Value
Number
Average Value
LOANS ORIGINATED
8
$142,404
77
$117,936
67
$84,512
38
$39,213
1
$216,640
3
$59,180
27
$46,421
APPLICATIONS APPROVED, NOT ACCEPTED
0
$0
12
$96,873
14
$147,801
1
$11,620
0
$0
0
$0
4
$76,618
APPLICATIONS DENIED
2
$159,050
22
$91,605
34
$86,689
12
$30,559
0
$0
2
$68,165
14
$63,559
APPLICATIONS WITHDRAWN
2
$79,260
6
$110,788
18
$112,314
1
$49,670
0
$0
1
$114,130
4
$43,065
FILES CLOSED FOR INCOMPLETENESS
0
$0
1
$240,950
1
$52,840
0
$0
0
$0
0
$0
0
$0
Aggregated Statistics For Year 2006 (Based on 2 partial tracts)
A) FHA, FSA/RHS & VA Home Purchase Loans
B) Conventional Home Purchase Loans
C) Refinancings
D) Home Improvement Loans
E) Loans on Dwellings For 5+ Families
F) Non-occupant Loans on < 5 Family Dwellings (A B C & D)
G) Loans On Manufactured Home Dwelling (A B C & D)
Number
Average Value
Number
Average Value
Number
Average Value
Number
Average Value
Number
Average Value
Number
Average Value
Number
Average Value
LOANS ORIGINATED
5
$106,736
83
$121,405
97
$78,879
24
$26,420
1
$338,180
23
$108,897
32
$49,835
APPLICATIONS APPROVED, NOT ACCEPTED
0
$0
15
$56,715
13
$54,710
3
$15,147
0
$0
5
$50,304
11
$33,914
APPLICATIONS DENIED
1
$32,760
19
$53,786
46
$80,317
15
$18,107
0
$0
2
$34,875
23
$40,388
APPLICATIONS WITHDRAWN
2
$75,035
5
$102,298
18
$76,677
1
$26,420
0
$0
0
$0
6
$62,175
FILES CLOSED FOR INCOMPLETENESS
1
$75,030
2
$72,390
6
$97,578
0
$0
0
$0
1
$65,520
1
$116,250
Aggregated Statistics For Year 2005 (Based on 2 partial tracts)
A) FHA, FSA/RHS & VA Home Purchase Loans
B) Conventional Home Purchase Loans
C) Refinancings
D) Home Improvement Loans
F) Non-occupant Loans on < 5 Family Dwellings (A B C & D)
G) Loans On Manufactured Home Dwelling (A B C & D)
Number
Average Value
Number
Average Value
Number
Average Value
Number
Average Value
Number
Average Value
Number
Average Value
LOANS ORIGINATED
6
$106,032
74
$100,096
85
$81,187
23
$64,740
5
$21,770
41
$39,952
APPLICATIONS APPROVED, NOT ACCEPTED
1
$40,160
12
$79,348
20
$103,144
1
$10,570
0
$0
10
$60,132
APPLICATIONS DENIED
5
$77,780
44
$57,548
44
$86,273
11
$31,127
1
$65,520
36
$45,824
APPLICATIONS WITHDRAWN
1
$109,910
13
$66,904
18
$93,292
1
$31,700
1
$228,270
7
$41,517
FILES CLOSED FOR INCOMPLETENESS
0
$0
1
$145,840
3
$95,817
2
$20,610
0
$0
0
$0
Aggregated Statistics For Year 2004 (Based on 2 partial tracts)
A) FHA, FSA/RHS & VA Home Purchase Loans
B) Conventional Home Purchase Loans
C) Refinancings
D) Home Improvement Loans
E) Loans on Dwellings For 5+ Families
F) Non-occupant Loans on < 5 Family Dwellings (A B C & D)
G) Loans On Manufactured Home Dwelling (A B C & D)
Number
Average Value
Number
Average Value
Number
Average Value
Number
Average Value
Number
Average Value
Number
Average Value
Number
Average Value
LOANS ORIGINATED
2
$89,300
60
$78,397
81
$73,415
32
$17,768
1
$263,140
7
$62,653
38
$34,374
APPLICATIONS APPROVED, NOT ACCEPTED
1
$83,490
4
$44,915
22
$73,015
4
$58,652
0
$0
3
$81,373
5
$24,518
APPLICATIONS DENIED
3
$62,703
42
$54,400
51
$68,547
25
$20,713
0
$0
8
$52,048
35
$43,570
APPLICATIONS WITHDRAWN
2
$69,750
8
$77,146
21
$97,880
3
$26,067
0
$0
0
$0
6
$52,663
FILES CLOSED FOR INCOMPLETENESS
1
$119,420
7
$99,943
8
$85,072
0
$0
0
$0
0
$0
0
$0
Aggregated Statistics For Year 2003 (Based on 2 partial tracts)
A) FHA, FSA/RHS & VA Home Purchase Loans
B) Conventional Home Purchase Loans
C) Refinancings
D) Home Improvement Loans
F) Non-occupant Loans on < 5 Family Dwellings (A B C & D)
Number
Average Value
Number
Average Value
Number
Average Value
Number
Average Value
Number
Average Value
LOANS ORIGINATED
5
$94,056
72
$82,944
155
$85,178
29
$13,082
10
$46,288
APPLICATIONS APPROVED, NOT ACCEPTED
2
$108,320
16
$63,012
20
$56,539
4
$19,288
2
$147,950
APPLICATIONS DENIED
4
$91,678
51
$49,628
74
$67,407
24
$15,852
2
$55,480
APPLICATIONS WITHDRAWN
2
$68,165
8
$61,559
29
$69,785
0
$0
0
$0
FILES CLOSED FOR INCOMPLETENESS
1
$94,060
1
$58,120
6
$78,908
1
$40,160
1
$58,120
Aggregated Statistics For Year 2002 (Based on 2 partial tracts)
A) FHA, FSA/RHS & VA Home Purchase Loans
B) Conventional Home Purchase Loans
C) Refinancings
D) Home Improvement Loans
E) Loans on Dwellings For 5+ Families
F) Non-occupant Loans on < 5 Family Dwellings (A B C & D)
Number
Average Value
Number
Average Value
Number
Average Value
Number
Average Value
Number
Average Value
Number
Average Value
LOANS ORIGINATED
7
$96,320
69
$68,064
133
$74,675
25
$10,568
1
$253,630
13
$66,172
APPLICATIONS APPROVED, NOT ACCEPTED
0
$0
18
$51,901
21
$74,429
6
$32,585
0
$0
0
$0
APPLICATIONS DENIED
0
$0
46
$39,469
68
$66,672
18
$13,445
0
$0
2
$58,650
APPLICATIONS WITHDRAWN
1
$52,840
6
$83,487
12
$97,402
0
$0
0
$0
0
$0
FILES CLOSED FOR INCOMPLETENESS
2
$72,390
1
$375,160
7
$67,031
0
$0
0
$0
0
$0
Aggregated Statistics For Year 2001 (Based on 2 partial tracts)
A) FHA, FSA/RHS & VA Home Purchase Loans
B) Conventional Home Purchase Loans
C) Refinancings
D) Home Improvement Loans
F) Non-occupant Loans on < 5 Family Dwellings (A B C & D)
Number
Average Value
Number
Average Value
Number
Average Value
Number
Average Value
Number
Average Value
LOANS ORIGINATED
11
$69,556
45
$61,976
78
$74,965
18
$10,979
8
$41,348
APPLICATIONS APPROVED, NOT ACCEPTED
1
$58,120
31
$40,943
21
$66,277
0
$0
0
$0
APPLICATIONS DENIED
2
$79,790
69
$32,378
50
$64,423
11
$22,289
2
$99,870
APPLICATIONS WITHDRAWN
0
$0
11
$58,220
24
$63,936
0
$0
0
$0
FILES CLOSED FOR INCOMPLETENESS
1
$102,510
2
$63,410
1
$63,410
0
$0
0
$0
Aggregated Statistics For Year 2000 (Based on 2 partial tracts)
A) FHA, FSA/RHS & VA Home Purchase Loans
B) Conventional Home Purchase Loans
C) Refinancings
D) Home Improvement Loans
F) Non-occupant Loans on < 5 Family Dwellings (A B C & D)
Number
Average Value
Number
Average Value
Number
Average Value
Number
Average Value
Number
Average Value
LOANS ORIGINATED
5
$75,666
61
$67,445
24
$59,885
30
$9,863
2
$40,160
APPLICATIONS APPROVED, NOT ACCEPTED
4
$75,032
15
$43,822
10
$61,189
2
$10,040
1
$35,930
APPLICATIONS DENIED
2
$53,370
42
$42,750
35
$41,125
11
$7,014
1
$51,780
APPLICATIONS WITHDRAWN
4
$65,522
4
$67,108
11
$50,246
2
$15,850
0
$0
FILES CLOSED FOR INCOMPLETENESS
0
$0
2
$207,135
3
$46,850
0
$0
1
$338,180
Aggregated Statistics For Year 1999 (Based on 1 partial tract)
A) FHA, FSA/RHS & VA Home Purchase Loans
B) Conventional Home Purchase Loans
C) Refinancings
D) Home Improvement Loans
F) Non-occupant Loans on < 5 Family Dwellings (A B C & D)
Detailed PMIC statistics for the following Tracts:0202.00
2002 - 2018 National Fire Incident Reporting System (NFIRS) incidents
According to the data from the years 2002 - 2018 the average number of fires per year is 15. The highest number of fire incidents - 50 took place in 2007, and the least - 4 in 2018. The data has a declining trend.
When looking into fire subcategories, the most reports belonged to: Structure Fires (46.5%), and Outside Fires (32.3%).
Fire incident types reported to NFIRS in Zip Code 25033


 Nearest zip codes: 25070, 25168, 25213, 25082, 25109, 25123.


 According to the data from the years 2002 - 2018 the average number of fires per year is 15. The highest number of fire incidents - 50 took place in 2007, and the least - 4 in 2018. The data has a declining trend.
 When looking into fire subcategories, the most reports belonged to: Structure Fires (46.5%), and Outside Fires (32.3%).