Estimated zip code population in 2022: 3,651 Zip code population in 2010: 3,579 Zip code population in 2000: 2,656
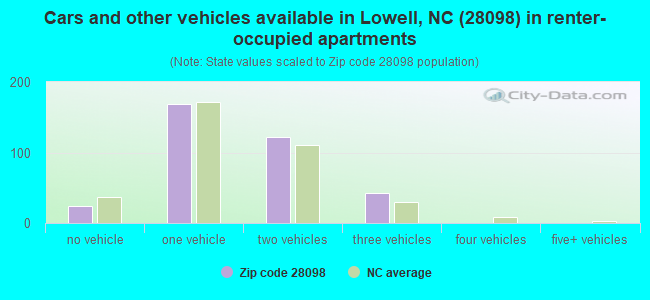
Houses and condos: 1,528 Renter-occupied apartments: 356
% of renters here:
24%
State:
33%
March 2022 cost of living index in zip code 28098: 91.0 (less than average, U.S. average is 100)
Land area: 3.4 sq. mi. Water area: 0.1 sq. mi.
Population density: 1,073 people per square mile
(low).
OSM Map
General Map
Google Map
MSN Map
OSM Map
General Map
Google Map
MSN Map
OSM Map
General Map
Google Map
MSN Map
OSM Map
General Map
Google Map
MSN Map
Please wait while loading the map...
Real estate property taxes paid for housing units in 2022:
This zip code:
0.8% ($1,518)
North Carolina:
0.6% ($1,769)
Median real estate property taxes paid for housing units with mortgages in 2022: $1,494 (0.8%) Median real estate property taxes paid for housing units with no mortgage in 2022: $1,579 (0.9%)
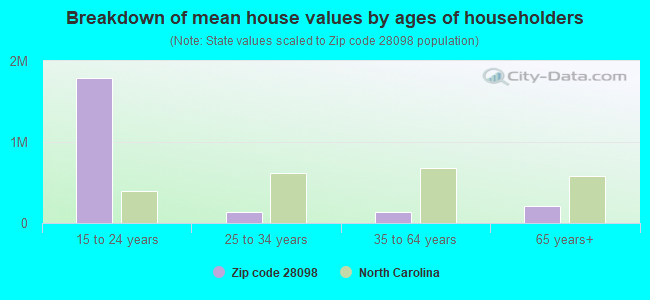
Estimated median house/condo value in 2022: $182,647
28098:
$182,647
North Carolina:
$280,600
According to our research of North Carolina and other state lists, there were 9 registered sex offenders living in 28098 zip code as of April 25, 2024. The ratio of all residents to sex offenders in zip code 28098 is 414 to 1. The ratio of registered sex offenders to all residents in this zip code is near the state average.
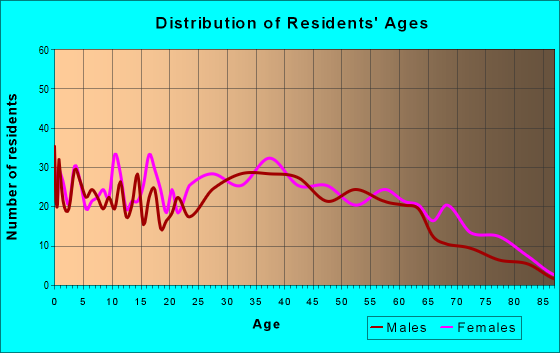
Median resident age:
This zip code:
38.8 years
North Carolina median age:
39.2 years
Average household size:
This zip code:
2.4 people
North Carolina:
2.4 people
Averages for the 2020 tax year for zip code 28098, filed in 2021:
Average Adjusted Gross Income (AGI) in 2020: $49,752 (Individual Income Tax Returns)
Here:
$49,752
State:
$70,020
Salary/wage: $44,946 (reported on 85.8% of returns)
Here:
$44,946
State:
$58,387
(% of AGI for various income ranges: 1109.6% for AGIs below $25k, 3990.0% for AGIs $25k-50k, 6842.2% for AGIs $50k-75k, 10655.5% for AGIs $75k-100k, 15500.9% for AGIs $100k-200k)
Taxable interest for individuals: $412 (reported on 18.6% of returns)
This zip code:
$412
North Carolina:
$1,479
(% of AGI for various income ranges: 8.0% for AGIs below $25k, 3.8% for AGIs $25k-50k, 6.5% for AGIs $50k-75k, 16.4% for AGIs $75k-100k, 47.3% for AGIs $100k-200k)
Ordinary dividends: $2,447 (reported on 9.3% of returns)
Here:
$2,447
State:
$7,888
(% of AGI for various income ranges: 5.1% for AGIs below $25k, 2.9% for AGIs $25k-50k, 17.4% for AGIs $50k-75k, 202.7% for AGIs $75k-100k, 105.5% for AGIs $100k-200k)
Net capital gain/loss in AGI: +$6,412 (reported on 8.7% of returns)
Here:
+$6,412
State:
+$23,652
(% of AGI for various income ranges: 18.8% for AGIs $25k-50k, 41.3% for AGIs $50k-75k, 150.9% for AGIs $75k-100k, 630.0% for AGIs $100k-200k)
Profit/loss from business: +$7,950 (reported on 15.3% of returns)
Here:
+$7,950
State:
+$11,710
(% of AGI for various income ranges: 129.8% for AGIs below $25k, 110.2% for AGIs $25k-50k, 79.6% for AGIs $50k-75k, 79.1% for AGIs $75k-100k, 779.1% for AGIs $100k-200k)
Taxable individual retirement arrangement distribution: $13,683 (reported on 6.6% of returns)
28098:
$13,683
North Carolina:
$20,247
(% of AGI for various income ranges: 59.4% for AGIs below $25k, 76.9% for AGIs $25k-50k, 138.7% for AGIs $50k-75k, 644.5% for AGIs $75k-100k)
Total itemized deductions: $29,167 (reported on 4.9% of returns)
Here:
$29,167
State:
$34,549
(% of AGI for various income ranges: 249.8% for AGIs $25k-50k, 435.5% for AGIs $75k-100k, 997.3% for AGIs $100k-200k)
Charity contributions: $9,225 (reported on 4.4% of returns)
Here:
$9,225
State:
$13,360
(% of AGI for various income ranges: 149.1% for AGIs $50k-75k, 359.1% for AGIs $100k-200k)
Taxes paid: $6,489 (reported on 4.9% of returns)
28098:
$6,489
State:
$7,586
(% of AGI for various income ranges: 39.8% for AGIs $25k-50k, 121.8% for AGIs $75k-100k, 257.3% for AGIs $100k-200k)
Earned income credit: $2,231 (reported on 19.7% of returns)
Here:
$2,231
State:
$2,337
(% of AGI for various income ranges: 99.0% for AGIs below $25k, 75.7% for AGIs $25k-50k)
Percentage of individuals using paid preparers for their 2020 taxes: 94.5%
Here:
95%
State:
93%
(% for various income ranges: 95.2% for AGIs below $25k, 94.5% for AGIs $25k-50k, 93.3% for AGIs $50k-75k, 94.1% for AGIs $75k-100k, 94.1% for AGIs $100k-200k, 100.0% for AGIs over 200k)
Averages for the 2012 tax year for zip code 28098, filed in 2013:
Average Adjusted Gross Income (AGI) in 2012: $39,909 (Individual Income Tax Returns)
Here:
$39,909
State:
$54,937
Salary/wage: $37,250 (reported on 87.7% of returns)
Here:
$37,250
State:
$46,336
(% of AGI for various income ranges: 74.8% for AGIs below $25k, 85.7% for AGIs $25k-50k, 80.9% for AGIs $50k-75k, 84.2% for AGIs $75k-100k, 80.6% for AGIs $100k-200k)
Taxable interest for individuals: $424 (reported on 22.2% of returns)
This zip code:
$424
North Carolina:
$1,298
(% of AGI for various income ranges: 0.5% for AGIs below $25k, 0.2% for AGIs $25k-50k, 0.3% for AGIs $50k-75k, 0.1% for AGIs $100k-200k)
Ordinary dividends: $1,562 (reported on 9.4% of returns)
Here:
$1,562
State:
$6,213
(% of AGI for various income ranges: 0.2% for AGIs below $25k, 0.6% for AGIs $25k-50k, 0.6% for AGIs $50k-75k, 0.1% for AGIs $100k-200k)
Profit/loss from business: +$6,087 (reported on 13.5% of returns)
Here:
+$6,087
State:
+$10,311
(% of AGI for various income ranges: 8.1% for AGIs below $25k, 0.2% for AGIs $25k-50k, 2.7% for AGIs $50k-75k, 1.0% for AGIs $75k-100k, 0.6% for AGIs $100k-200k)
Taxable individual retirement arrangement distribution: $11,614 (reported on 8.2% of returns)
28098:
$11,614
North Carolina:
$15,575
(% of AGI for various income ranges: 3.1% for AGIs below $25k, 1.8% for AGIs $25k-50k, 3.2% for AGIs $50k-75k, 4.7% for AGIs $75k-100k)
Total itemized deductions: $17,223 (25% of AGI, reported on 31.0% of returns)
Here:
$17,223
State:
$23,438
Here:
25.0% of AGI
State:
21.5% of AGI
(% of AGI for various income ranges: 7.7% for AGIs below $25k, 11.4% for AGIs $25k-50k, 14.2% for AGIs $50k-75k, 16.9% for AGIs $75k-100k, 16.0% for AGIs $100k-200k)
Charity contributions: $3,439 (reported on 25.7% of returns)
Here:
$3,439
State:
$4,687
(% of AGI for various income ranges: 1.2% for AGIs below $25k, 2.0% for AGIs $25k-50k, 2.3% for AGIs $50k-75k, 2.9% for AGIs $75k-100k, 2.5% for AGIs $100k-200k)
Taxes paid: $5,679 (reported on 30.4% of returns)
28098:
$5,679
State:
$8,823
(% of AGI for various income ranges: 1.3% for AGIs below $25k, 2.6% for AGIs $25k-50k, 4.5% for AGIs $50k-75k, 6.1% for AGIs $75k-100k, 7.1% for AGIs $100k-200k)
Earned income credit: $2,228 (reported on 23.4% of returns)
Here:
$2,228
State:
$2,376
(% of AGI for various income ranges: 7.4% for AGIs below $25k, 1.2% for AGIs $25k-50k)
Percentage of individuals using paid preparers for their 2012 taxes: 56.1%
Here:
56%
State:
53%
(% for various income ranges: 56.9% for AGIs below $25k, 51.0% for AGIs $25k-50k, 60.0% for AGIs $50k-75k, 61.5% for AGIs $75k-100k, 60.0% for AGIs $100k-200k)
Averages for the 2004 tax year for zip code 28098, filed in 2005:
Average Adjusted Gross Income (AGI) in 2004: $34,004 (Individual Income Tax Returns)
Here:
$34,004
State:
$45,376
Salary/wage: $32,653 (reported on 88.3% of returns)
Here:
$32,653
State:
$39,442
(% of AGI for various income ranges: 72.6% for AGIs below $10k, 81.8% for AGIs $10k-25k, 88.1% for AGIs $25k-50k, 87.2% for AGIs $50k-75k, 85.5% for AGIs $75k-100k, 76.2% for AGIs over 100k)
Taxable interest for individuals: $634 (reported on 29.7% of returns)
This zip code:
$634
North Carolina:
$1,515
(% of AGI for various income ranges: 2.3% for AGIs below $10k, 0.7% for AGIs $10k-25k, 0.4% for AGIs $25k-50k, 0.5% for AGIs $50k-75k, 0.3% for AGIs $75k-100k, 1.0% for AGIs over 100k)
Taxable dividends: $1,156 (reported on 11.6% of returns)
Here:
$1,156
State:
$4,016
(% of AGI for various income ranges: 0.8% for AGIs below $10k, 0.2% for AGIs $10k-25k, 0.8% for AGIs $25k-50k, 0.1% for AGIs $50k-75k, 0.1% for AGIs $75k-100k, 0.5% for AGIs over 100k)
Net capital gain/loss: +$6,082 (reported on 6.6% of returns)
Here:
+$6,082
State:
+$11,152
(% of AGI for various income ranges: -0.0% for AGIs $10k-25k, 0.4% for AGIs $25k-50k, 0.3% for AGIs $50k-75k, 9.1% for AGIs over 100k)
Profit/loss from business: +$5,875 (reported on 12.3% of returns)
Here:
+$5,875
State:
+$9,490
(% of AGI for various income ranges: 11.1% for AGIs below $10k, 4.4% for AGIs $10k-25k, 1.6% for AGIs $25k-50k, 0.2% for AGIs $50k-75k, 4.3% for AGIs $75k-100k)
Total itemized deductions: $15,271 (27% of AGI, reported on 32.1% of returns)
Here:
$15,271
State:
$19,464
Here:
26.7% of AGI
State:
22.7% of AGI
(% of AGI for various income ranges: 8.9% for AGIs $10k-25k, 12.8% for AGIs $25k-50k, 17.3% for AGIs $50k-75k, 18.6% for AGIs $75k-100k, 18.0% for AGIs over 100k)
Charity contributions deductions: $3,342 (6% of AGI, reported on 27.2% of returns)
Here:
$3,342
State:
$4,035
Here:
5.7% of AGI
State:
4.5% of AGI
(% of AGI for various income ranges: 1.7% for AGIs $10k-25k, 1.7% for AGIs $25k-50k, 3.1% for AGIs $50k-75k, 3.6% for AGIs $75k-100k, 5.0% for AGIs over 100k)
Total tax: $3,670 (reported on 71.6% of returns)
28098:
$3,670
State:
$7,257
(% of AGI for various income ranges: 2.2% for AGIs below $10k, 3.6% for AGIs $10k-25k, 6.0% for AGIs $25k-50k, 8.5% for AGIs $50k-75k, 10.6% for AGIs $75k-100k, 14.3% for AGIs over 100k)
Earned income credit: $1,582 (reported on 22.0% of returns)
Here:
$1,582
State:
$1,851
Percentage of individuals using paid preparers for their 2004 taxes: 67.7%
Here:
68%
State:
62%
(% for various income ranges: 62.7% for AGIs below $10k, 73.0% for AGIs $10k-25k, 64.9% for AGIs $25k-50k, 71.8% for AGIs $50k-75k, 65.5% for AGIs $75k-100k, 51.3% for AGIs over 100k)
Likely homosexual households (counted as self-reported same-sex unmarried-partner households)
Lesbian couples: 0.5% of all households
Gay men: 0.0% of all households
Household received Food Stamps/SNAP in the past 12 months: 280 Household did not receive Food Stamps/SNAP in the past 12 months: 1,230
Women who had a birth in the past 12 months: 70 (25 now married, 43 unmarried) Women who did not have a birth in the past 12 months: 746 (409 now married, 338 unmarried)
Housing units in zip code 28098 with a mortgage: 799 (89 second mortgage, 86 both second mortgage and home equity loan) Houses without a mortgage: 38
Median monthly owner costs for units with a mortgage: $1,161 Median monthly owner costs for units without a mortgage: $456
Residents with income below the poverty level in 2022:
This zip code:
21.1%
Whole state:
12.8%
Residents with income below 50% of the poverty level in 2022:
This zip code:
12.8%
Whole state:
6.8%
Median number of rooms in houses and condos:
Here:
6.0
State:
6.4
Median number of rooms in apartments:
Here:
5.1
State:
4.4
Notable locations in this zip code not listed on our city pages
Size of family households: 398 2-persons, 163 3-persons, 181 4-persons, 98 5-persons, 49 6-persons, 14 7-or-more-persons
Size of nonfamily households: 486 1-person, 91 2-persons, 17 3-persons
320 married couples with children.
288 single-parent households (85 men, 203 women).
83.6% of residents of 28098 zip code speak English at home.
12.3% of residents speak Spanish at home (54% very well, 40% well, 7% not well).
0.7% of residents speak other Indo-European language at home (100% very well).
1.2% of residents speak Asian or Pacific Island language at home (38% very well, 62% not well).
2.1% of residents speak other language at home (64% very well, 16% well, 20% not at all).
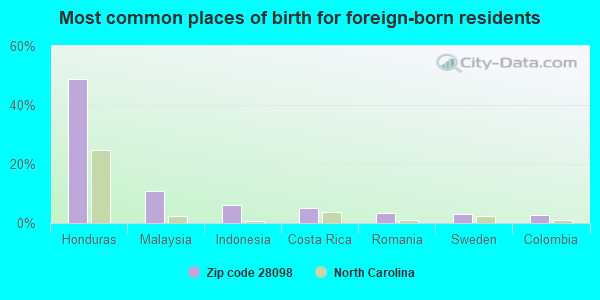
Foreign born population: 328 (9.0%) (47.6% of them are naturalized citizens)
This zip code:
9.0%
Whole state:
8.6%
49%Honduras
11%Malaysia
6%Indonesia
5%Costa Rica
3%Romania
3%Sweden
3%Colombia
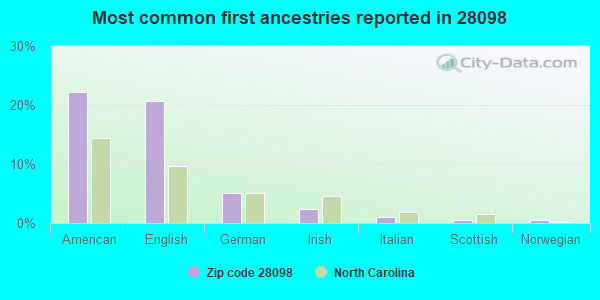
22%American
21%English
5%German
2%Irish
1%Italian
1%Scottish
0%Norwegian
Year of entry for the foreign-born population
1612010 or later
202000 to 2009
1441990 to 1999
26Before 1990
Facilities with environmental interests located in this zip code:
AMP INCORPORATED BUILDING 171 (603 GROVES ST. in LOWELL, NC)
Conditionally Exempt Small Quantity Generators, less than 100 kg/month of hazardous waste (Resource Conservation and Recovery Act (tracking hazardous waste)) - notification TRI REPORTER (Tracking of toxic chemicals releasing facilities) Business SIC classification: ELECTRONIC CONNECTORS
Housing units lacking complete kitchen facilities: 0.4%
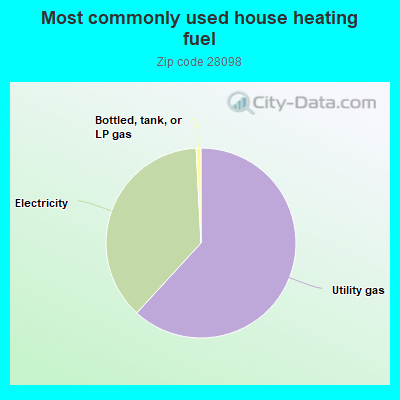
61.7%Utility gas
37.3%Electricity
0.8%Bottled, tank, or LP gas
Population in 1990: 3,424.
Place of birth for U.S.-born residents:
This state: 2,294
Northeast: 285
Midwest: 130
South: 461
West: 112
55% of the 28098 zip code residents lived in the same house 5 years ago. Out of people who lived in different houses, 78% lived in this county. Out of people who lived in different counties, 50% lived in North Carolina.
93% of the 28098 zip code residents lived in the same house 1 year ago. Out of people who lived in different houses, 43% moved from this county. Out of people who lived in different houses, 47% moved from different county within same state. Out of people who lived in different houses, 13% moved from different state.
Private vs. public school enrollment:
Students in private schools in grades 1 to 8 (elementary and middle school): 105
Here:
24.6%
North Carolina:
13.8%
Students in private schools in grades 9 to 12 (high school): 14
Here:
9.9%
North Carolina:
11.9%
Students in private undergraduate colleges: 14
Here:
17.6%
North Carolina:
19.3%
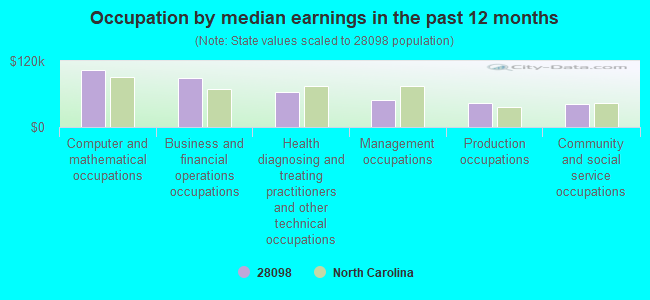
Occupation by median earnings in the past 12 months ($)
103,937Computer and mathematical occupations
88,566Business and financial operations occupations
64,416Health diagnosing and treating practitioners and other technical occupations
48,211Management occupations
42,765Production occupations
41,419Community and social service occupations
Companies with federal contracts located in this zip code:
BRYANT ELECTRIC SUPPLY INC (825 GROVES ST in LOWELL, NC; small business)
$16,881 with Army for Electrical Hardware and Supplies. Signed on 2006-06-27. Completion date: 2006-08-04.
Top industries in this zip code by the number of employees in 2005:
Wholesale Trade: Other Grocery and Related Products Merchant Wholesalers (100-249 employees: 1 establishment, 10-19 employees: 1 establishment)
Wholesale Trade: Electrical Apparatus and Equipment, Wiring Supplies, and Related Equipment Merchant Wholesalers (50-99: 1)
Accommodation and Food Services: Full-Service Restaurants (20-49: 1, 10-19: 1)
Construction: Drywall and Insulation Contractors (20-49: 1)
Accommodation and Food Services: Limited-Service Restaurants (20-49: 1)
Health Care and Social Assistance: Other Residential Care Facilities (20-49: 1)
Fatal accident statistics in 2011:
Fatal accident count: 1
Vehicles involved in fatal accidents: 1
Fatal accidents caused by drunken drivers: 0
Fatalities: 1
Persons involved in fatal accidents: 3
Pedestrians involved in fatal accidents: 1
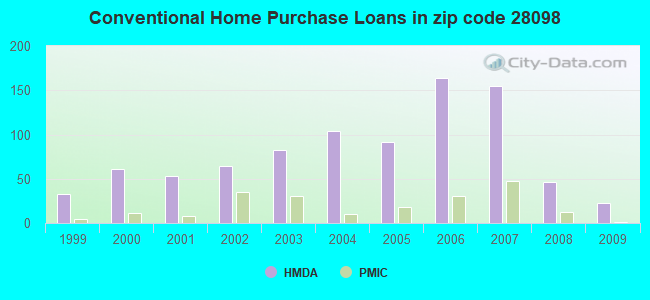
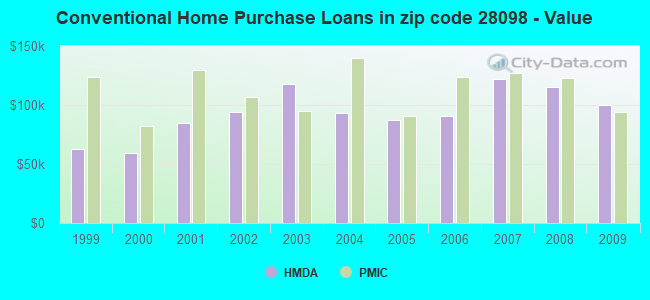
Home Mortgage Disclosure Act Aggregated Statistics For Year 2009 (Based on 4 partial tracts)
A) FHA, FSA/RHS & VA Home Purchase Loans
B) Conventional Home Purchase Loans
C) Refinancings
D) Home Improvement Loans
F) Non-occupant Loans on < 5 Family Dwellings (A B C & D)
Number
Average Value
Number
Average Value
Number
Average Value
Number
Average Value
Number
Average Value
LOANS ORIGINATED
52
$114,579
23
$100,240
95
$126,891
9
$49,451
12
$72,284
APPLICATIONS APPROVED, NOT ACCEPTED
3
$143,290
2
$37,205
8
$66,061
0
$0
2
$38,165
APPLICATIONS DENIED
8
$98,022
3
$49,883
41
$121,866
3
$31,383
0
$0
APPLICATIONS WITHDRAWN
9
$114,000
5
$95,416
24
$124,424
0
$0
3
$76,823
FILES CLOSED FOR INCOMPLETENESS
4
$119,098
2
$90,115
5
$85,612
3
$17,263
0
$0
Aggregated Statistics For Year 2008 (Based on 4 partial tracts)
A) FHA, FSA/RHS & VA Home Purchase Loans
B) Conventional Home Purchase Loans
C) Refinancings
D) Home Improvement Loans
E) Loans on Dwellings For 5+ Families
F) Non-occupant Loans on < 5 Family Dwellings (A B C & D)
G) Loans On Manufactured Home Dwelling (A B C & D)
Number
Average Value
Number
Average Value
Number
Average Value
Number
Average Value
Number
Average Value
Number
Average Value
Number
Average Value
LOANS ORIGINATED
46
$124,609
46
$115,284
78
$122,174
11
$26,765
1
$1,139,420
24
$103,898
1
$51,240
APPLICATIONS APPROVED, NOT ACCEPTED
3
$97,540
8
$98,996
14
$89,787
3
$15,130
0
$0
6
$74,280
0
$0
APPLICATIONS DENIED
7
$115,407
16
$63,891
57
$106,660
22
$52,955
1
$1,165,320
12
$55,794
0
$0
APPLICATIONS WITHDRAWN
5
$133,866
12
$94,267
38
$107,149
3
$87,183
0
$0
1
$90,970
2
$61,955
FILES CLOSED FOR INCOMPLETENESS
1
$129,480
3
$132,070
8
$87,946
2
$49,690
0
$0
0
$0
0
$0
Aggregated Statistics For Year 2007 (Based on 4 partial tracts)
A) FHA, FSA/RHS & VA Home Purchase Loans
B) Conventional Home Purchase Loans
C) Refinancings
D) Home Improvement Loans
F) Non-occupant Loans on < 5 Family Dwellings (A B C & D)
G) Loans On Manufactured Home Dwelling (A B C & D)
Number
Average Value
Number
Average Value
Number
Average Value
Number
Average Value
Number
Average Value
Number
Average Value
LOANS ORIGINATED
29
$130,915
155
$122,438
81
$98,241
21
$45,472
49
$88,020
4
$79,630
APPLICATIONS APPROVED, NOT ACCEPTED
2
$59,455
12
$124,407
14
$99,779
3
$24,063
1
$86,750
0
$0
APPLICATIONS DENIED
4
$115,102
38
$98,700
114
$97,617
22
$52,850
11
$92,418
1
$24,600
APPLICATIONS WITHDRAWN
5
$139,320
16
$148,952
38
$105,273
4
$65,425
3
$65,433
0
$0
FILES CLOSED FOR INCOMPLETENESS
1
$218,820
6
$108,790
16
$98,766
1
$75,100
1
$31,240
0
$0
Aggregated Statistics For Year 2006 (Based on 4 partial tracts)
A) FHA, FSA/RHS & VA Home Purchase Loans
B) Conventional Home Purchase Loans
C) Refinancings
D) Home Improvement Loans
F) Non-occupant Loans on < 5 Family Dwellings (A B C & D)
G) Loans On Manufactured Home Dwelling (A B C & D)
Number
Average Value
Number
Average Value
Number
Average Value
Number
Average Value
Number
Average Value
Number
Average Value
LOANS ORIGINATED
17
$134,662
164
$90,795
100
$77,201
19
$33,274
45
$58,966
2
$51,035
APPLICATIONS APPROVED, NOT ACCEPTED
4
$141,132
19
$110,234
18
$79,355
4
$16,832
4
$84,162
1
$46,610
APPLICATIONS DENIED
2
$114,335
28
$71,945
107
$89,131
15
$55,217
7
$77,979
4
$36,255
APPLICATIONS WITHDRAWN
7
$137,010
16
$111,446
55
$98,932
6
$55,953
2
$81,545
0
$0
FILES CLOSED FOR INCOMPLETENESS
1
$198,100
8
$95,121
19
$129,892
0
$0
3
$57,403
0
$0
Aggregated Statistics For Year 2005 (Based on 4 partial tracts)
A) FHA, FSA/RHS & VA Home Purchase Loans
B) Conventional Home Purchase Loans
C) Refinancings
D) Home Improvement Loans
F) Non-occupant Loans on < 5 Family Dwellings (A B C & D)
G) Loans On Manufactured Home Dwelling (A B C & D)
Number
Average Value
Number
Average Value
Number
Average Value
Number
Average Value
Number
Average Value
Number
Average Value
LOANS ORIGINATED
24
$128,396
91
$87,706
92
$74,235
16
$32,068
25
$60,187
3
$63,447
APPLICATIONS APPROVED, NOT ACCEPTED
0
$0
4
$88,780
13
$90,098
6
$28,702
2
$118,920
0
$0
APPLICATIONS DENIED
2
$121,820
14
$74,734
117
$86,987
15
$45,842
7
$57,507
1
$27,670
APPLICATIONS WITHDRAWN
0
$0
15
$84,531
39
$106,135
9
$62,031
3
$92,793
0
$0
FILES CLOSED FOR INCOMPLETENESS
0
$0
3
$90,687
21
$106,452
1
$19,420
0
$0
0
$0
Aggregated Statistics For Year 2004 (Based on 4 partial tracts)
A) FHA, FSA/RHS & VA Home Purchase Loans
B) Conventional Home Purchase Loans
C) Refinancings
D) Home Improvement Loans
F) Non-occupant Loans on < 5 Family Dwellings (A B C & D)
G) Loans On Manufactured Home Dwelling (A B C & D)
Number
Average Value
Number
Average Value
Number
Average Value
Number
Average Value
Number
Average Value
Number
Average Value
LOANS ORIGINATED
34
$116,042
104
$93,143
124
$83,114
20
$21,659
48
$69,632
3
$50,497
APPLICATIONS APPROVED, NOT ACCEPTED
2
$101,350
14
$69,543
20
$66,416
2
$6,750
3
$87,347
2
$20,895
APPLICATIONS DENIED
3
$82,770
21
$91,044
105
$84,834
16
$17,965
10
$63,411
6
$101,248
APPLICATIONS WITHDRAWN
2
$141,020
8
$76,298
43
$112,706
3
$88,477
3
$68,297
0
$0
FILES CLOSED FOR INCOMPLETENESS
0
$0
3
$36,687
19
$98,396
0
$0
0
$0
0
$0
Aggregated Statistics For Year 2003 (Based on 4 partial tracts)
A) FHA, FSA/RHS & VA Home Purchase Loans
B) Conventional Home Purchase Loans
C) Refinancings
D) Home Improvement Loans
F) Non-occupant Loans on < 5 Family Dwellings (A B C & D)
Number
Average Value
Number
Average Value
Number
Average Value
Number
Average Value
Number
Average Value
LOANS ORIGINATED
49
$117,021
83
$117,726
182
$94,005
12
$17,596
35
$66,538
APPLICATIONS APPROVED, NOT ACCEPTED
0
$0
8
$94,138
17
$74,225
4
$4,345
3
$55,977
APPLICATIONS DENIED
5
$120,452
25
$52,089
98
$73,886
14
$11,713
5
$53,964
APPLICATIONS WITHDRAWN
6
$112,807
12
$105,317
39
$85,667
1
$97,110
3
$45,610
FILES CLOSED FOR INCOMPLETENESS
4
$126,028
2
$107,600
3
$82,293
0
$0
0
$0
Aggregated Statistics For Year 2002 (Based on 4 partial tracts)
A) FHA, FSA/RHS & VA Home Purchase Loans
B) Conventional Home Purchase Loans
C) Refinancings
D) Home Improvement Loans
F) Non-occupant Loans on < 5 Family Dwellings (A B C & D)
Number
Average Value
Number
Average Value
Number
Average Value
Number
Average Value
Number
Average Value
LOANS ORIGINATED
46
$110,621
64
$94,453
150
$78,005
10
$24,022
34
$62,227
APPLICATIONS APPROVED, NOT ACCEPTED
0
$0
4
$38,712
26
$77,220
6
$13,692
3
$47,600
APPLICATIONS DENIED
15
$115,727
19
$48,959
84
$70,228
7
$23,916
5
$58,654
APPLICATIONS WITHDRAWN
2
$133,660
12
$83,754
40
$71,584
4
$28,612
2
$53,850
FILES CLOSED FOR INCOMPLETENESS
0
$0
3
$84,717
7
$48,603
0
$0
1
$72,510
Aggregated Statistics For Year 2001 (Based on 4 partial tracts)
A) FHA, FSA/RHS & VA Home Purchase Loans
B) Conventional Home Purchase Loans
C) Refinancings
D) Home Improvement Loans
E) Loans on Dwellings For 5+ Families
F) Non-occupant Loans on < 5 Family Dwellings (A B C & D)
Number
Average Value
Number
Average Value
Number
Average Value
Number
Average Value
Number
Average Value
Number
Average Value
LOANS ORIGINATED
16
$93,633
53
$84,502
91
$65,726
8
$19,382
1
$356,070
25
$56,598
APPLICATIONS APPROVED, NOT ACCEPTED
1
$84,160
12
$48,010
21
$63,140
3
$8,467
0
$0
1
$15,890
APPLICATIONS DENIED
0
$0
44
$41,191
56
$61,737
15
$16,349
0
$0
6
$45,503
APPLICATIONS WITHDRAWN
1
$97,820
10
$49,956
27
$63,663
1
$7,400
0
$0
3
$64,663
FILES CLOSED FOR INCOMPLETENESS
0
$0
0
$0
3
$79,717
0
$0
0
$0
1
$21,920
Aggregated Statistics For Year 2000 (Based on 4 partial tracts)
A) FHA, FSA/RHS & VA Home Purchase Loans
B) Conventional Home Purchase Loans
C) Refinancings
D) Home Improvement Loans
F) Non-occupant Loans on < 5 Family Dwellings (A B C & D)
Number
Average Value
Number
Average Value
Number
Average Value
Number
Average Value
Number
Average Value
LOANS ORIGINATED
17
$97,178
61
$59,027
68
$68,765
21
$17,509
15
$48,963
APPLICATIONS APPROVED, NOT ACCEPTED
3
$32,683
23
$56,750
22
$63,612
5
$17,828
5
$64,998
APPLICATIONS DENIED
3
$66,163
69
$52,383
71
$57,237
9
$11,948
8
$68,139
APPLICATIONS WITHDRAWN
6
$53,022
7
$68,354
32
$67,950
2
$8,120
3
$46,353
FILES CLOSED FOR INCOMPLETENESS
0
$0
3
$54,380
2
$36,955
0
$0
0
$0
Aggregated Statistics For Year 1999 (Based on 2 partial tracts)
A) FHA, FSA/RHS & VA Home Purchase Loans
B) Conventional Home Purchase Loans
C) Refinancings
D) Home Improvement Loans
F) Non-occupant Loans on < 5 Family Dwellings (A B C & D)
Detailed PMIC statistics for the following Tracts:0313.02
, 0322.00
2002 - 2018 National Fire Incident Reporting System (NFIRS) incidents
Based on the data from the years 2002 - 2018 the average number of fires per year is 13. The highest number of reported fire incidents - 49 took place in 2017, and the least - 0 in 2003. The data has an increasing trend.
When looking into fire subcategories, the most reports belonged to: Structure Fires (51.8%), and Outside Fires (25.5%).
Fire incident types reported to NFIRS in Zip Code 28098


 Nearest zip codes: 28101, 28032, 28054, 28056, 28012, 28120.


 Based on the data from the years 2002 - 2018 the average number of fires per year is 13. The highest number of reported fire incidents - 49 took place in 2017, and the least - 0 in 2003. The data has an increasing trend.
 When looking into fire subcategories, the most reports belonged to: Structure Fires (51.8%), and Outside Fires (25.5%).