Estimated zip code population in 2022: 2,729 Zip code population in 2010: 2,150 Zip code population in 2000: 1,063
Houses and condos: 1,216 Renter-occupied apartments: 216
% of renters here:
19%
State:
33%
March 2022 cost of living index in zip code 28373: 81.1 (low, U.S. average is 100)
Land area: 12.9 sq. mi. Water area: 0.1 sq. mi.
Population density: 211 people per square mile
(very low).
OSM Map
General Map
Google Map
MSN Map
OSM Map
General Map
Google Map
MSN Map
OSM Map
General Map
Google Map
MSN Map
OSM Map
General Map
Google Map
MSN Map
Please wait while loading the map...
Real estate property taxes paid for housing units in 2022:
This zip code:
0.5% ($1,290)
North Carolina:
0.6% ($1,769)
Median real estate property taxes paid for housing units with mortgages in 2022: $1,416 (0.5%) Median real estate property taxes paid for housing units with no mortgage in 2022: $923 (0.4%)
Business Search- 14 Million verified businesses
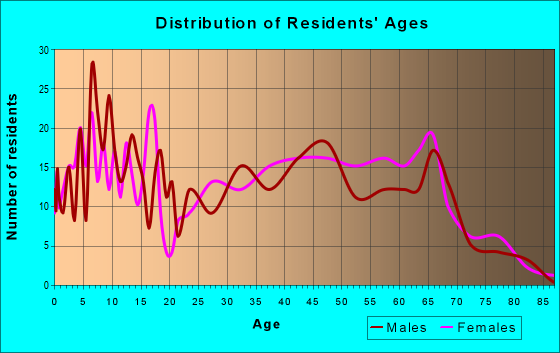
Males: 1,352
(49.6%)
Females: 1,376
(50.4%)
For population 25 years and over in 28373:
High school or higher: 89.3%
Bachelor's degree or higher: 30.9%
Graduate or professional degree: 6.9%
Unemployed: 2.0%
Mean travel time to work (commute): 24.6 minutes
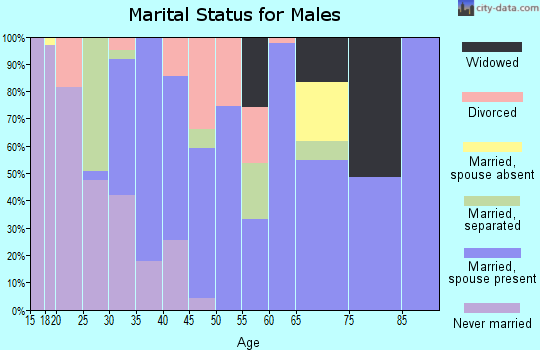
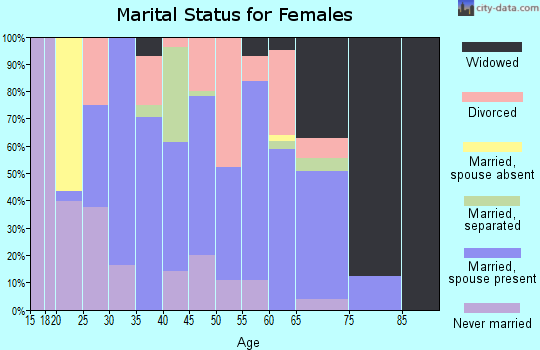
For population 15 years and over in 28373:
Never married: 23.4%
Now married: 64.4%
Separated: 1.1%
Widowed: 5.6%
Divorced: 5.6%
Zip code 28373 compared to state average:
Unemployed percentage below state average.
Renting percentage below state average.
Length of stay since moving in above state average.
Estimated median house/condo value in 2022: $255,992
28373:
$255,992
North Carolina:
$280,600
According to our research of North Carolina and other state lists, there were 5 registered sex offenders living in 28373 zip code as of April 25, 2024. The ratio of all residents to sex offenders in zip code 28373 is 548 to 1. The ratio of registered sex offenders to all residents in this zip code is near the state average.
Median resident age:
This zip code:
39.3 years
North Carolina median age:
39.2 years
Average household size:
This zip code:
2.4 people
North Carolina:
2.4 people
Averages for the 2020 tax year for zip code 28373, filed in 2021:
Average Adjusted Gross Income (AGI) in 2020: $47,493 (Individual Income Tax Returns)
Here:
$47,493
State:
$70,020
Salary/wage: $43,497 (reported on 80.0% of returns)
Here:
$43,497
State:
$58,387
(% of AGI for various income ranges: 1142.9% for AGIs below $25k, 3618.2% for AGIs $25k-50k, 7035.4% for AGIs $50k-75k, 10307.1% for AGIs $75k-100k, 26238.0% for AGIs $100k-200k)
Taxable interest for individuals: $453 (reported on 24.0% of returns)
This zip code:
$453
North Carolina:
$1,479
(% of AGI for various income ranges: 6.5% for AGIs below $25k, 7.9% for AGIs $25k-50k, 25.4% for AGIs $50k-75k, 35.7% for AGIs $75k-100k, 68.0% for AGIs $100k-200k)
Ordinary dividends: $1,867 (reported on 9.6% of returns)
Here:
$1,867
State:
$7,888
(% of AGI for various income ranges: 9.1% for AGIs below $25k, 11.4% for AGIs $25k-50k, 59.2% for AGIs $50k-75k, 168.0% for AGIs $100k-200k)
Net capital gain/loss in AGI: +$5,300 (reported on 8.8% of returns)
Here:
+$5,300
State:
+$23,652
(% of AGI for various income ranges: 6.2% for AGIs below $25k, 13.9% for AGIs $25k-50k, 57.7% for AGIs $50k-75k, 896.0% for AGIs $100k-200k)
Profit/loss from business: +$10,157 (reported on 18.4% of returns)
Here:
+$10,157
State:
+$11,710
(% of AGI for various income ranges: 195.9% for AGIs below $25k, 222.9% for AGIs $25k-50k, 318.5% for AGIs $50k-75k, 902.9% for AGIs $75k-100k)
Taxable individual retirement arrangement distribution: $15,667 (reported on 7.2% of returns)
28373:
$15,667
North Carolina:
$20,247
(% of AGI for various income ranges: 49.4% for AGIs below $25k, 156.8% for AGIs $25k-50k, 1147.1% for AGIs $75k-100k)
Total itemized deductions: $23,700 (reported on 4.0% of returns)
Here:
$23,700
State:
$34,549
(% of AGI for various income ranges: 221.1% for AGIs $25k-50k, 1132.0% for AGIs $100k-200k)
Charity contributions: $6,025 (reported on 3.2% of returns)
Here:
$6,025
State:
$13,360
(% of AGI for various income ranges: 344.3% for AGIs $75k-100k)
Taxes paid: $6,160 (reported on 4.0% of returns)
28373:
$6,160
State:
$7,586
(% of AGI for various income ranges: 42.9% for AGIs $25k-50k, 376.0% for AGIs $100k-200k)
Earned income credit: $2,219 (reported on 21.6% of returns)
Here:
$2,219
State:
$2,337
(% of AGI for various income ranges: 102.9% for AGIs below $25k, 88.9% for AGIs $25k-50k)
Percentage of individuals using paid preparers for their 2020 taxes: 92.8%
Here:
93%
State:
93%
(% for various income ranges: 93.6% for AGIs below $25k, 91.7% for AGIs $25k-50k, 94.7% for AGIs $50k-75k, 90.9% for AGIs $75k-100k, 91.7% for AGIs $100k-200k)
Averages for the 2012 tax year for zip code 28373, filed in 2013:
Average Adjusted Gross Income (AGI) in 2012: $37,855 (Individual Income Tax Returns)
Here:
$37,855
State:
$54,937
Salary/wage: $34,167 (reported on 85.3% of returns)
Here:
$34,167
State:
$46,336
(% of AGI for various income ranges: 77.8% for AGIs below $25k, 78.0% for AGIs $25k-50k, 75.6% for AGIs $50k-75k, 83.3% for AGIs $75k-100k, 71.9% for AGIs $100k-200k)
Taxable interest for individuals: $373 (reported on 23.9% of returns)
This zip code:
$373
North Carolina:
$1,298
(% of AGI for various income ranges: 0.3% for AGIs below $25k, 0.3% for AGIs $25k-50k, 0.2% for AGIs $50k-75k, 0.1% for AGIs $75k-100k, 0.2% for AGIs $100k-200k)
Ordinary dividends: $1,915 (reported on 11.9% of returns)
Here:
$1,915
State:
$6,213
(% of AGI for various income ranges: 0.6% for AGIs below $25k, 0.4% for AGIs $25k-50k, 0.8% for AGIs $50k-75k, 1.4% for AGIs $75k-100k)
Net capital gain/loss in AGI: +$229 (reported on 6.4% of returns)
Here:
+$229
State:
+$12,740
Profit/loss from business: +$7,689 (reported on 16.5% of returns)
Here:
+$7,689
State:
+$10,311
(% of AGI for various income ranges: 8.0% for AGIs below $25k, 4.5% for AGIs $25k-50k, 4.3% for AGIs $50k-75k)
Taxable individual retirement arrangement distribution: $12,014 (reported on 6.4% of returns)
28373:
$12,014
North Carolina:
$15,575
(% of AGI for various income ranges: 2.2% for AGIs below $25k, 3.5% for AGIs $25k-50k, 5.3% for AGIs $75k-100k)
Total itemized deductions: $17,029 (25% of AGI, reported on 28.4% of returns)
Here:
$17,029
State:
$23,438
Here:
25.0% of AGI
State:
21.5% of AGI
(% of AGI for various income ranges: 9.0% for AGIs below $25k, 12.6% for AGIs $25k-50k, 14.3% for AGIs $50k-75k, 13.6% for AGIs $75k-100k, 13.6% for AGIs $100k-200k)
Charity contributions: $2,983 (reported on 22.0% of returns)
Here:
$2,983
State:
$4,687
(% of AGI for various income ranges: 1.1% for AGIs below $25k, 1.9% for AGIs $25k-50k, 2.0% for AGIs $50k-75k, 1.9% for AGIs $75k-100k, 1.7% for AGIs $100k-200k)
Taxes paid: $4,955 (reported on 28.4% of returns)
28373:
$4,955
State:
$8,823
(% of AGI for various income ranges: 1.3% for AGIs below $25k, 2.5% for AGIs $25k-50k, 3.8% for AGIs $50k-75k, 4.8% for AGIs $75k-100k, 6.1% for AGIs $100k-200k)
Earned income credit: $2,414 (reported on 26.6% of returns)
Here:
$2,414
State:
$2,376
(% of AGI for various income ranges: 9.0% for AGIs below $25k, 1.2% for AGIs $25k-50k)
Percentage of individuals using paid preparers for their 2012 taxes: 52.3%
Here:
52%
State:
53%
(% for various income ranges: 51.9% for AGIs below $25k, 51.9% for AGIs $25k-50k, 43.8% for AGIs $50k-75k, 62.5% for AGIs $75k-100k, 66.7% for AGIs $100k-200k)
Averages for the 2004 tax year for zip code 28373, filed in 2005:
Average Adjusted Gross Income (AGI) in 2004: $30,722 (Individual Income Tax Returns)
Here:
$30,722
State:
$45,376
Salary/wage: $27,801 (reported on 87.4% of returns)
Here:
$27,801
State:
$39,442
(% of AGI for various income ranges: 107.1% for AGIs below $10k, 78.7% for AGIs $10k-25k, 84.7% for AGIs $25k-50k, 81.5% for AGIs $50k-75k, 72.3% for AGIs $75k-100k, 60.8% for AGIs over 100k)
Taxable interest for individuals: $671 (reported on 28.2% of returns)
This zip code:
$671
North Carolina:
$1,515
(% of AGI for various income ranges: 1.1% for AGIs below $10k, 0.9% for AGIs $10k-25k, 0.6% for AGIs $25k-50k, 0.3% for AGIs $50k-75k, 0.3% for AGIs $75k-100k, 1.0% for AGIs over 100k)
Taxable dividends: $1,646 (reported on 11.2% of returns)
Here:
$1,646
State:
$4,016
(% of AGI for various income ranges: 1.1% for AGIs below $10k, 0.9% for AGIs $10k-25k, 0.6% for AGIs $25k-50k, 0.4% for AGIs $50k-75k, 0.9% for AGIs $75k-100k)
Net capital gain/loss: +$1,429 (reported on 8.4% of returns)
Here:
+$1,429
State:
+$11,152
(% of AGI for various income ranges: -1.0% for AGIs below $10k, 0.1% for AGIs $10k-25k, 0.6% for AGIs $25k-50k, 0.4% for AGIs $50k-75k, 1.1% for AGIs $75k-100k)
Profit/loss from business: +$8,837 (reported on 15.2% of returns)
Here:
+$8,837
State:
+$9,490
(% of AGI for various income ranges: 1.8% for AGIs below $10k, 6.1% for AGIs $10k-25k, 3.8% for AGIs $25k-50k, 5.6% for AGIs $50k-75k, 5.8% for AGIs $75k-100k)
IRA payment deduction: $2,588 (reported on 1.7% of returns)
28373:
$2,588
North Carolina:
$2,967
Total itemized deductions: $14,466 (27% of AGI, reported on 28.2% of returns)
Here:
$14,466
State:
$19,464
Here:
27.1% of AGI
State:
22.7% of AGI
(% of AGI for various income ranges: 10.6% for AGIs $10k-25k, 14.2% for AGIs $25k-50k, 14.2% for AGIs $50k-75k, 15.8% for AGIs $75k-100k, 13.7% for AGIs over 100k)
Charity contributions deductions: $2,556 (5% of AGI, reported on 23.8% of returns)
Here:
$2,556
State:
$4,035
Here:
4.6% of AGI
State:
4.5% of AGI
(% of AGI for various income ranges: 1.0% for AGIs $10k-25k, 2.5% for AGIs $25k-50k, 2.4% for AGIs $50k-75k, 2.9% for AGIs $75k-100k, 0.9% for AGIs over 100k)
Total tax: $3,646 (reported on 64.9% of returns)
28373:
$3,646
State:
$7,257
(% of AGI for various income ranges: 2.2% for AGIs below $10k, 3.3% for AGIs $10k-25k, 6.0% for AGIs $25k-50k, 8.2% for AGIs $50k-75k, 10.4% for AGIs $75k-100k, 16.2% for AGIs over 100k)
Earned income credit: $1,997 (reported on 28.9% of returns)
Here:
$1,997
State:
$1,851
Percentage of individuals using paid preparers for their 2004 taxes: 64.8%
Here:
65%
State:
62%
(% for various income ranges: 57.7% for AGIs below $10k, 69.6% for AGIs $10k-25k, 60.2% for AGIs $25k-50k, 68.8% for AGIs $50k-75k, 69.0% for AGIs $75k-100k, 78.6% for AGIs over 100k)
Household received Food Stamps/SNAP in the past 12 months: 53 Household did not receive Food Stamps/SNAP in the past 12 months: 1,051
Women who had a birth in the past 12 months: 30 (30 now married, 0 unmarried) Women who did not have a birth in the past 12 months: 558 (370 now married, 190 unmarried)
Housing units in zip code 28373 with a mortgage: 628 (140 second mortgage, 139 both second mortgage and home equity loan) Houses without a mortgage: 8
Median monthly owner costs for units with a mortgage: $1,301 Median monthly owner costs for units without a mortgage: $363
Residents with income below the poverty level in 2022:
This zip code:
5.2%
Whole state:
12.8%
Residents with income below 50% of the poverty level in 2022:
This zip code:
3.7%
Whole state:
6.8%
Median number of rooms in houses and condos:
Here:
6.4
State:
6.4
Median number of rooms in apartments:
Here:
4.5
State:
4.4
Notable locations in this zip code not listed on our city pages
Size of family households: 292 2-persons, 227 3-persons, 101 4-persons, 102 5-persons, 9 6-persons
Size of nonfamily households: 308 1-person, 55 2-persons, 14 4-persons
566 married couples with children.
38 single-parent households (38 women).
92.6% of residents of 28373 zip code speak English at home.
5.7% of residents speak Spanish at home (52% very well, 18% well, 6% not well, 24% not at all).
0.8% of residents speak other Indo-European language at home (32% very well, 68% well).
Foreign born population: 308 (11.3%) (58.9% of them are naturalized citizens)
This zip code:
11.3%
Whole state:
8.6%
30%Honduras
5%Romania
3%Sweden
3%United Kingdom, excluding England and Scotland
2%Dominica
1%France
10%English
9%American
8%Irish
8%Italian
6%Canadian
5%Scottish
4%German
Year of entry for the foreign-born population
302010 or later
242000 to 2009
1851990 to 1999
51Before 1990
Housing units lacking complete kitchen facilities: 0.4%
92.2%Electricity
4.0%Bottled, tank, or LP gas
2.1%No fuel used
1.5%Wood
Place of birth for U.S.-born residents:
This state: 1,485
Northeast: 455
Midwest: 120
South: 282
West: 70
51% of the 28373 zip code residents lived in the same house 5 years ago. Out of people who lived in different houses, 43% lived in this county. Out of people who lived in different counties, 50% lived in North Carolina.
97% of the 28373 zip code residents lived in the same house 1 year ago. Out of people who lived in different houses, 53% moved from this county. Out of people who lived in different houses, 38% moved from different county within same state. Out of people who lived in different houses, 24% moved from different state.
Private vs. public school enrollment:
Students in private schools in grades 1 to 8 (elementary and middle school): 131
Here:
50.5%
North Carolina:
13.8%
Students in private schools in grades 9 to 12 (high school):
Here:
0.0%
North Carolina:
11.9%
Students in private undergraduate colleges: 4
Here:
8.5%
North Carolina:
19.3%
Occupation by median earnings in the past 12 months ($)
93,127Installation, maintenance, and repair occupations
89,303Arts, design, entertainment, sports, and media occupations
66,671Health diagnosing and treating practitioners and other technical occupations
62,445Management occupations
60,695Business and financial operations occupations
55,825Transportation occupations
Companies with federal contracts located in this zip code:
COYLE, BARRY G (255 E NEW ENGLAND AVE in PINEBLUFF, NC; small business)
$6,750 with Army for Miscellaneous Construction Materials. Signed on 2005-06-22. Completion date: 2005-07-22.
Top industries in this zip code by the number of employees in 2005:
Health Care and Social Assistance: Continuing Care Retirement Communities (20-49: 1)
Construction: New Single-Family Housing Construction (except Operative Builders) (5-9: 1, 1-4: 4)
Arts, Entertainment, and Recreation: Golf Courses and Country Clubs (10-19: 1)
Construction: Framing Contractors (10-19: 1)
Construction: Power and Communication Line and Related Structures Construction (5-9: 1, 1-4: 1)
Other Services (except Public Administration): General Automotive Repair (5-9: 1, 1-4: 1)
People in group quarters in 2000:
6 people in other noninstitutional group quarters
Fatal accident statistics in 2014:
Fatal accident count: 1
Vehicles involved in fatal accidents: 1
Fatal accidents caused by drunken drivers: 1
Fatalities: 1
Persons involved in fatal accidents: 3
Pedestrians involved in fatal accidents: 0
Fatal accident statistics in 2011:
Fatal accident count: 1
Vehicles involved in fatal accidents: 1
Fatal accidents caused by drunken drivers: 0
Fatalities: 1
Persons involved in fatal accidents: 1
Pedestrians involved in fatal accidents: 0
2002 - 2018 National Fire Incident Reporting System (NFIRS) incidents
According to the data from the years 2002 - 2018 the average number of fires per year is 38. The highest number of reported fire incidents - 81 took place in 2008, and the least - 7 in 2003. The data has an increasing trend.
When looking into fire subcategories, the most reports belonged to: Outside Fires (50.9%), and Structure Fires (41.4%).
Fire incident types reported to NFIRS in Zip Code 28373


 Nearest zip codes: 28315, 28374, 28347, 28387, 28363, 27376.


 According to the data from the years 2002 - 2018 the average number of fires per year is 38. The highest number of reported fire incidents - 81 took place in 2008, and the least - 7 in 2003. The data has an increasing trend.
 When looking into fire subcategories, the most reports belonged to: Outside Fires (50.9%), and Structure Fires (41.4%).