Estimated zip code population in 2022: 3,636 Zip code population in 2010: 3,829 Zip code population in 2000: 3,444
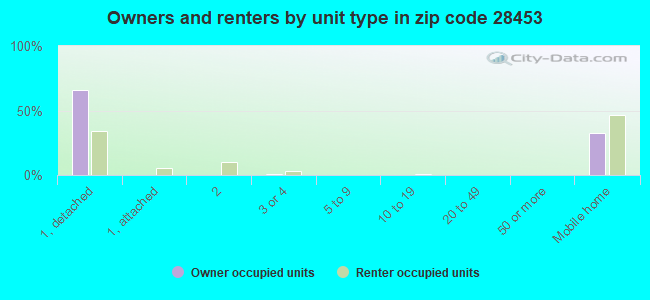
Houses and condos: 1,588 Renter-occupied apartments: 467
% of renters here:
33%
State:
33%
March 2022 cost of living index in zip code 28453: 79.2 (low, U.S. average is 100)
Land area: 82.6 sq. mi. Water area: 0.4 sq. mi.
Population density: 44 people per square mile
(very low).
OSM Map
General Map
Google Map
MSN Map
OSM Map
General Map
Google Map
MSN Map
OSM Map
General Map
Google Map
MSN Map
OSM Map
General Map
Google Map
MSN Map
Please wait while loading the map...
Real estate property taxes paid for housing units in 2022:
This zip code:
0.6% ($712)
North Carolina:
0.6% ($1,769)
Median real estate property taxes paid for housing units with mortgages in 2022: $750 (0.4%) Median real estate property taxes paid for housing units with no mortgage in 2022: $619 (0.8%)
Business Search- 14 Million verified businesses
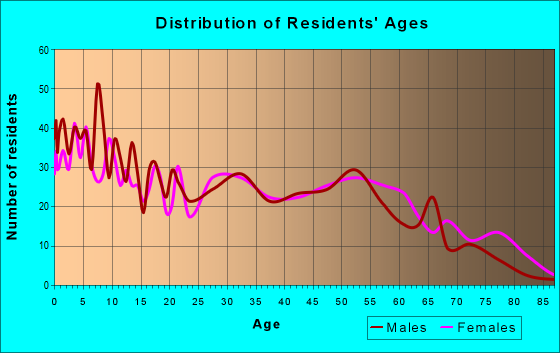
Males: 1,677
(46.1%)
Females: 1,959
(53.9%)
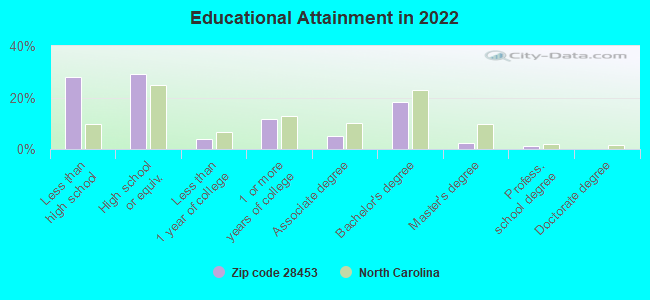
For population 25 years and over in 28453:
High school or higher: 69.9%
Bachelor's degree or higher: 21.3%
Graduate or professional degree: 3.6%
Unemployed: 4.0%
Mean travel time to work (commute): 32.9 minutes
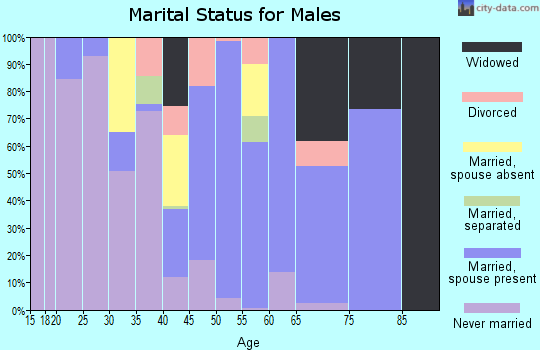
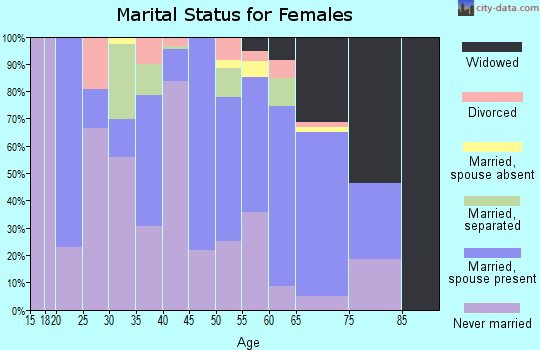
For population 15 years and over in 28453:
Never married: 35.6%
Now married: 53.4%
Separated: 2.2%
Widowed: 3.9%
Divorced: 4.9%
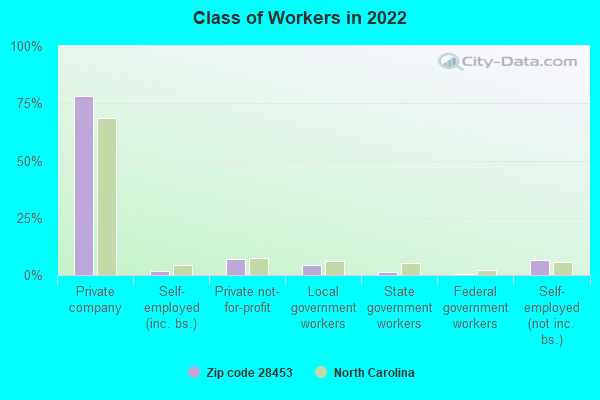
Zip code 28453 compared to state average:
Median household income below state average.
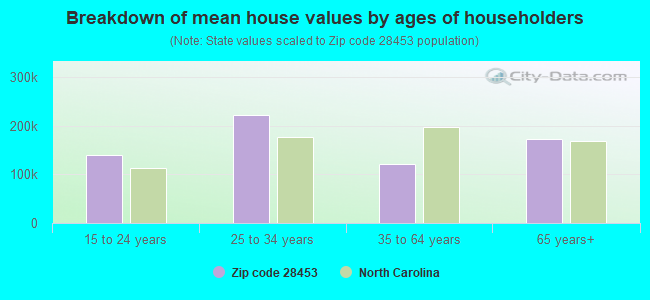
Median house value significantly below state average.
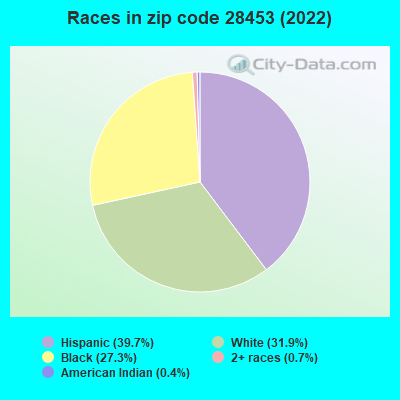
Hispanic race population percentage significantly above state average.
Median age significantly below state average.
Foreign-born population percentage significantly above state average.
Length of stay since moving in above state average.
Number of college students below state average.
Percentage of population with a bachelor's degree or higher below state average.
Averages for the 2020 tax year for zip code 28453, filed in 2021:
Average Adjusted Gross Income (AGI) in 2020: $38,887 (Individual Income Tax Returns)
Here:
$38,887
State:
$70,020
Salary/wage: $35,287 (reported on 83.2% of returns)
Here:
$35,287
State:
$58,387
(% of AGI for various income ranges: 1432.9% for AGIs below $25k, 4357.9% for AGIs $25k-50k, 6830.8% for AGIs $50k-75k, 10922.0% for AGIs $75k-100k, 25256.7% for AGIs $100k-200k)
Taxable interest for individuals: $1,529 (reported on 14.1% of returns)
This zip code:
$1,529
North Carolina:
$1,479
(% of AGI for various income ranges: 3.1% for AGIs below $25k, 9.7% for AGIs $25k-50k, 7.7% for AGIs $50k-75k, 30.0% for AGIs $75k-100k, 826.7% for AGIs $100k-200k)
Ordinary dividends: $1,520 (reported on 3.4% of returns)
Here:
$1,520
State:
$7,888
(% of AGI for various income ranges: 5.9% for AGIs below $25k, 94.0% for AGIs $75k-100k)
Net capital gain/loss in AGI: +$1,175 (reported on 2.7% of returns)
Here:
+$1,175
State:
+$23,652
(% of AGI for various income ranges: 2.4% for AGIs below $25k, 70.0% for AGIs $75k-100k)
Profit/loss from business: +$8,358 (reported on 16.1% of returns)
Here:
+$8,358
State:
+$11,710
(% of AGI for various income ranges: 226.7% for AGIs below $25k, 138.2% for AGIs $25k-50k, 326.9% for AGIs $50k-75k)
Taxable individual retirement arrangement distribution: $6,950 (reported on 2.7% of returns)
28453:
$6,950
North Carolina:
$20,247
(% of AGI for various income ranges: 81.8% for AGIs $25k-50k)
Total itemized deductions: $36,200 (reported on 1.3% of returns)
Here:
$36,200
State:
$34,549
(% of AGI for various income ranges: 212.9% for AGIs $25k-50k)
Charity contributions: $16,450 (reported on 1.3% of returns)
Here:
$16,450
State:
$13,360
(% of AGI for various income ranges: 96.8% for AGIs $25k-50k)
Taxes paid: $6,900 (reported on 1.3% of returns)
28453:
$6,900
State:
$7,586
(% of AGI for various income ranges: 40.6% for AGIs $25k-50k)
Earned income credit: $3,050 (reported on 30.9% of returns)
Here:
$3,050
State:
$2,337
(% of AGI for various income ranges: 205.7% for AGIs below $25k, 116.2% for AGIs $25k-50k)
Percentage of individuals using paid preparers for their 2020 taxes: 91.3%
Here:
91%
State:
93%
(% for various income ranges: 89.6% for AGIs below $25k, 91.7% for AGIs $25k-50k, 94.7% for AGIs $50k-75k, 87.5% for AGIs $75k-100k, 100.0% for AGIs $100k-200k)
Averages for the 2012 tax year for zip code 28453, filed in 2013:
Average Adjusted Gross Income (AGI) in 2012: $28,951 (Individual Income Tax Returns)
Here:
$28,951
State:
$54,937
Salary/wage: $26,103 (reported on 89.2% of returns)
Here:
$26,103
State:
$46,336
(% of AGI for various income ranges: 80.7% for AGIs below $25k, 89.8% for AGIs $25k-50k, 73.1% for AGIs $50k-75k, 77.8% for AGIs $75k-100k, 51.4% for AGIs $100k-200k)
Taxable interest for individuals: $477 (reported on 13.3% of returns)
This zip code:
$477
North Carolina:
$1,298
(% of AGI for various income ranges: 0.1% for AGIs below $25k, 0.2% for AGIs $25k-50k, 0.6% for AGIs $50k-75k, 0.3% for AGIs $75k-100k)
Ordinary dividends: $360 (reported on 3.0% of returns)
Here:
$360
State:
$6,213
Net capital gain/loss in AGI: +$4,750 (reported on 2.4% of returns)
Here:
+$4,750
State:
+$12,740
Profit/loss from business: +$8,409 (reported on 13.3% of returns)
Here:
+$8,409
State:
+$10,311
(% of AGI for various income ranges: 9.3% for AGIs below $25k, 2.4% for AGIs $25k-50k, 2.7% for AGIs $50k-75k)
Taxable individual retirement arrangement distribution: $7,650 (reported on 2.4% of returns)
28453:
$7,650
North Carolina:
$15,575
Total itemized deductions: $16,506 (27% of AGI, reported on 10.8% of returns)
Here:
$16,506
State:
$23,438
Here:
27.3% of AGI
State:
21.5% of AGI
(% of AGI for various income ranges: 6.0% for AGIs $25k-50k, 12.3% for AGIs $50k-75k, 10.7% for AGIs $75k-100k, 10.7% for AGIs $100k-200k)
Charity contributions: $4,464 (reported on 8.4% of returns)
Here:
$4,464
State:
$4,687
(% of AGI for various income ranges: 0.9% for AGIs $25k-50k, 4.2% for AGIs $50k-75k, 3.2% for AGIs $100k-200k)
Taxes paid: $4,500 (reported on 10.2% of returns)
28453:
$4,500
State:
$8,823
(% of AGI for various income ranges: 1.1% for AGIs $25k-50k, 3.1% for AGIs $50k-75k, 3.7% for AGIs $75k-100k, 4.0% for AGIs $100k-200k)
Earned income credit: $2,797 (reported on 34.9% of returns)
Here:
$2,797
State:
$2,376
(% of AGI for various income ranges: 10.1% for AGIs below $25k, 1.7% for AGIs $25k-50k)
Percentage of individuals using paid preparers for their 2012 taxes: 62.7%
Here:
63%
State:
53%
(% for various income ranges: 66.7% for AGIs below $25k, 54.2% for AGIs $25k-50k, 66.7% for AGIs $50k-75k, 60.0% for AGIs $75k-100k, 100.0% for AGIs $100k-200k)
Averages for the 2004 tax year for zip code 28453, filed in 2005:
Average Adjusted Gross Income (AGI) in 2004: $23,539 (Individual Income Tax Returns)
Here:
$23,539
State:
$45,376
Salary/wage: $23,198 (reported on 86.8% of returns)
Here:
$23,198
State:
$39,442
(% of AGI for various income ranges: 161.9% for AGIs below $10k, 88.1% for AGIs $10k-25k, 87.1% for AGIs $25k-50k, 78.2% for AGIs $50k-75k, 82.9% for AGIs $75k-100k, 54.9% for AGIs over 100k)
Taxable interest for individuals: $876 (reported on 17.7% of returns)
This zip code:
$876
North Carolina:
$1,515
(% of AGI for various income ranges: 6.0% for AGIs below $10k, 0.4% for AGIs $10k-25k, 0.3% for AGIs $25k-50k, 0.8% for AGIs $50k-75k, 0.2% for AGIs $75k-100k, 2.0% for AGIs over 100k)
Taxable dividends: $1,918 (reported on 4.6% of returns)
Here:
$1,918
State:
$4,016
(% of AGI for various income ranges: 4.7% for AGIs below $10k, 0.0% for AGIs $10k-25k, 0.0% for AGIs $25k-50k, 0.2% for AGIs $50k-75k, 3.8% for AGIs $75k-100k)
Net capital gain/loss: +$19,456 (reported on 4.3% of returns)
Here:
+$19,456
State:
+$11,152
(% of AGI for various income ranges: -1.6% for AGIs below $10k, 0.4% for AGIs $10k-25k, -0.1% for AGIs $25k-50k, 20.5% for AGIs $50k-75k)
Profit/loss from business: +$2,959 (reported on 13.1% of returns)
Here:
+$2,959
State:
+$9,490
(% of AGI for various income ranges: -2.0% for AGIs below $10k, 3.6% for AGIs $10k-25k, 1.5% for AGIs $25k-50k, -0.2% for AGIs $50k-75k)
Profit/loss from farming: +$3,278 (reported on 2.7% of returns)
Here:
+$3,278
State:
-$3,231
Total itemized deductions: $14,313 (31% of AGI, reported on 16.3% of returns)
Here:
$14,313
State:
$19,464
Here:
30.6% of AGI
State:
22.7% of AGI
(% of AGI for various income ranges: 6.6% for AGIs $10k-25k, 10.0% for AGIs $25k-50k, 13.6% for AGIs $50k-75k, 13.5% for AGIs $75k-100k, 16.5% for AGIs over 100k)
Charity contributions deductions: $3,532 (8% of AGI, reported on 14.1% of returns)
Here:
$3,532
State:
$4,035
Here:
7.6% of AGI
State:
4.5% of AGI
(% of AGI for various income ranges: 1.1% for AGIs $10k-25k, 2.1% for AGIs $25k-50k, 3.0% for AGIs $50k-75k, 7.6% for AGIs $75k-100k)
Total tax: $2,717 (reported on 48.6% of returns)
28453:
$2,717
State:
$7,257
(% of AGI for various income ranges: 4.9% for AGIs below $10k, 2.2% for AGIs $10k-25k, 5.0% for AGIs $25k-50k, 8.8% for AGIs $50k-75k, 10.8% for AGIs $75k-100k, 13.5% for AGIs over 100k)
Earned income credit: $2,308 (reported on 41.0% of returns)
Here:
$2,308
State:
$1,851
Percentage of individuals using paid preparers for their 2004 taxes: 71.2%
Here:
71%
State:
62%
(% for various income ranges: 67.6% for AGIs below $10k, 70.7% for AGIs $10k-25k, 73.9% for AGIs $25k-50k, 75.3% for AGIs $50k-75k, 68.2% for AGIs $75k-100k, 83.3% for AGIs over 100k)
Household received Food Stamps/SNAP in the past 12 months: 475 Household did not receive Food Stamps/SNAP in the past 12 months: 956
Women who had a birth in the past 12 months: 85 (4 now married, 76 unmarried) Women who did not have a birth in the past 12 months: 797 (429 now married, 369 unmarried)
Housing units in zip code 28453 with a mortgage: 434 (26 second mortgage, 27 both second mortgage and home equity loan) Houses without a mortgage: 91
Median monthly owner costs for units with a mortgage: $1,186 Median monthly owner costs for units without a mortgage: $419
Residents with income below the poverty level in 2022:
This zip code:
20.4%
Whole state:
12.8%
Residents with income below 50% of the poverty level in 2022:
This zip code:
11.0%
Whole state:
6.8%
Median number of rooms in houses and condos:
Here:
5.4
State:
6.4
Median number of rooms in apartments:
Here:
5.1
State:
4.4
Notable locations in this zip code not listed on our city pages
Churches in zip code 28453 include: Trinity Church (A), Bethel Church (B), Betholite Church (C), Mount Zion Church (D), Elders Chapel (E), Dobson Chapel (F), Saint Peter Church (G), Carroll Street Pentecostal Free Will Baptist Church (H), New Bethel Church (I). Display/hide their locations on the map
Cemeteries: Merritt Cemetery (1), Rose Hill Cemetery (2), Snipes Cemetery (3), Merritt Memorial Cemetery (4), Carter Cemetery (5), Watson Cemetery (6), Merritt Cemetery (7). Display/hide their locations on the map
In group quarters: 10 (-1 institutionalized population)
Size of family households: 282 2-persons, 321 3-persons, 236 4-persons, 62 5-persons, 44 6-persons, 31 7-or-more-persons
Size of nonfamily households: 393 1-person, 21 2-persons, 4 3-persons
447 married couples with children.
553 single-parent households (88 men, 465 women).
61.0% of residents of 28453 zip code speak English at home.
39.4% of residents speak Spanish at home (33% very well, 25% well, 27% not well, 15% not at all).
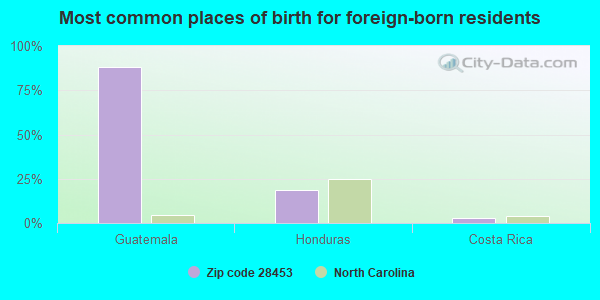
Foreign born population: 716 (19.7%) (4.0% of them are naturalized citizens)
This zip code:
19.7%
Whole state:
8.6%
88%Guatemala
18%Honduras
3%Costa Rica
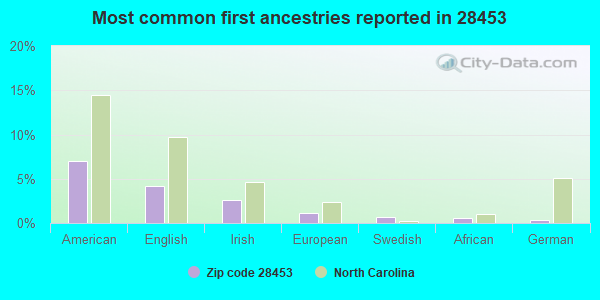
7%American
4%English
3%Irish
1%European
1%Swedish
1%African
0%German
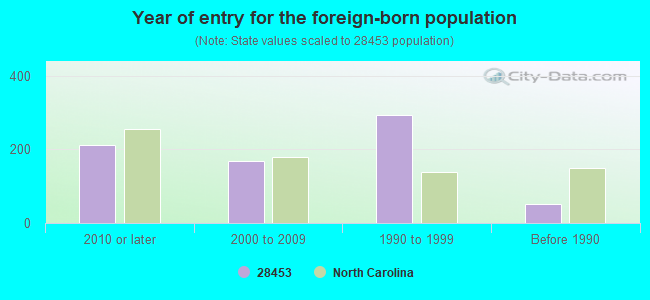
Year of entry for the foreign-born population
2112010 or later
1672000 to 2009
2931990 to 1999
52Before 1990
Facilities with environmental interests located in this zip code:
ABS FAMILY FARMS, INC. (1587 S NC HIGHWAY 50 in MAGNOLIA, NC)
National Pollutant Discharge Elimination System NON-MAJOR (Tracking pollutant discharge elimination systems) - permit
BOWLES & SONS FARM INC #3 - FO (1552 DOBSON CHAPEL RD in MAGNOLIA, NC)
National Pollutant Discharge Elimination System NON-MAJOR (Tracking pollutant discharge elimination systems) - permit
BOWLES & SONS FARM INC FARM 2 (1552 DOBSON CHAPEL RD in MAGNOLIA, NC)
National Pollutant Discharge Elimination System NON-MAJOR (Tracking pollutant discharge elimination systems) - permit
CIRCLE K FARM I & II (260 CIRCLE K II LN in MAGNOLIA, NC)
National Pollutant Discharge Elimination System NON-MAJOR (Tracking pollutant discharge elimination systems) - permit
Housing units lacking complete kitchen facilities: 3.6%
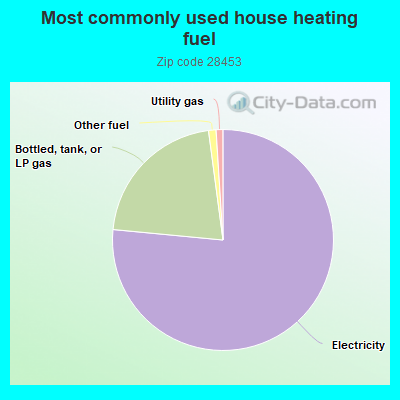
76.6%Electricity
21.4%Bottled, tank, or LP gas
1.1%Other fuel
1.0%Utility gas
Population in 1990: 2,056. Population change in the 1990s: +1,388 (+67.5%).
Place of birth for U.S.-born residents:
This state: 2,694
Northeast: 53
Midwest: 22
South: 80
West: 10
62% of the 28453 zip code residents lived in the same house 5 years ago. Out of people who lived in different houses, 73% lived in this county. Out of people who lived in different counties, 50% lived in North Carolina.
91% of the 28453 zip code residents lived in the same house 1 year ago. Out of people who lived in different houses, 61% moved from this county. Out of people who lived in different houses, 31% moved from different county within same state. Out of people who lived in different houses, 0% moved from different state. Out of people who lived in different houses, 3% moved from abroad.
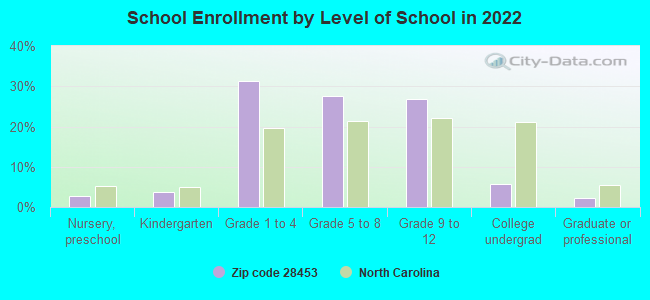
Private vs. public school enrollment:
Students in private schools in grades 1 to 8 (elementary and middle school): 23
Here:
5.5%
North Carolina:
13.8%
Students in private schools in grades 9 to 12 (high school):
Here:
0.0%
North Carolina:
11.9%
Students in private undergraduate colleges: 1
Here:
4.7%
North Carolina:
19.3%
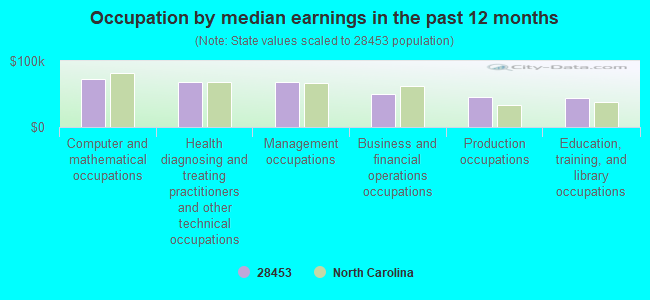
Occupation by median earnings in the past 12 months ($)
73,159Computer and mathematical occupations
68,840Health diagnosing and treating practitioners and other technical occupations
67,506Management occupations
50,652Business and financial operations occupations
45,575Production occupations
44,150Education, training, and library occupations
Top industries in this zip code by the number of employees in 2005:
Health Care and Social Assistance: Ambulance Services (50-99 employees: 1 establishment)
Construction: Plumbing, Heating, and Air-Conditioning Contractors (5-9: 1, 1-4: 1)
Arts, Entertainment, and Recreation: Golf Courses and Country Clubs (5-9: 1)
Other Services (except Public Administration): Commercial and Industrial Machinery and Equipment (except Automotive and Electronic) Repair and Maintenance (5-9: 1)
Administrative and Support and Waste Management and Remediation Services: Other Services to Buildings and Dwellings (5-9: 1)
People in group quarters in 2010:
6 people in group homes intended for adults
People in group quarters in 2000:
7 people in homes for the mentally retarded
3 people in homes for the mentally ill
Fatal accident statistics in 2010:
Fatal accident count: 1
Vehicles involved in fatal accidents: 2
Fatal accidents caused by drunken drivers: 0
Fatalities: 1
Persons involved in fatal accidents: 2
Pedestrians involved in fatal accidents: 0
2002 - 2018 National Fire Incident Reporting System (NFIRS) incidents
Based on the data from the years 2002 - 2018 the average number of fire incidents per year is 26. The highest number of reported fire incidents - 53 took place in 2007, and the least - 7 in 2017. The data has a declining trend.
When looking into fire subcategories, the most reports belonged to: Structure Fires (41.0%), and Outside Fires (34.3%).
Fire incident types reported to NFIRS in Zip Code 28453


+$3,278
-$3,231
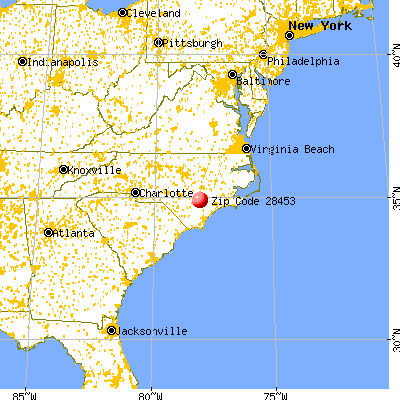
 Nearest zip codes: 28458, 28398, 28464, 28393, 28349, 28478.


 Based on the data from the years 2002 - 2018 the average number of fire incidents per year is 26. The highest number of reported fire incidents - 53 took place in 2007, and the least - 7 in 2017. The data has a declining trend.
 When looking into fire subcategories, the most reports belonged to: Structure Fires (41.0%), and Outside Fires (34.3%).