Estimated zip code population in 2022: 18,091 Zip code population in 2010: 16,491 Zip code population in 2000: 12,083
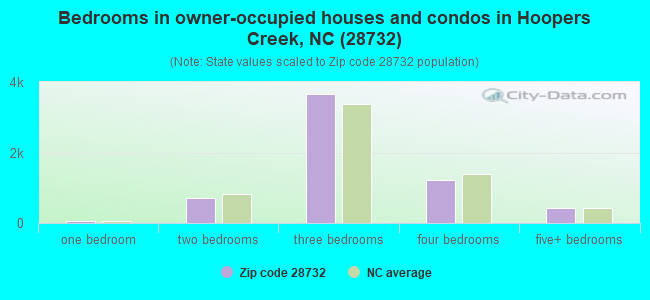
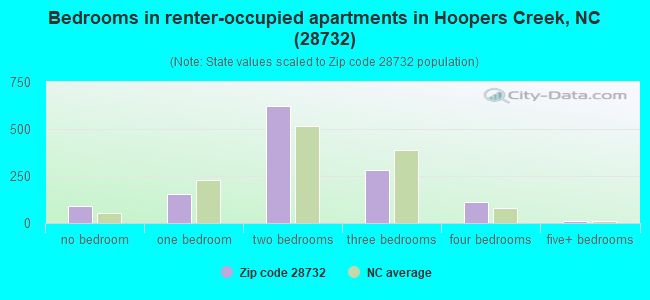
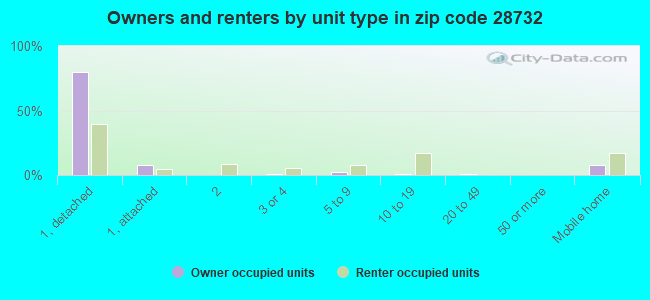
Houses and condos: 8,260 Renter-occupied apartments: 1,269
% of renters here:
17%
State:
33%
March 2022 cost of living index in zip code 28732: 91.5 (less than average, U.S. average is 100)
Land area: 42.7 sq. mi. Water area: 0.2 sq. mi.
Population density: 424 people per square mile
(low).
OSM Map
General Map
Google Map
MSN Map
OSM Map
General Map
Google Map
MSN Map
OSM Map
General Map
Google Map
MSN Map
OSM Map
General Map
Google Map
MSN Map
Please wait while loading the map...
Real estate property taxes paid for housing units in 2022:
This zip code:
0.5% ($1,839)
North Carolina:
0.6% ($1,769)
Median real estate property taxes paid for housing units with mortgages in 2022: $1,855 (0.5%) Median real estate property taxes paid for housing units with no mortgage in 2022: $1,778 (0.5%)
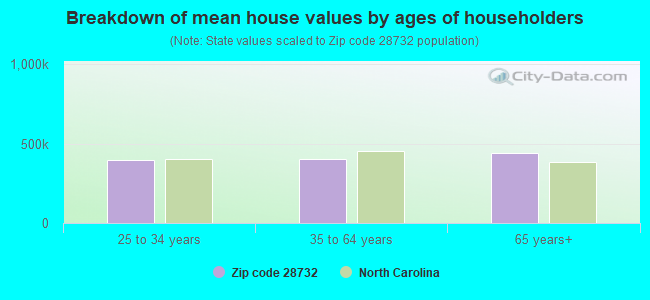
Estimated median house/condo value in 2022: $379,748
28732:
$379,748
North Carolina:
$280,600
According to our research of North Carolina and other state lists, there were 29 registered sex offenders living in 28732 zip code as of April 17, 2024. The ratio of all residents to sex offenders in zip code 28732 is 606 to 1. The ratio of registered sex offenders to all residents in this zip code is near the state average.
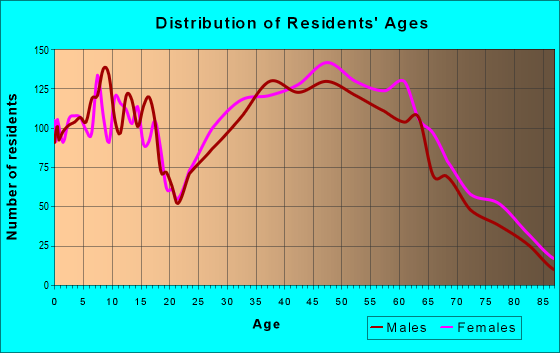
Median resident age:
This zip code:
44.0 years
North Carolina median age:
39.2 years
Average household size:
This zip code:
2.4 people
North Carolina:
2.4 people
Averages for the 2020 tax year for zip code 28732, filed in 2021:
Average Adjusted Gross Income (AGI) in 2020: $85,863 (Individual Income Tax Returns)
Here:
$85,863
State:
$70,020
Salary/wage: $70,626 (reported on 80.6% of returns)
Here:
$70,626
State:
$58,387
(% of AGI for various income ranges: 1146.7% for AGIs below $25k, 3640.6% for AGIs $25k-50k, 6578.1% for AGIs $50k-75k, 9499.6% for AGIs $75k-100k, 17621.0% for AGIs $100k-200k, 106203.7% for AGIs over 200k)
Taxable interest for individuals: $1,481 (reported on 36.7% of returns)
This zip code:
$1,481
North Carolina:
$1,479
(% of AGI for various income ranges: 19.1% for AGIs below $25k, 29.0% for AGIs $25k-50k, 42.4% for AGIs $50k-75k, 69.6% for AGIs $75k-100k, 118.4% for AGIs $100k-200k, 1460.0% for AGIs over 200k)
Ordinary dividends: $5,733 (reported on 21.7% of returns)
Here:
$5,733
State:
$7,888
(% of AGI for various income ranges: 38.1% for AGIs below $25k, 57.2% for AGIs $25k-50k, 92.0% for AGIs $50k-75k, 213.5% for AGIs $75k-100k, 334.9% for AGIs $100k-200k, 2963.8% for AGIs over 200k)
Net capital gain/loss in AGI: +$17,107 (reported on 19.7% of returns)
Here:
+$17,107
State:
+$23,652
(% of AGI for various income ranges: 18.2% for AGIs below $25k, 39.0% for AGIs $25k-50k, 79.5% for AGIs $50k-75k, 243.2% for AGIs $75k-100k, 824.6% for AGIs $100k-200k, 13140.6% for AGIs over 200k)
Profit/loss from business: +$18,268 (reported on 17.8% of returns)
Here:
+$18,268
State:
+$11,710
(% of AGI for various income ranges: 160.5% for AGIs below $25k, 218.3% for AGIs $25k-50k, 278.3% for AGIs $50k-75k, 460.7% for AGIs $75k-100k, 683.0% for AGIs $100k-200k, 7573.1% for AGIs over 200k)
Taxable individual retirement arrangement distribution: $19,161 (reported on 10.8% of returns)
28732:
$19,161
North Carolina:
$20,247
(% of AGI for various income ranges: 97.0% for AGIs below $25k, 135.3% for AGIs $25k-50k, 218.9% for AGIs $50k-75k, 589.6% for AGIs $75k-100k, 835.8% for AGIs $100k-200k, 1276.2% for AGIs over 200k)
Self-employed (Keogh) retirement plans: $23,880 (reported on 0.5% of returns)
28732:
$23,880
North Carolina:
$26,749
(% of AGI for various income ranges: 28.1% for AGIs $50k-75k, 568.8% for AGIs over 200k)
Total itemized deductions: $35,676 (reported on 10.7% of returns)
Here:
$35,676
State:
$34,549
(% of AGI for various income ranges: 79.2% for AGIs below $25k, 124.5% for AGIs $25k-50k, 298.9% for AGIs $50k-75k, 480.9% for AGIs $75k-100k, 1143.5% for AGIs $100k-200k, 10047.5% for AGIs over 200k)
Charity contributions: $15,488 (reported on 8.6% of returns)
Here:
$15,488
State:
$13,360
(% of AGI for various income ranges: 5.0% for AGIs below $25k, 21.4% for AGIs $25k-50k, 60.3% for AGIs $50k-75k, 101.6% for AGIs $75k-100k, 329.9% for AGIs $100k-200k, 4940.6% for AGIs over 200k)
Taxes paid: $7,264 (reported on 10.5% of returns)
28732:
$7,264
State:
$7,586
(% of AGI for various income ranges: 9.0% for AGIs below $25k, 24.0% for AGIs $25k-50k, 59.6% for AGIs $50k-75k, 107.8% for AGIs $75k-100k, 312.9% for AGIs $100k-200k, 1595.6% for AGIs over 200k)
Earned income credit: $1,971 (reported on 11.3% of returns)
Here:
$1,971
State:
$2,337
(% of AGI for various income ranges: 66.0% for AGIs below $25k, 55.5% for AGIs $25k-50k, 1.1% for AGIs $50k-75k)
Percentage of individuals using paid preparers for their 2020 taxes: 93.3%
Here:
93%
State:
93%
(% for various income ranges: 91.5% for AGIs below $25k, 93.5% for AGIs $25k-50k, 94.4% for AGIs $50k-75k, 93.4% for AGIs $75k-100k, 93.9% for AGIs $100k-200k, 96.2% for AGIs over 200k)
Averages for the 2012 tax year for zip code 28732, filed in 2013:
Average Adjusted Gross Income (AGI) in 2012: $58,576 (Individual Income Tax Returns)
Here:
$58,576
State:
$54,937
Salary/wage: $50,101 (reported on 84.3% of returns)
Here:
$50,101
State:
$46,336
(% of AGI for various income ranges: 71.1% for AGIs below $25k, 78.4% for AGIs $25k-50k, 79.2% for AGIs $50k-75k, 79.0% for AGIs $75k-100k, 76.5% for AGIs $100k-200k, 49.8% for AGIs over 200k)
Taxable interest for individuals: $1,253 (reported on 38.2% of returns)
This zip code:
$1,253
North Carolina:
$1,298
(% of AGI for various income ranges: 1.2% for AGIs below $25k, 0.8% for AGIs $25k-50k, 0.4% for AGIs $50k-75k, 0.7% for AGIs $75k-100k, 0.8% for AGIs $100k-200k, 1.1% for AGIs over 200k)
Ordinary dividends: $4,940 (reported on 19.0% of returns)
Here:
$4,940
State:
$6,213
(% of AGI for various income ranges: 1.5% for AGIs below $25k, 1.2% for AGIs $25k-50k, 0.9% for AGIs $50k-75k, 1.1% for AGIs $75k-100k, 1.4% for AGIs $100k-200k, 3.2% for AGIs over 200k)
Net capital gain/loss in AGI: +$12,019 (reported on 15.5% of returns)
Here:
+$12,019
State:
+$12,740
(% of AGI for various income ranges: 0.3% for AGIs $25k-50k, 0.6% for AGIs $50k-75k, 0.2% for AGIs $75k-100k, 1.7% for AGIs $100k-200k, 13.5% for AGIs over 200k)
Profit/loss from business: +$10,507 (reported on 16.5% of returns)
Here:
+$10,507
State:
+$10,311
(% of AGI for various income ranges: 8.5% for AGIs below $25k, 3.6% for AGIs $25k-50k, 2.7% for AGIs $50k-75k, 2.3% for AGIs $75k-100k, 3.0% for AGIs $100k-200k, 1.1% for AGIs over 200k)
Taxable individual retirement arrangement distribution: $15,138 (reported on 11.3% of returns)
28732:
$15,138
North Carolina:
$15,575
(% of AGI for various income ranges: 4.9% for AGIs below $25k, 2.7% for AGIs $25k-50k, 2.9% for AGIs $50k-75k, 2.4% for AGIs $75k-100k, 3.5% for AGIs $100k-200k, 2.0% for AGIs over 200k)
Self-employment retirement plans: $16,567 (reported on 0.4% of returns)
28732:
$16,567
North Carolina:
$21,078
Total itemized deductions: $21,892 (22% of AGI, reported on 41.8% of returns)
Here:
$21,892
State:
$23,438
Here:
22.4% of AGI
State:
21.5% of AGI
(% of AGI for various income ranges: 12.2% for AGIs below $25k, 13.7% for AGIs $25k-50k, 16.5% for AGIs $50k-75k, 16.9% for AGIs $75k-100k, 17.0% for AGIs $100k-200k, 14.8% for AGIs over 200k)
Charity contributions: $4,192 (reported on 35.1% of returns)
Here:
$4,192
State:
$4,687
(% of AGI for various income ranges: 1.4% for AGIs below $25k, 1.6% for AGIs $25k-50k, 2.5% for AGIs $50k-75k, 2.5% for AGIs $75k-100k, 2.7% for AGIs $100k-200k, 3.5% for AGIs over 200k)
Taxes paid: $7,304 (reported on 41.8% of returns)
28732:
$7,304
State:
$8,823
(% of AGI for various income ranges: 1.9% for AGIs below $25k, 3.1% for AGIs $25k-50k, 4.6% for AGIs $50k-75k, 5.6% for AGIs $75k-100k, 6.7% for AGIs $100k-200k, 6.4% for AGIs over 200k)
Earned income credit: $2,052 (reported on 14.2% of returns)
Here:
$2,052
State:
$2,376
(% of AGI for various income ranges: 5.0% for AGIs below $25k, 0.9% for AGIs $25k-50k)
Percentage of individuals using paid preparers for their 2012 taxes: 48.6%
Here:
49%
State:
53%
(% for various income ranges: 43.7% for AGIs below $25k, 46.8% for AGIs $25k-50k, 51.6% for AGIs $50k-75k, 51.2% for AGIs $75k-100k, 54.1% for AGIs $100k-200k, 76.2% for AGIs over 200k)
Averages for the 2004 tax year for zip code 28732, filed in 2005:
Average Adjusted Gross Income (AGI) in 2004: $52,093 (Individual Income Tax Returns)
Here:
$52,093
State:
$45,376
Salary/wage: $44,161 (reported on 85.2% of returns)
Here:
$44,161
State:
$39,442
(% of AGI for various income ranges: 102.5% for AGIs below $10k, 75.8% for AGIs $10k-25k, 78.8% for AGIs $25k-50k, 83.1% for AGIs $50k-75k, 84.0% for AGIs $75k-100k, 56.6% for AGIs over 100k)
Taxable interest for individuals: $1,118 (reported on 48.1% of returns)
This zip code:
$1,118
North Carolina:
$1,515
(% of AGI for various income ranges: 3.9% for AGIs below $10k, 2.1% for AGIs $10k-25k, 1.0% for AGIs $25k-50k, 0.7% for AGIs $50k-75k, 0.6% for AGIs $75k-100k, 1.1% for AGIs over 100k)
Taxable dividends: $2,431 (reported on 25.1% of returns)
Here:
$2,431
State:
$4,016
(% of AGI for various income ranges: 5.1% for AGIs below $10k, 1.7% for AGIs $10k-25k, 1.0% for AGIs $25k-50k, 0.9% for AGIs $50k-75k, 0.5% for AGIs $75k-100k, 1.4% for AGIs over 100k)
Net capital gain/loss: +$11,544 (reported on 20.0% of returns)
Here:
+$11,544
State:
+$11,152
(% of AGI for various income ranges: 0.5% for AGIs below $10k, 0.4% for AGIs $10k-25k, 0.8% for AGIs $25k-50k, 0.9% for AGIs $50k-75k, 2.1% for AGIs $75k-100k, 9.9% for AGIs over 100k)
Profit/loss from business: +$9,649 (reported on 17.5% of returns)
Here:
+$9,649
State:
+$9,490
(% of AGI for various income ranges: 1.8% for AGIs below $10k, 5.9% for AGIs $10k-25k, 4.5% for AGIs $25k-50k, 2.8% for AGIs $50k-75k, 2.2% for AGIs $75k-100k, 2.9% for AGIs over 100k)
IRA payment deduction: $3,022 (reported on 2.9% of returns)
28732:
$3,022
North Carolina:
$2,967
(% of AGI for various income ranges: 0.2% for AGIs $10k-25k, 0.2% for AGIs $25k-50k, 0.2% for AGIs $50k-75k, 0.1% for AGIs $75k-100k, 0.1% for AGIs over 100k)
Self-employed pension: $11,634 (reported on 0.6% of returns)
Here:
$11,634
North Carolina:
$14,754
Total itemized deductions: $18,450 (23% of AGI, reported on 44.8% of returns)
Here:
$18,450
State:
$19,464
Here:
23.4% of AGI
State:
22.7% of AGI
(% of AGI for various income ranges: 20.0% for AGIs below $10k, 13.7% for AGIs $10k-25k, 15.4% for AGIs $25k-50k, 17.5% for AGIs $50k-75k, 19.1% for AGIs $75k-100k, 14.1% for AGIs over 100k)
Charity contributions deductions: $3,642 (4% of AGI, reported on 39.1% of returns)
Here:
$3,642
State:
$4,035
Here:
4.5% of AGI
State:
4.5% of AGI
(% of AGI for various income ranges: 1.5% for AGIs below $10k, 2.0% for AGIs $10k-25k, 2.3% for AGIs $25k-50k, 2.8% for AGIs $50k-75k, 3.5% for AGIs $75k-100k, 2.7% for AGIs over 100k)
Total tax: $7,002 (reported on 79.5% of returns)
28732:
$7,002
State:
$7,257
(% of AGI for various income ranges: 3.5% for AGIs below $10k, 4.3% for AGIs $10k-25k, 7.1% for AGIs $25k-50k, 8.4% for AGIs $50k-75k, 9.8% for AGIs $75k-100k, 15.4% for AGIs over 100k)
Earned income credit: $1,728 (reported on 11.3% of returns)
Here:
$1,728
State:
$1,851
Percentage of individuals using paid preparers for their 2004 taxes: 56.4%
Here:
56%
State:
62%
(% for various income ranges: 52.0% for AGIs below $10k, 57.8% for AGIs $10k-25k, 56.1% for AGIs $25k-50k, 56.5% for AGIs $50k-75k, 55.6% for AGIs $75k-100k, 62.6% for AGIs over 100k)
Likely homosexual households (counted as self-reported same-sex unmarried-partner households)
Lesbian couples: 0.2% of all households
Gay men: 0.1% of all households
Household received Food Stamps/SNAP in the past 12 months: 352 Household did not receive Food Stamps/SNAP in the past 12 months: 6,923
Women who had a birth in the past 12 months: 246 (252 now married, 0 unmarried) Women who did not have a birth in the past 12 months: 3,681 (1,973 now married, 1,716 unmarried)
Housing units in zip code 28732 with a mortgage: 3,849 (371 second mortgage, 376 both second mortgage and home equity loan) Houses without a mortgage: 122
Median monthly owner costs for units with a mortgage: $1,545 Median monthly owner costs for units without a mortgage: $444
Residents with income below the poverty level in 2022:
This zip code:
6.8%
Whole state:
12.8%
Residents with income below 50% of the poverty level in 2022:
This zip code:
5.0%
Whole state:
6.8%
Median number of rooms in houses and condos:
Here:
6.6
State:
6.4
Median number of rooms in apartments:
Here:
4.5
State:
4.4
Notable locations in this zip code not listed on our city pages
Churches in zip code 28732 include: Trinity Church (A), Tweed Chapel (B), Fanning Chapel (C), Calvary Church (D), Brickton Church (E), Boiling Springs Church (F), Oak Forest Church (G), Oak Grove Church (H), Old Salem Church (I). Display/hide their locations on the map
Streams, rivers, and creeks: Duncan Creek (A), Higgins Branch (B), Cushion Branch (C), Hoopers Creek (D), Brush Creek (E), Cane Creek (F), Merrill Cove Creek (G), Mills River (H), McDowell Creek (I). Display/hide their locations on the map
In group quarters: 189 (-1 institutionalized population)
Size of family households: 3,163 2-persons, 780 3-persons, 1,021 4-persons, 235 5-persons, 67 6-persons, 32 7-or-more-persons
Size of nonfamily households: 1,696 1-person, 337 2-persons, 7 4-persons
2,827 married couples with children.
347 single-parent households (57 men, 290 women).
93.3% of residents of 28732 zip code speak English at home.
3.5% of residents speak Spanish at home (75% very well, 17% well, 5% not well, 3% not at all).
1.3% of residents speak other Indo-European language at home (48% very well, 35% well, 7% not well, 10% not at all).
1.3% of residents speak Asian or Pacific Island language at home (6% very well, 41% well, 53% not well).
0.8% of residents speak other language at home (58% very well, 42% well).
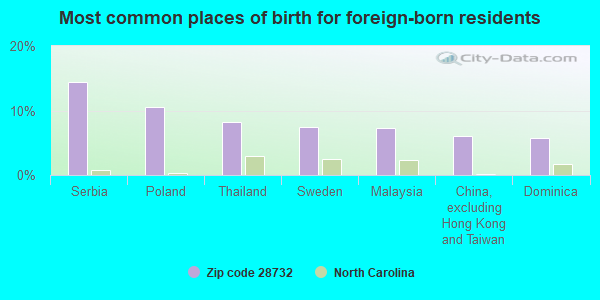
Foreign born population: 1,086 (6.0%) (66.6% of them are naturalized citizens)
This zip code:
6.0%
Whole state:
8.6%
14%Serbia
11%Poland
8%Thailand
7%Sweden
7%Malaysia
6%China, excluding Hong Kong and Taiwan
6%Dominica
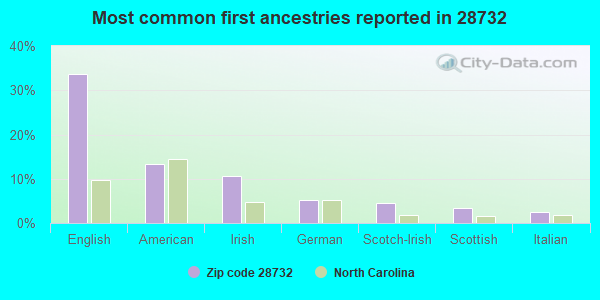
34%English
13%American
11%Irish
5%German
4%Scotch-Irish
3%Scottish
3%Italian
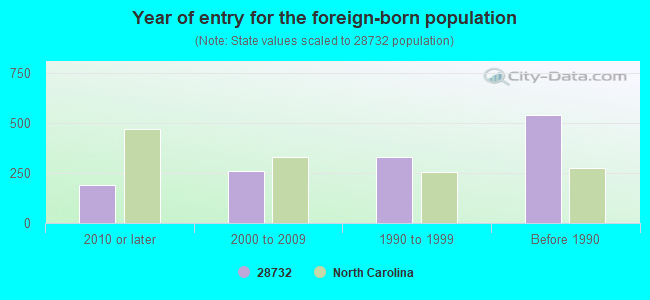
Year of entry for the foreign-born population
1922010 or later
2622000 to 2009
3301990 to 1999
539Before 1990
Facilities with environmental interests located in this zip code:
BLUE RIDGE METALS CORPORATION (180 MILLS GAP ROAD in FLETCHER, NC)
AIR SYNTHETIC MINOR (AIRS/AFS) STATE MASTER (North Carolina facility info) - -115DA4YG00M69W84AY3V0BPJSU, WASTEWATER FACILITY, -271, AIR PROGRAM National Pollutant Discharge Elimination System NON-MAJOR (Tracking pollutant discharge elimination systems) - permit HAZARDOUS WASTE BIENNIAL REPORTER (Resource Conservation and Recovery Act (tracking hazardous waste)) Large Quantity Generators, more that 1000 kg of hazardous waste/month (Resource Conservation and Recovery Act (tracking hazardous waste)) - notification TRI REPORTER (Tracking of toxic chemicals releasing facilities) Business SIC classification: COLD-ROLLED STEEL SHEET, STRIP, AND BARS; BOLTS, NUTS, SCREWS, RIVETS, AND WASHERS Business NAICS classification: OTHER FABRICATED WIRE PRODUCT MANUFACTURING. Organizations: ISAO YASHIDA (CONTACT/OWNER)
ARVINMERITOR INCORPORATED (1000 ROCKWELL DRIVE in FLETCHER, NC)
AIR MINOR (AIRS/AFS) STATE MASTER (North Carolina facility info) - -115DA4YG00V62W84DX0H0A4B5Q, WASTEWATER FACILITY, -268, AIR PROGRAM CRITERIA AND HAZARDOUS AIR POLLUTANT INVENTORY (Inventory of air pollution sources) National Pollutant Discharge Elimination System NON-MAJOR (Tracking pollutant discharge elimination systems) - permit Small Quantity Generators, between 100 kg and 1000 kg of hazardous waste/month (Resource Conservation and Recovery Act (tracking hazardous waste)) - notification TRI REPORTER (Tracking of toxic chemicals releasing facilities) Business SIC classification: MOTOR VEHICLE PARTS AND ACCESSORIES Business NAICS classification: ALL OTHER MISCELLANEOUS FABRICATED METAL PRODUCT MANUFACTURING. Organizations: MERITOR HEAVY VEHICLE SYSTEMS LLC (CONTACT/OWNER)
Alternative names: ARVIN MERITOR INC, MERITOR HEAVY VEHICLE SYS. L.L.C., MERITOR HEAVY VEHICLE SYSTEMS LLC
BORG-WARNER COOLING SYSTEMS CORPORATION (CANE CREEK INDUSTRIAL PARK in FLETCHER, NC)
AIR MINOR (AIRS/AFS) STATE MASTER (North Carolina facility info) - -115DA4YG00M69W84AY3V81T71G, WASTEWATER FACILITY Conditionally Exempt Small Quantity Generators, less than 100 kg/month of hazardous waste (Resource Conservation and Recovery Act (tracking hazardous waste)) - notification TRI REPORTER (Tracking of toxic chemicals releasing facilities) Business SIC classification: SPEED CHANGERS, INDUSTRIAL HIGH-SPEED DRIVES, AND GEARS; MOTOR VEHICLE PARTS AND ACCESSORIES Organizations: EATON CORP (CONTACT/OWNER)
Alternative names: BORG WARNER EMISSIONS/THERMAL SYSTEMS, BORGWARNER THERMAL SYSTEMS INC, EATON CORP., EATON CORP. - FLUID POWER DIV., EATON CORP FLUID POWER OP FLETCHER PLT
ABF FREIGHT SYSTEM INCORPORATED (MILLS GAP ROAD in FLETCHER, NC)
STATE MASTER (North Carolina facility info) - -115DA4YG00M29W84AX3X096R77, WASTEWATER FACILITY National Pollutant Discharge Elimination System NON-MAJOR (Tracking pollutant discharge elimination systems) - permit Business SIC classification: TRUCKING, EXCEPT LOCAL Alternative names: ABF FREIGHT SYSTEM INC-FLETCHE
ALLIANCE CORPORATION ALLIANCE (US HIGHWAY 25 in FLETCHER, NC)
STATE MASTER (North Carolina facility info) - UNDERGROUND STORAGE TANK PROGRAM Conditionally Exempt Small Quantity Generators, less than 100 kg/month of hazardous waste (Resource Conservation and Recovery Act (tracking hazardous waste)) - notification Business SIC classification: NONCLASSIFIABLE ESTABLISHMENTS Organizations: DANIEL WELCH (CONTACT/OWNER)
BOREN CLAY PRODUCTS (HWY 25 in FLETCHER, NC)
AIR SYNTHETIC MINOR (AIRS/AFS) STATE MASTER (North Carolina facility info) - UNDERGROUND STORAGE TANK PROGRAM, AIR PROGRAM, -66AN2CF000TASDA489NRG5S8E6, WASTEWATER FACILITY Business SIC classification: BRICK AND STRUCTURAL CLAY TILE; NONCLASSIFIABLE ESTABLISHMENTS
CANE CREEK MIDDLE (570 LOWER BRUSH CREEK ROAD in FLETCHER, NC)
(National Center for Education Statistics) - STATE ID-326 Organizations: BUNCOMBE COUNTY SCHOOLS (SCHOOL DISTRICT)
BOMBARDIER SERVICES CORP - AVL (1 AVIATION WAY in FLETCHER, NC)
BORG WARNER COOLING SYSTEMS (269 CANE CREEK ROAD in FLETCHER, NC)
National Pollutant Discharge Elimination System NON-MAJOR (Tracking pollutant discharge elimination systems) - permit Small Quantity Generators, between 100 kg and 1000 kg of hazardous waste/month (Resource Conservation and Recovery Act (tracking hazardous waste)) - notification Business SIC classification: MOTOR VEHICLE PARTS AND ACCESSORIES Organizations: BORG-WARNER AUTOMOTIVE TURBOS (CONTACT/OWNER)
Alternative names: BORG WARNER AUTOMOTIVE, INC., BORG-WARNER AUTOMOTIVE TURBOS
DIA-COMPE INC (CANE CREEK RD in FLETCHER, NC)
(Resource Conservation and Recovery Act (tracking hazardous waste)) Organizations: YOSHIGAI KIKAI KINZOKU CO LTD (CONTACT/OWNER)
CANE CREEK ELEMENTARY SCHOOL (570 LOWER BRUSH CREEK RD in FLETCHER, NC)
National Pollutant Discharge Elimination System NON-MAJOR (Tracking pollutant discharge elimination systems) - permit Business SIC classification: SEWERAGE SYSTEMS Alternative names: BUNCOMBE CO BOE CANE CRK ELEM, BUNCOMBE CO SCH/CANE CRK ELEM
ABF FREIGHT SYSTEMS INC (US HWY 25 in FLETCHER, NC)
Conditionally Exempt Small Quantity Generators, less than 100 kg/month of hazardous waste (Resource Conservation and Recovery Act (tracking hazardous waste)) - notification Organizations: ARKANSAS BEST CORPORATION (CONTACT/OWNER)
APPLE TREE HONDA (195 UNDERWOOD RD in FLETCHER, NC)
Small Quantity Generators, between 100 kg and 1000 kg of hazardous waste/month (Resource Conservation and Recovery Act (tracking hazardous waste)) - notification Organizations: KRAFTON LOCKE (CONTACT/OWNER)
Housing units lacking complete plumbing facilities: 1.6% Housing units lacking complete kitchen facilities: 0.8%
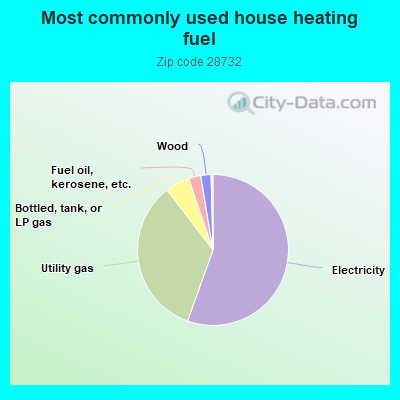
55.5%Electricity
34.1%Utility gas
5.2%Bottled, tank, or LP gas
2.6%Fuel oil, kerosene, etc.
2.2%Wood
Population in 1990: 7,201. Population change in the 1990s: +4,882 (+67.8%).
Place of birth for U.S.-born residents:
This state: 9,325
Northeast: 1,745
Midwest: 1,786
South: 3,198
West: 671
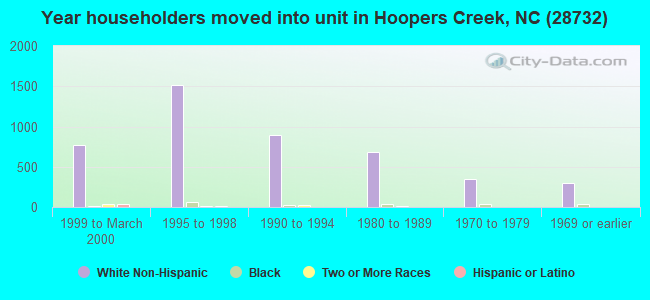
54% of the 28732 zip code residents lived in the same house 5 years ago. Out of people who lived in different houses, 38% lived in this county. Out of people who lived in different counties, 50% lived in North Carolina.
93% of the 28732 zip code residents lived in the same house 1 year ago. Out of people who lived in different houses, 29% moved from this county. Out of people who lived in different houses, 43% moved from different county within same state. Out of people who lived in different houses, 36% moved from different state.
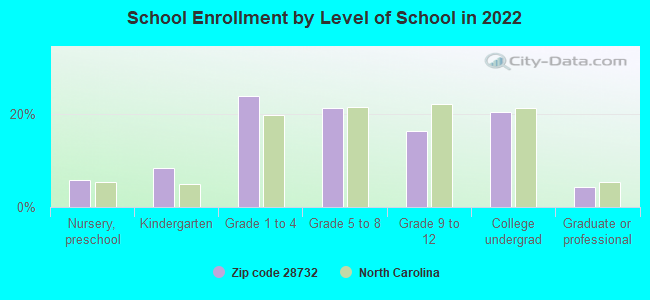
Private vs. public school enrollment:
Students in private schools in grades 1 to 8 (elementary and middle school): 553
Here:
34.7%
North Carolina:
13.8%
Students in private schools in grades 9 to 12 (high school): 144
Here:
25.2%
North Carolina:
11.9%
Students in private undergraduate colleges: 36
Here:
5.1%
North Carolina:
19.3%
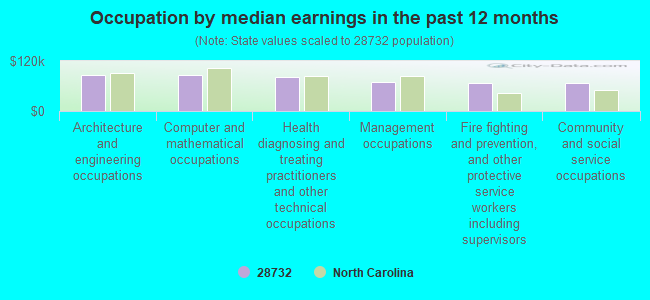
Occupation by median earnings in the past 12 months ($)
86,367Architecture and engineering occupations
85,520Computer and mathematical occupations
82,163Health diagnosing and treating practitioners and other technical occupations
70,183Management occupations
66,388Fire fighting and prevention, and other protective service workers including supervisors
66,242Community and social service occupations
Companies with federal contracts located in this zip code (FLETCHER, NC):
ASHEVILLE JET INC (1 AVIATION WAY; small business) : $3,398,273 in 6 contractsfrom 2000 to 2006
Contracts for Liquid Propellants and Fuels, Petroleum Base, Lease or Rental of Facilities -- Other Administrative Facilities and Service Buildings by Defense Logistics Agency, Air Force Signed by year:2000: $54,000; 2001: $0; 2002: $1,407,707; 2003: $0; 2004: $0; 2005: $1,911,566; 2006: $25,000.
Biggest contracts:
$1,886,566 with Defense Logistics Agency for Liquid Propellants and Fuels, Petroleum Base. Signed on 2005-03-16. Completion date: 2009-03-31.
$1,407,707, same as above.Signed on 2002-01-28. Completion date: 2005-03-31.
$27,000 with Air Force for Lease or Rental of Facilities -- Other Administrative Facilities and Service Buildings. Signed on 2000-12-14. Completion date: 2000-10-02.
$27,000, same as above.Signed on 2000-04-18. Completion date: 1999-10-01.
UNITED FINANCIAL OF NORTH CARO (58 WILKIE WAY; small business)
$57,220 with Air Force for Lease or Rental of Equipment -- Fire Fighting, Rescue, and Safety Equipment; and Environmental Protection Equipment and Materials. Signed on 2003-10-01. Completion date: 2005-09-30.
HULSING HOTELS INC (550 AIRPORT RD; small business) : $35,986 in 2 contractsfrom 2001 to 2005
$31,185 with Army for Lodging - Hotel/Motel. Signed on 2001-08-27. Completion date: 2001-09-26.
$4,801, same as above.Signed on 2005-09-13. Completion date: 2005-09-15.
CAMPEN, JIM TRAILER SALES, INC (US 25 S; small business) 15 employees, $4100000 revenue.
$4,000 with U.S. Fish and Wildlife Service for Trailers. Signed on 2001-10-15. Completion date: 2001-12-15.
Top industries in this zip code by the number of employees in 2005:
Health Care and Social Assistance: General Medical and Surgical Hospitals (500-999 employees: 1 establishment)
Accommodation and Food Services: Hotels (except Casino Hotels) and Motels (100-249: 1, 50-99: 1, 20-49: 1, 10-19: 1, 5-9: 1)
Educational Services: Elementary and Secondary Schools (100-249: 1, 50-99: 1)
Wholesale Trade: Other Grocery and Related Products Merchant Wholesalers (100-249: 1, 20-49: 1)
People in group quarters in 2010:
147 people in nursing facilities/skilled-nursing facilities
22 people in group homes intended for adults
8 people in workers' group living quarters and job corps centers
People in group quarters in 2000:
45 people in nursing homes
41 people in other noninstitutional group quarters
7 people in homes for the mentally retarded
Fatal accident statistics in 2014:
Fatal accident count: 1
Vehicles involved in fatal accidents: 1
Fatal accidents caused by drunken drivers: 0
Fatalities: 1
Persons involved in fatal accidents: 2
Pedestrians involved in fatal accidents: 1
Fatal accident statistics in 2013:
Fatal accident count: 2
Vehicles involved in fatal accidents: 3
Fatal accidents caused by drunken drivers: 0
Fatalities: 2
Persons involved in fatal accidents: 3
Pedestrians involved in fatal accidents: 3
Home Mortgage Disclosure Act Aggregated Statistics For Year 2009 (Based on 2 full and 6 partial tracts)
A) FHA, FSA/RHS & VA Home Purchase Loans
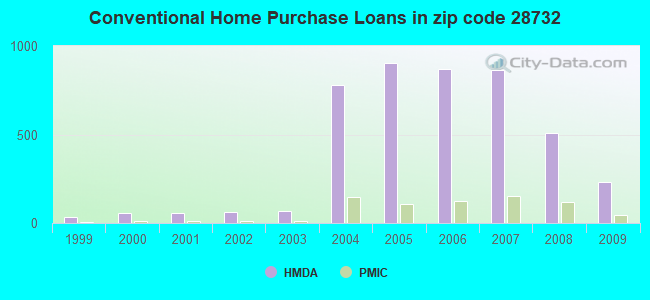
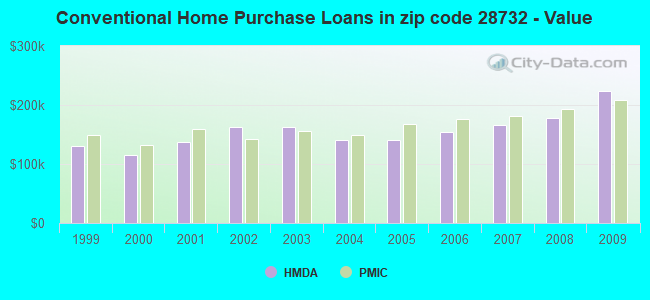
B) Conventional Home Purchase Loans
C) Refinancings
D) Home Improvement Loans
F) Non-occupant Loans on < 5 Family Dwellings (A B C & D)
G) Loans On Manufactured Home Dwelling (A B C & D)
Number
Average Value
Number
Average Value
Number
Average Value
Number
Average Value
Number
Average Value
Number
Average Value
LOANS ORIGINATED
152
$168,171
230
$224,108
914
$173,018
22
$118,626
85
$261,288
24
$103,465
APPLICATIONS APPROVED, NOT ACCEPTED
9
$133,398
4
$256,758
57
$198,258
1
$62,900
3
$198,960
1
$59,970
APPLICATIONS DENIED
40
$155,740
32
$179,829
273
$180,082
22
$54,771
26
$131,120
35
$88,866
APPLICATIONS WITHDRAWN
12
$169,896
18
$202,635
192
$178,035
4
$143,875
10
$202,511
6
$96,110
FILES CLOSED FOR INCOMPLETENESS
3
$121,543
4
$169,040
67
$189,800
2
$46,110
5
$140,052
0
$0
Aggregated Statistics For Year 2008 (Based on 2 full and 6 partial tracts)
A) FHA, FSA/RHS & VA Home Purchase Loans
B) Conventional Home Purchase Loans
C) Refinancings
D) Home Improvement Loans
E) Loans on Dwellings For 5+ Families
F) Non-occupant Loans on < 5 Family Dwellings (A B C & D)
G) Loans On Manufactured Home Dwelling (A B C & D)
Number
Average Value
Number
Average Value
Number
Average Value
Number
Average Value
Number
Average Value
Number
Average Value
Number
Average Value
LOANS ORIGINATED
67
$179,839
510
$177,778
605
$181,966
42
$115,625
3
$484,993
119
$172,158
35
$78,100
APPLICATIONS APPROVED, NOT ACCEPTED
2
$274,375
26
$185,460
51
$225,588
2
$61,705
2
$242,490
6
$155,307
3
$64,463
APPLICATIONS DENIED
26
$172,968
56
$185,268
241
$203,964
52
$89,325
3
$267,300
26
$167,304
37
$78,141
APPLICATIONS WITHDRAWN
12
$148,994
53
$177,202
117
$186,724
8
$111,479
2
$248,095
16
$207,610
12
$109,184
FILES CLOSED FOR INCOMPLETENESS
4
$218,188
22
$181,031
37
$212,794
0
$0
0
$0
1
$400,360
1
$86,490
Aggregated Statistics For Year 2007 (Based on 2 full and 6 partial tracts)
A) FHA, FSA/RHS & VA Home Purchase Loans
B) Conventional Home Purchase Loans
C) Refinancings
D) Home Improvement Loans
E) Loans on Dwellings For 5+ Families
F) Non-occupant Loans on < 5 Family Dwellings (A B C & D)
G) Loans On Manufactured Home Dwelling (A B C & D)
Number
Average Value
Number
Average Value
Number
Average Value
Number
Average Value
Number
Average Value
Number
Average Value
Number
Average Value
LOANS ORIGINATED
26
$157,323
863
$166,426
542
$188,693
57
$63,181
2
$152,055
177
$154,335
47
$78,964
APPLICATIONS APPROVED, NOT ACCEPTED
4
$162,758
75
$166,966
90
$170,735
22
$41,804
0
$0
20
$158,020
10
$166,862
APPLICATIONS DENIED
5
$164,470
151
$161,603
333
$182,600
50
$83,668
0
$0
33
$145,431
43
$80,708
APPLICATIONS WITHDRAWN
4
$282,692
74
$187,476
126
$214,708
7
$268,076
0
$0
16
$248,296
6
$83,468
FILES CLOSED FOR INCOMPLETENESS
0
$0
22
$165,389
47
$218,598
1
$82,400
0
$0
6
$208,945
0
$0
Aggregated Statistics For Year 2006 (Based on 2 full and 6 partial tracts)
A) FHA, FSA/RHS & VA Home Purchase Loans
B) Conventional Home Purchase Loans
C) Refinancings
D) Home Improvement Loans
E) Loans on Dwellings For 5+ Families
F) Non-occupant Loans on < 5 Family Dwellings (A B C & D)
G) Loans On Manufactured Home Dwelling (A B C & D)
Number
Average Value
Number
Average Value
Number
Average Value
Number
Average Value
Number
Average Value
Number
Average Value
Number
Average Value
LOANS ORIGINATED
14
$165,675
871
$153,459
530
$143,707
56
$50,677
2
$54,420
189
$143,991
42
$79,759
APPLICATIONS APPROVED, NOT ACCEPTED
1
$70,500
119
$124,669
100
$140,534
5
$26,992
0
$0
28
$121,469
18
$60,564
APPLICATIONS DENIED
6
$84,657
199
$123,900
253
$160,084
31
$55,678
0
$0
33
$157,051
91
$64,043
APPLICATIONS WITHDRAWN
3
$152,670
70
$169,180
128
$159,806
11
$101,664
0
$0
15
$124,352
1
$149,490
FILES CLOSED FOR INCOMPLETENESS
2
$177,895
29
$134,657
53
$164,776
4
$42,905
0
$0
10
$140,813
0
$0
Aggregated Statistics For Year 2005 (Based on 2 full and 6 partial tracts)
A) FHA, FSA/RHS & VA Home Purchase Loans
B) Conventional Home Purchase Loans
C) Refinancings
D) Home Improvement Loans
E) Loans on Dwellings For 5+ Families
F) Non-occupant Loans on < 5 Family Dwellings (A B C & D)
G) Loans On Manufactured Home Dwelling (A B C & D)
Number
Average Value
Number
Average Value
Number
Average Value
Number
Average Value
Number
Average Value
Number
Average Value
Number
Average Value
LOANS ORIGINATED
17
$123,391
905
$140,478
547
$144,089
43
$89,353
2
$265,700
163
$144,640
65
$58,739
APPLICATIONS APPROVED, NOT ACCEPTED
2
$56,515
85
$107,841
99
$111,218
16
$33,839
0
$0
12
$120,364
30
$54,636
APPLICATIONS DENIED
9
$120,430
194
$115,575
250
$131,847
22
$41,872
0
$0
27
$104,388
103
$73,635
APPLICATIONS WITHDRAWN
6
$164,168
104
$127,915
174
$144,031
14
$126,357
0
$0
9
$118,444
10
$94,813
FILES CLOSED FOR INCOMPLETENESS
0
$0
18
$110,067
46
$174,259
7
$54,491
0
$0
4
$90,410
0
$0
Aggregated Statistics For Year 2004 (Based on 2 full and 6 partial tracts)
A) FHA, FSA/RHS & VA Home Purchase Loans
B) Conventional Home Purchase Loans
C) Refinancings
D) Home Improvement Loans
F) Non-occupant Loans on < 5 Family Dwellings (A B C & D)
G) Loans On Manufactured Home Dwelling (A B C & D)
Number
Average Value
Number
Average Value
Number
Average Value
Number
Average Value
Number
Average Value
Number
Average Value
LOANS ORIGINATED
18
$155,818
781
$141,247
533
$138,383
29
$34,784
149
$128,574
60
$55,364
APPLICATIONS APPROVED, NOT ACCEPTED
2
$48,455
85
$112,214
86
$113,303
8
$96,894
15
$147,411
44
$52,276
APPLICATIONS DENIED
1
$149,610
127
$96,462
252
$111,480
34
$31,363
37
$108,210
95
$56,836
APPLICATIONS WITHDRAWN
4
$162,015
64
$135,205
135
$138,033
19
$71,583
13
$138,708
17
$76,799
FILES CLOSED FOR INCOMPLETENESS
0
$0
13
$125,628
45
$144,045
4
$93,418
4
$105,280
0
$0
Aggregated Statistics For Year 2003 (Based on 2 partial tracts)
A) FHA, FSA/RHS & VA Home Purchase Loans
B) Conventional Home Purchase Loans
C) Refinancings
D) Home Improvement Loans
F) Non-occupant Loans on < 5 Family Dwellings (A B C & D)
Number
Average Value
Number
Average Value
Number
Average Value
Number
Average Value
Number
Average Value
LOANS ORIGINATED
1
$190,280
69
$163,511
228
$159,932
2
$40,445
22
$144,635
APPLICATIONS APPROVED, NOT ACCEPTED
0
$0
6
$94,698
24
$143,236
0
$0
1
$91,490
APPLICATIONS DENIED
0
$0
9
$118,358
48
$142,025
4
$13,040
1
$151,830
APPLICATIONS WITHDRAWN
0
$0
8
$128,290
25
$145,586
0
$0
1
$51,710
FILES CLOSED FOR INCOMPLETENESS
0
$0
1
$132,380
6
$211,608
0
$0
0
$0
Aggregated Statistics For Year 2002 (Based on 2 partial tracts)
A) FHA, FSA/RHS & VA Home Purchase Loans
B) Conventional Home Purchase Loans
C) Refinancings
D) Home Improvement Loans
F) Non-occupant Loans on < 5 Family Dwellings (A B C & D)
Number
Average Value
Number
Average Value
Number
Average Value
Number
Average Value
Number
Average Value
LOANS ORIGINATED
1
$133,930
61
$163,526
160
$151,422
4
$18,232
16
$120,528
APPLICATIONS APPROVED, NOT ACCEPTED
0
$0
6
$123,907
20
$120,810
1
$47,960
1
$98,790
APPLICATIONS DENIED
0
$0
14
$94,541
47
$130,691
3
$24,237
3
$162,287
APPLICATIONS WITHDRAWN
0
$0
9
$143,086
24
$132,941
1
$17,020
2
$204,205
FILES CLOSED FOR INCOMPLETENESS
0
$0
2
$141,330
6
$182,435
0
$0
1
$51,050
Aggregated Statistics For Year 2001 (Based on 2 partial tracts)
A) FHA, FSA/RHS & VA Home Purchase Loans
B) Conventional Home Purchase Loans
C) Refinancings
D) Home Improvement Loans
F) Non-occupant Loans on < 5 Family Dwellings (A B C & D)
Number
Average Value
Number
Average Value
Number
Average Value
Number
Average Value
Number
Average Value
LOANS ORIGINATED
2
$76,245
58
$138,087
122
$140,873
6
$21,400
15
$127,532
APPLICATIONS APPROVED, NOT ACCEPTED
0
$0
9
$74,256
19
$123,097
1
$26,960
1
$100,560
APPLICATIONS DENIED
0
$0
25
$68,687
39
$101,394
3
$20,627
2
$52,600
APPLICATIONS WITHDRAWN
0
$0
7
$129,411
19
$126,273
1
$45,970
1
$152,490
FILES CLOSED FOR INCOMPLETENESS
0
$0
1
$160,220
6
$137,093
0
$0
0
$0
Aggregated Statistics For Year 2000 (Based on 2 partial tracts)
A) FHA, FSA/RHS & VA Home Purchase Loans
B) Conventional Home Purchase Loans
C) Refinancings
D) Home Improvement Loans
F) Non-occupant Loans on < 5 Family Dwellings (A B C & D)
Number
Average Value
Number
Average Value
Number
Average Value
Number
Average Value
Number
Average Value
LOANS ORIGINATED
1
$81,110
59
$114,598
46
$118,105
5
$36,464
11
$101,781
APPLICATIONS APPROVED, NOT ACCEPTED
1
$44,860
10
$61,062
10
$92,113
2
$20,775
1
$73,370
APPLICATIONS DENIED
2
$47,185
34
$57,304
34
$80,041
4
$27,958
3
$127,737
APPLICATIONS WITHDRAWN
1
$63,650
7
$111,416
12
$99,598
1
$61,440
1
$74,030
FILES CLOSED FOR INCOMPLETENESS
0
$0
0
$0
5
$96,312
0
$0
0
$0
Aggregated Statistics For Year 1999 (Based on 1 partial tract)
A) FHA, FSA/RHS & VA Home Purchase Loans
B) Conventional Home Purchase Loans
C) Refinancings
D) Home Improvement Loans
F) Non-occupant Loans on < 5 Family Dwellings (A B C & D)
2002 - 2018 National Fire Incident Reporting System (NFIRS) incidents
Based on the data from the years 2002 - 2018 the average number of fire incidents per year is 55. The highest number of reported fires - 93 took place in 2007, and the least - 3 in 2003. The data has a rising trend.
When looking into fire subcategories, the most reports belonged to: Structure Fires (59.9%), and Outside Fires (25.9%).
Fire incident types reported to NFIRS in Zip Code 28732


 Nearest zip codes: 28730, 28735, 28792, 28803, 28791, 28704.


 Based on the data from the years 2002 - 2018 the average number of fire incidents per year is 55. The highest number of reported fires - 93 took place in 2007, and the least - 3 in 2003. The data has a rising trend.
 When looking into fire subcategories, the most reports belonged to: Structure Fires (59.9%), and Outside Fires (25.9%).