Estimated zip code population in 2022: 4,322 Zip code population in 2010: 5,652 Zip code population in 2000: 5,937
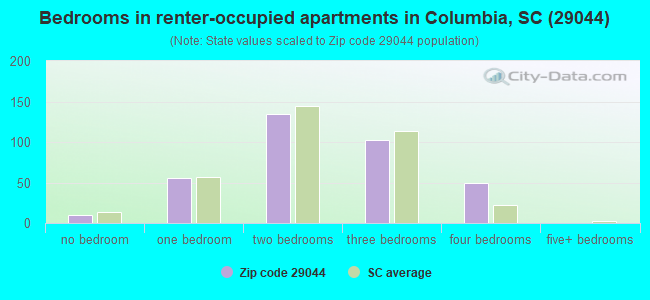
Houses and condos: 2,552 Renter-occupied apartments: 351
% of renters here:
17%
State:
28%
March 2022 cost of living index in zip code 29044: 79.6 (low, U.S. average is 100)
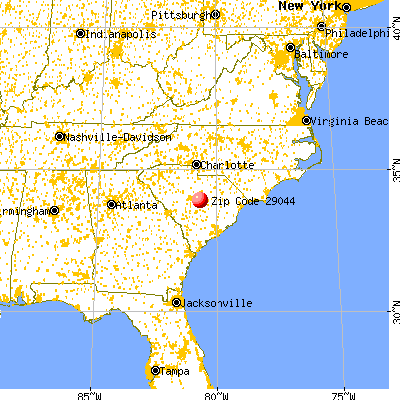
Land area: 137.8 sq. mi. Water area: 1.8 sq. mi.
Population density: 31 people per square mile
(very low).
OSM Map
General Map
Google Map
MSN Map
OSM Map
General Map
Google Map
MSN Map
OSM Map
General Map
Google Map
MSN Map
OSM Map
General Map
Google Map
MSN Map
Please wait while loading the map...
Real estate property taxes paid for housing units in 2022:
This zip code:
0.5% ($746)
South Carolina:
0.5% ($1,185)
Median real estate property taxes paid for housing units with mortgages in 2022: $671 (0.5%) Median real estate property taxes paid for housing units with no mortgage in 2022: $868 (0.6%)
Business Search- 14 Million verified businesses
Males: 2,080
(48.1%)
Females: 2,242
(51.9%)
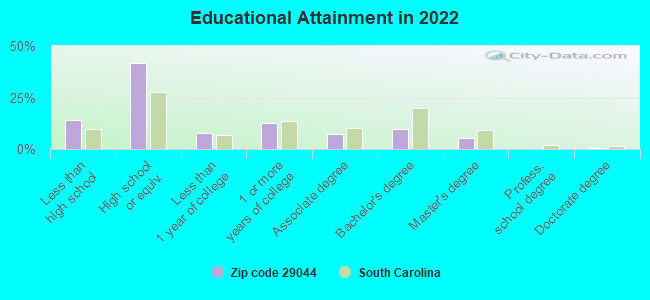
For population 25 years and over in 29044:
High school or higher: 84.7%
Bachelor's degree or higher: 15.8%
Graduate or professional degree: 6.0%
Unemployed: 5.3%
Mean travel time to work (commute): 29.0 minutes
For population 15 years and over in 29044:
Never married: 37.3%
Now married: 42.4%
Separated: 4.0%
Widowed: 9.3%
Divorced: 7.0%
Zip code 29044 compared to state average:
Median house value below state average.
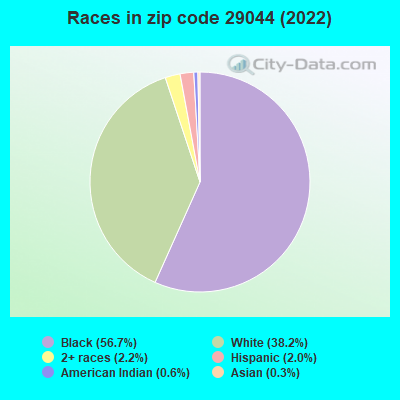
Black race population percentage above state average.
Hispanic race population percentage significantly below state average.
Median age above state average.
Foreign-born population percentage significantly below state average.
Renting percentage below state average.
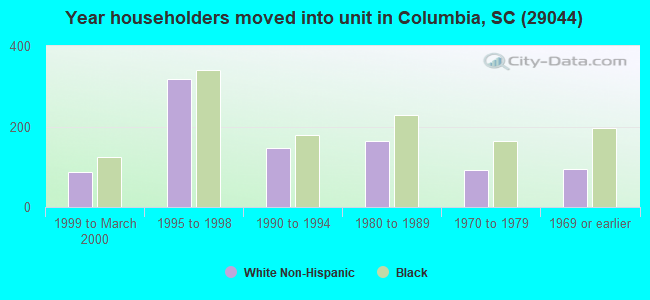
Length of stay since moving in significantly above state average.
Percentage of population with a bachelor's degree or higher below state average.
Averages for the 2020 tax year for zip code 29044, filed in 2021:
Average Adjusted Gross Income (AGI) in 2020: $38,275 (Individual Income Tax Returns)
Here:
$38,275
State:
$65,754
Salary/wage: $34,046 (reported on 78.8% of returns)
Here:
$34,046
State:
$52,566
(% of AGI for various income ranges: 1133.4% for AGIs below $25k, 3872.8% for AGIs $25k-50k, 7705.3% for AGIs $50k-75k, 10320.0% for AGIs $75k-100k, 21308.3% for AGIs $100k-200k)
Taxable interest for individuals: $436 (reported on 14.9% of returns)
This zip code:
$436
South Carolina:
$1,749
(% of AGI for various income ranges: 5.1% for AGIs below $25k, 5.9% for AGIs $25k-50k, 13.5% for AGIs $50k-75k, 25.0% for AGIs $75k-100k, 65.0% for AGIs $100k-200k)
Ordinary dividends: $3,694 (reported on 7.5% of returns)
Here:
$3,694
State:
$8,783
(% of AGI for various income ranges: 10.4% for AGIs below $25k, 6.1% for AGIs $25k-50k, 27.6% for AGIs $50k-75k, 32.5% for AGIs $75k-100k, 785.0% for AGIs $100k-200k)
Net capital gain/loss in AGI: +$6,569 (reported on 6.6% of returns)
Here:
+$6,569
State:
+$24,194
(% of AGI for various income ranges: 6.6% for AGIs below $25k, 75.3% for AGIs $50k-75k, 1445.0% for AGIs $100k-200k)
Profit/loss from business: +$3,693 (reported on 17.0% of returns)
Here:
+$3,693
State:
+$11,253
(% of AGI for various income ranges: 107.3% for AGIs below $25k, 25.9% for AGIs $25k-50k, 93.8% for AGIs $75k-100k, 735.0% for AGIs $100k-200k)
Taxable individual retirement arrangement distribution: $10,900 (reported on 6.2% of returns)
29044:
$10,900
South Carolina:
$21,604
(% of AGI for various income ranges: 30.0% for AGIs below $25k, 61.5% for AGIs $25k-50k, 370.6% for AGIs $50k-75k, 696.7% for AGIs $100k-200k)
Total itemized deductions: $28,900 (reported on 4.1% of returns)
Here:
$28,900
State:
$35,199
(% of AGI for various income ranges: 145.2% for AGIs $25k-50k, 467.1% for AGIs $50k-75k, 2186.7% for AGIs $100k-200k)
Charity contributions: $8,850 (reported on 3.3% of returns)
Here:
$8,850
State:
$14,319
(% of AGI for various income ranges: 55.0% for AGIs $25k-50k, 67.1% for AGIs $50k-75k, 495.0% for AGIs $100k-200k)
Taxes paid: $5,450 (reported on 4.1% of returns)
29044:
$5,450
State:
$7,486
(% of AGI for various income ranges: 18.9% for AGIs $25k-50k, 100.6% for AGIs $50k-75k, 453.3% for AGIs $100k-200k)
Earned income credit: $2,583 (reported on 27.4% of returns)
Here:
$2,583
State:
$2,397
(% of AGI for various income ranges: 148.5% for AGIs below $25k, 82.0% for AGIs $25k-50k)
Percentage of individuals using paid preparers for their 2020 taxes: 91.7%
Here:
92%
State:
93%
(% for various income ranges: 91.8% for AGIs below $25k, 91.8% for AGIs $25k-50k, 89.7% for AGIs $50k-75k, 92.9% for AGIs $75k-100k, 92.3% for AGIs $100k-200k, 100.0% for AGIs over 200k)
Averages for the 2012 tax year for zip code 29044, filed in 2013:
Average Adjusted Gross Income (AGI) in 2012: $34,883 (Individual Income Tax Returns)
Here:
$34,883
State:
$51,133
Salary/wage: $30,648 (reported on 82.8% of returns)
Here:
$30,648
State:
$42,173
(% of AGI for various income ranges: 75.3% for AGIs below $25k, 84.1% for AGIs $25k-50k, 76.5% for AGIs $50k-75k, 69.8% for AGIs $75k-100k, 53.0% for AGIs $100k-200k)
Taxable interest for individuals: $670 (reported on 17.2% of returns)
This zip code:
$670
South Carolina:
$1,468
(% of AGI for various income ranges: 0.5% for AGIs below $25k, 0.4% for AGIs $25k-50k, 0.3% for AGIs $50k-75k, 0.3% for AGIs $75k-100k, 0.2% for AGIs $100k-200k)
Ordinary dividends: $1,667 (reported on 7.8% of returns)
Here:
$1,667
State:
$6,511
(% of AGI for various income ranges: 0.7% for AGIs below $25k, 0.2% for AGIs $25k-50k, 0.3% for AGIs $50k-75k, 0.5% for AGIs $75k-100k, 0.3% for AGIs $100k-200k)
Net capital gain/loss in AGI: +$1,410 (reported on 4.3% of returns)
Here:
+$1,410
State:
+$13,061
(% of AGI for various income ranges: 0.1% for AGIs below $25k, 1.7% for AGIs $25k-50k, 0.4% for AGIs $50k-75k, 0.3% for AGIs $100k-200k)
Profit/loss from business: +$6,403 (reported on 14.7% of returns)
Here:
+$6,403
State:
+$10,167
(% of AGI for various income ranges: 7.2% for AGIs below $25k, 0.8% for AGIs $25k-50k, 1.6% for AGIs $50k-75k, 1.9% for AGIs $75k-100k, 2.5% for AGIs $100k-200k)
Taxable individual retirement arrangement distribution: $12,617 (reported on 5.2% of returns)
29044:
$12,617
South Carolina:
$17,019
(% of AGI for various income ranges: 1.5% for AGIs below $25k, 1.0% for AGIs $25k-50k, 2.7% for AGIs $50k-75k, 3.7% for AGIs $100k-200k)
Total itemized deductions: $18,386 (27% of AGI, reported on 22.0% of returns)
Here:
$18,386
State:
$22,890
Here:
27.2% of AGI
State:
21.4% of AGI
(% of AGI for various income ranges: 6.2% for AGIs below $25k, 11.0% for AGIs $25k-50k, 13.0% for AGIs $50k-75k, 13.7% for AGIs $75k-100k, 14.9% for AGIs $100k-200k)
Charity contributions: $4,859 (reported on 17.7% of returns)
Here:
$4,859
State:
$5,169
(% of AGI for various income ranges: 0.6% for AGIs below $25k, 2.2% for AGIs $25k-50k, 2.7% for AGIs $50k-75k, 3.7% for AGIs $75k-100k, 3.6% for AGIs $100k-200k)
Taxes paid: $5,490 (reported on 21.6% of returns)
29044:
$5,490
State:
$7,644
(% of AGI for various income ranges: 0.9% for AGIs below $25k, 2.4% for AGIs $25k-50k, 3.9% for AGIs $50k-75k, 4.5% for AGIs $75k-100k, 5.9% for AGIs $100k-200k)
Earned income credit: $2,579 (reported on 34.5% of returns)
Here:
$2,579
State:
$2,418
(% of AGI for various income ranges: 11.2% for AGIs below $25k, 1.4% for AGIs $25k-50k)
Percentage of individuals using paid preparers for their 2012 taxes: 53.0%
Here:
53%
State:
57%
(% for various income ranges: 50.8% for AGIs below $25k, 49.2% for AGIs $25k-50k, 65.4% for AGIs $50k-75k, 58.3% for AGIs $75k-100k, 63.6% for AGIs $100k-200k)
Averages for the 2004 tax year for zip code 29044, filed in 2005:
Average Adjusted Gross Income (AGI) in 2004: $30,387 (Individual Income Tax Returns)
Here:
$30,387
State:
$41,965
Salary/wage: $28,401 (reported on 89.6% of returns)
Here:
$28,401
State:
$35,695
(% of AGI for various income ranges: 105.4% for AGIs below $10k, 85.1% for AGIs $10k-25k, 86.9% for AGIs $25k-50k, 86.1% for AGIs $50k-75k, 86.9% for AGIs $75k-100k, 58.2% for AGIs over 100k)
Taxable interest for individuals: $638 (reported on 21.6% of returns)
This zip code:
$638
South Carolina:
$1,623
(% of AGI for various income ranges: 1.7% for AGIs below $10k, 0.6% for AGIs $10k-25k, 0.3% for AGIs $25k-50k, 0.4% for AGIs $50k-75k, 0.3% for AGIs $75k-100k, 0.8% for AGIs over 100k)
Taxable dividends: $1,101 (reported on 8.7% of returns)
Here:
$1,101
State:
$3,999
(% of AGI for various income ranges: 0.4% for AGIs below $10k, 0.2% for AGIs $10k-25k, 0.3% for AGIs $25k-50k, 0.2% for AGIs $50k-75k, 0.3% for AGIs $75k-100k, 0.7% for AGIs over 100k)
Net capital gain/loss: +$2,549 (reported on 5.3% of returns)
Here:
+$2,549
State:
+$13,100
(% of AGI for various income ranges: 1.7% for AGIs below $10k, -0.1% for AGIs $10k-25k, 0.3% for AGIs $25k-50k, 0.2% for AGIs $50k-75k, 0.1% for AGIs $75k-100k, 2.6% for AGIs over 100k)
Profit/loss from business: +$3,767 (reported on 11.0% of returns)
Here:
+$3,767
State:
+$9,144
(% of AGI for various income ranges: 3.1% for AGIs below $10k, 3.1% for AGIs $10k-25k, 1.0% for AGIs $25k-50k, -0.5% for AGIs $50k-75k, -0.9% for AGIs $75k-100k, 5.1% for AGIs over 100k)
IRA payment deduction: $1,909 (reported on 0.9% of returns)
29044:
$1,909
South Carolina:
$2,972
Total itemized deductions: $15,508 (28% of AGI, reported on 26.3% of returns)
Here:
$15,508
State:
$19,039
Here:
27.6% of AGI
State:
22.8% of AGI
(% of AGI for various income ranges: 7.4% for AGIs below $10k, 6.2% for AGIs $10k-25k, 14.0% for AGIs $25k-50k, 15.6% for AGIs $50k-75k, 18.4% for AGIs $75k-100k, 16.2% for AGIs over 100k)
Charity contributions deductions: $3,784 (7% of AGI, reported on 23.2% of returns)
Here:
$3,784
State:
$4,305
Here:
6.5% of AGI
State:
5.0% of AGI
(% of AGI for various income ranges: 1.2% for AGIs $10k-25k, 3.0% for AGIs $25k-50k, 3.1% for AGIs $50k-75k, 4.2% for AGIs $75k-100k, 4.5% for AGIs over 100k)
Total tax: $3,605 (reported on 61.8% of returns)
29044:
$3,605
State:
$6,497
(% of AGI for various income ranges: 2.5% for AGIs below $10k, 2.9% for AGIs $10k-25k, 5.7% for AGIs $25k-50k, 8.5% for AGIs $50k-75k, 10.0% for AGIs $75k-100k, 16.5% for AGIs over 100k)
Earned income credit: $2,000 (reported on 33.2% of returns)
Here:
$2,000
State:
$1,882
Percentage of individuals using paid preparers for their 2004 taxes: 65.7%
Here:
66%
State:
66%
(% for various income ranges: 64.5% for AGIs below $10k, 69.0% for AGIs $10k-25k, 62.7% for AGIs $25k-50k, 68.2% for AGIs $50k-75k, 53.9% for AGIs $75k-100k, 76.0% for AGIs over 100k)
Household received Food Stamps/SNAP in the past 12 months: 310 Household did not receive Food Stamps/SNAP in the past 12 months: 1,727
Women who had a birth in the past 12 months: 40 (0 now married, 36 unmarried) Women who did not have a birth in the past 12 months: 914 (249 now married, 659 unmarried)
Housing units in zip code 29044 with a mortgage: 951 (93 second mortgage, 30 both second mortgage and home equity loan) Median monthly owner costs for units with a mortgage: $1,118 Median monthly owner costs for units without a mortgage: $490
Residents with income below the poverty level in 2022:
This zip code:
17.5%
Whole state:
14.0%
Residents with income below 50% of the poverty level in 2022:
This zip code:
9.6%
Whole state:
7.3%
Median number of rooms in houses and condos:
Here:
6.0
State:
6.4
Median number of rooms in apartments:
Here:
4.3
State:
4.5
Notable locations in this zip code not listed on our city pages
Notable locations in zip code 29044: Hickory Top Farm (A), Richland County Chain Gang Camp Number 1 (B), Wateree Gun Club (C), Fork Swamp Hunting Club (D), Columbia - Richland Fire Department Congaree Run (E), Columbia - Richland Fire Department Leesburg Road (F), Wateree Electric Plant (G), Columbia - Richland Fire Department Eastover (H). Display/hide their locations on the map
Churches in zip code 29044 include: Saint James Church (A), Saint Johns Church (B), Sanctified Church (C), Oak Grove Church (D), Mount Zion Church (E), Mount Nebo Church (F), Goodwill Church (G), Good Hope Church (H), Glorious Church (I). Display/hide their locations on the map
Lakes, reservoirs, and swamps: Cove Lake (A), Myers Lake (B), Chaver Pond (C), Murray Pond (D), Cates Pond (E), Goodwill Pond (F), Boyds Pond (G), Jordans Pond (H). Display/hide their locations on the map
Streams, rivers, and creeks: Spears Creek (A), Wateree River (B), Congaree River (C), Pigeon Roost Branch (D), Moke Branch (E), Madraw Branch (F), Leesburg Branch (G), Jumping Run Creek (H), Colonels Creek (I). Display/hide their locations on the map
In group quarters: 154 (-1 institutionalized population)
Size of family households: 631 2-persons, 303 3-persons, 112 4-persons, 66 5-persons, 27 6-persons
Size of nonfamily households: 689 1-person, 201 2-persons, 6 3-persons
195 married couples with children.
252 single-parent households (67 men, 185 women).
94.8% of residents of 29044 zip code speak English at home.
3.3% of residents speak Spanish at home (88% very well, 12% well).
1.4% of residents speak other Indo-European language at home (100% very well).
0.9% of residents speak Asian or Pacific Island language at home (87% very well, 13% well).
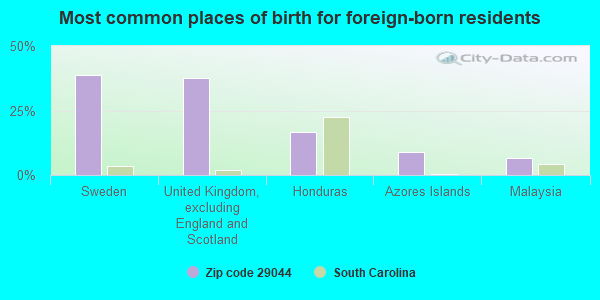
Foreign born population: 93 (2.2%) (75.9% of them are naturalized citizens)
This zip code:
2.2%
Whole state:
5.2%
39%Sweden
38%United Kingdom, excluding England and Scotland
17%Honduras
9%Azores Islands
7%Malaysia
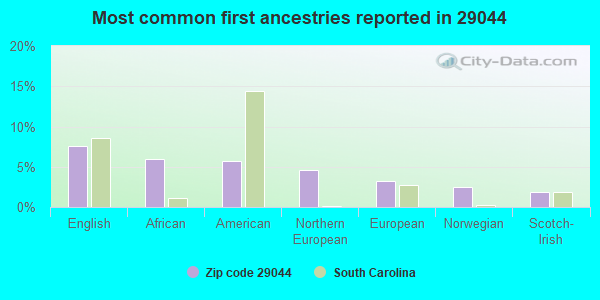
8%English
6%African
6%American
5%Northern European
3%European
2%Norwegian
2%Scotch-Irish
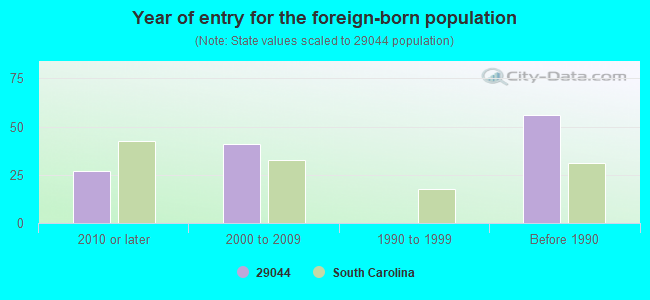
Year of entry for the foreign-born population
272010 or later
412000 to 2009
01990 to 1999
56Before 1990
Facilities with environmental interests located in this zip code:
FINNCHEM USA INCORPORATED (200 WATEREE STATION ROAD in EASTOVER, SC)
AIR SYNTHETIC MINOR (AIRS/AFS) National Pollutant Discharge Elimination System NON-MAJOR (Tracking pollutant discharge elimination systems) - permit National Pollutant Discharge Elimination System NON-MAJOR (Tracking pollutant discharge elimination systems) - permit HAZARDOUS WASTE BIENNIAL REPORTER (Resource Conservation and Recovery Act (tracking hazardous waste)) Large Quantity Generators, more that 1000 kg of hazardous waste/month (Resource Conservation and Recovery Act (tracking hazardous waste)) STATE MASTER (South Carolina database) - LABORATORY CERTIFICATION STATE MASTER (South Carolina database) - DRINKING WATER PROGRAM TRI REPORTER (Tracking of toxic chemicals releasing facilities) Business SIC classification: INDUSTRIAL INORGANIC CHEMICALS Alternative names: FINNCHEM USA EASTOVER, HURON TECH CORP, HURON TECH CORP - EASTOVER
EAST COAST STEEL INCORPORATED (2051 CONGAREE RD/HWY 769 in EASTOVER, SC)
AIR MINOR (AIRS/AFS) (Resource Conservation and Recovery Act (tracking hazardous waste)) STATE MASTER (South Carolina database) - HAZARDOUS WASTE PROGRAM, DRINKING WATER PROGRAM, DRINKING WATER SYSTEM Business SIC classification: FABRICATED STRUCTURAL METAL Organizations: CHARLES M KELSEY JR (CONTACT/OWNER)
FINNCHEM:191 WATEREE STATION ROAD PLANT (191 WATEREE STATION ROAD in EASTOVER, SC)
AIR SYNTHETIC MINOR (AIRS/AFS) STATE MASTER (South Carolina database) - AIR PROGRAM, X-RAY EQUIPMENT, HAZARDOUS WASTE PROGRAM, AIR PROGRAM, AIR MAJOR, DRINKING WATER PROGRAM, DRINKING WATER SYSTEM STATE MASTER (South Carolina database) - AIR MAJOR, AIR PROGRAM Business SIC classification: INDUSTRIAL INORGANIC CHEMICALS Alternative names: FINNCHEM:CLOSED-EXEMPT, FINNCHEM USA INC EASTOVER, HURON TECH CORPORATION
CSX TRANSPORTATION INC (1935 CONGAREE RD in CONGAREE, SC)
(Resource Conservation and Recovery Act (tracking hazardous waste)) STATE MASTER (South Carolina database) - HAZARDOUS WASTE PROGRAM Organizations: CHARLES E HICKS (CONTACT/OPERATOR)
DANIEL CONSTRUCTION CO (HWY 601 (UNION CAMP CORP) in EASTOVER, SC)
(Resource Conservation and Recovery Act (tracking hazardous waste)) STATE MASTER (South Carolina database) - HAZARDOUS WASTE PROGRAM Organizations: OPERNAME (CONTACT/OPERATOR)
, OWNERNAME (CONTACT/OWNER)
Alternative names: DANIEL CONSTRUCTION COMPANY (DEACTIVATED
FLUORDANIEL CONSTRUCTION (UNION CAMP PLANT HWY 601 in EASTOVER, SC)
(Resource Conservation and Recovery Act (tracking hazardous waste)) STATE MASTER (South Carolina database) - HAZARDOUS WASTE PROGRAM Organizations: OPERNAME (CONTACT/OPERATOR)
, UNION CAMP CORP. (CONTACT/OWNER)
Alternative names: FLUOR DANIEL CONSTRUCTION (DEACTIVATED)
DEFENDER INDUSTRIES INC. (SC HIGHWAY 1162 in EASTOVER, SC)
TRI REPORTER (Tracking of toxic chemicals releasing facilities) Business SIC classification: SPECIALTY CLEANING, POLISHING, AND SANITATION PREPARATIONS; BUILDING CLEANING AND MAINTENANCE SERVICES
Housing units lacking complete plumbing facilities: 8.2% Housing units lacking complete kitchen facilities: 3.7%
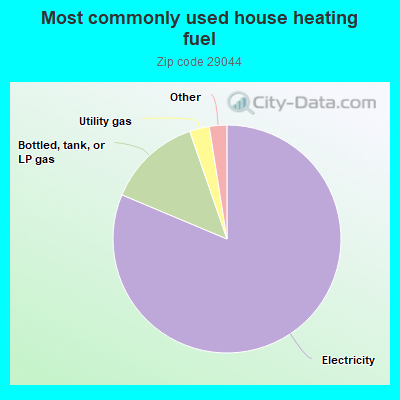
81.5%Electricity
13.4%Bottled, tank, or LP gas
2.8%Utility gas
0.9%No fuel used
0.8%Fuel oil, kerosene, etc.
0.7%Wood
Population in 1990: 4,666. Population change in the 1990s: +1,271 (+27.2%).
Place of birth for U.S.-born residents:
This state: 2,916
Northeast: 410
Midwest: 262
South: 539
West: 30
67% of the 29044 zip code residents lived in the same house 5 years ago. Out of people who lived in different houses, 70% lived in this county. Out of people who lived in different counties, 50% lived in South Carolina.
95% of the 29044 zip code residents lived in the same house 1 year ago. Out of people who lived in different houses, 26% moved from this county. Out of people who lived in different houses, 68% moved from different county within same state. Out of people who lived in different houses, 1% moved from different state. Out of people who lived in different houses, 2% moved from abroad.
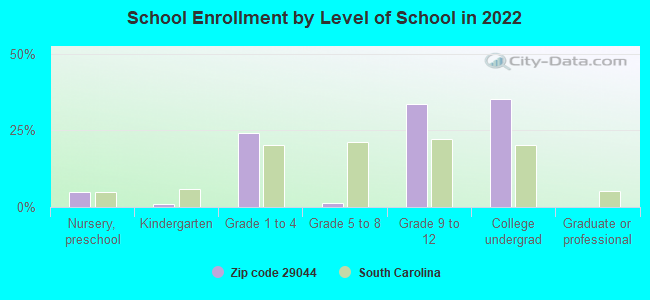
Private vs. public school enrollment:
Students in private schools in grades 1 to 8 (elementary and middle school): 141
Here:
58.6%
South Carolina:
14.4%
Students in private schools in grades 9 to 12 (high school): 5
Here:
1.9%
South Carolina:
11.1%
Students in private undergraduate colleges: 152
Here:
52.2%
South Carolina:
21.9%
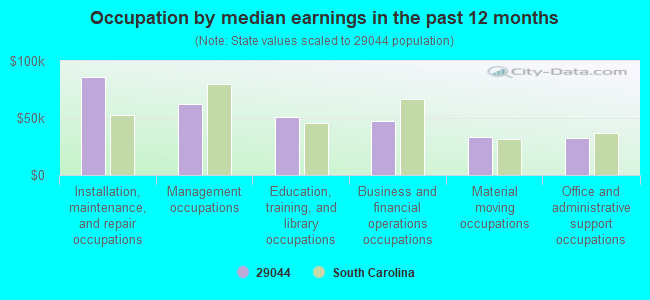
Occupation by median earnings in the past 12 months ($)
86,303Installation, maintenance, and repair occupations
62,321Management occupations
50,574Education, training, and library occupations
47,575Business and financial operations occupations
33,638Material moving occupations
32,468Office and administrative support occupations
Companies with federal contracts located in this zip code (EASTOVER, SC):
KAN KLEAN JANITORIAL SERVICES, (11702 GARNERS FERRY RD; small business) : $4,851,801 in 48 contractsfrom 1999 to 2006
Contracts for Custodial Janitorial Services by Public Buildings Service, Army Signed by year:2000: $173,266; 2001: $1,617,538; 2002: $1,064,977; 2003: $720,874; 2004: $445,452; 2005: $39,490; 2006: $16,882.
Biggest contracts:
$804,000 with Public Buildings Service for Custodial Janitorial Services. Signed on 2001-12-15. Completion date: 2002-12-15.
$802,000, same as above.Signed on 2001-01-15. Completion date: 2001-12-15.
$699,000, same as above.Signed on 1999-12-15. Completion date: 2000-12-15.
$410,845, same as above.Signed on 2002-12-15. Completion date: 2003-12-15.
218TH REGIMENT DINING FACILITY (5411 LEESBURG RD) : $2,268,654 in 57 contractsfrom 2002 to 2006
Contracts for Food Services, Food, Oils and Fats, Food Cooking, Baking, and Serving Equipment, Bakery and Cereal Products, and moreby Army Signed by year:2000: $0; 2001: $0; 2002: $76,758; 2003: $180,718; 2004: $220,234; 2005: $852,824; 2006: $938,120.
Biggest contracts:
$812,800 with Army for Food Services. Signed on 2005-04-07. Completion date: 2005-09-30.
$798,680 with Army for Food, Oils and Fats. Signed on 2006-03-01. Completion date: 2006-09-30.
$479,472 with Army for Food Services. Signed on 2006-03-22. Completion date: 2006-02-28.
$73,264, same as above.Signed on 2006-02-17. Completion date: 2006-09-30.
EASTOVER OIL CO INC (116 MAIN ST; small business) : $19,779 in 4 contractsfrom 2005 to 2006
$8,973 with Army for Fuel Oils. Signed on 2005-10-13. Completion date: 2005-10-28.
$4,788, same as above.Signed on 2006-05-23. Completion date: 2006-05-26.
$3,228, same as above.Signed on 2006-05-30. Completion date: 2006-06-02.
$2,790, same as above.Signed on 2006-06-12. Completion date: 2006-06-12.
EVA RAINEY WARREN (164 CHANWOOD DR; small business) : $12,745 in 6 contractsin 2004
Contracts for Chaplain Services by Army Signed by year:2000: $0; 2001: $0; 2002: $0; 2003: $0; 2004: $12,745; 2005: $0; 2006: $0.
Biggest contracts:
$4,160 with Army for Chaplain Services. Signed on 2004-10-22. Completion date: 2005-09-30.
$4,160, same as above.Signed on 2004-10-22. Completion date: 2005-09-30.
$2,925, same as above.Signed on 2004-02-02. Completion date: 2004-09-30.
$2,925, same as above.Signed on 2004-02-02. Completion date: 2004-09-30.
ROSE ELECTRIC INC (1421 VANBOKLEN RD; small business)
$8,200 with Army for Installation of Equipment -- Electrical and Electronic Equipment Components. Signed on 2004-09-07. Completion date: 2004-09-29.
Top industries in this zip code by the number of employees in 2005:
Utilities: Electric Power Distribution (100-249 employees: 1 establishment, 1-4 employees: 1 establishment)
Health Care and Social Assistance: Home Health Care Services (20-49: 2)
Other Services (except Public Administration): Religious Organizations (5-9: 4, 1-4: 4)
Health Care and Social Assistance: Offices of Physicians (except Mental Health Specialists) (20-49: 1)
People in group quarters in 2010:
20 people in nursing facilities/skilled-nursing facilities
People in group quarters in 2000:
41 people in other noninstitutional group quarters
20 people in homes for the mentally retarded
Fatal accident statistics in 2013:
Fatal accident count: 7
Vehicles involved in fatal accidents: 9
Fatal accidents caused by drunken drivers: 2
Fatalities: 8
Persons involved in fatal accidents: 14
Pedestrians involved in fatal accidents: 0
Fatal accident statistics in 2012:
Fatal accident count: 4
Vehicles involved in fatal accidents: 4
Fatal accidents caused by drunken drivers: 3
Fatalities: 4
Persons involved in fatal accidents: 4
Pedestrians involved in fatal accidents: 0
Home Mortgage Disclosure Act Aggregated Statistics For Year 2009 (Based on 4 partial tracts)
A) FHA, FSA/RHS & VA Home Purchase Loans
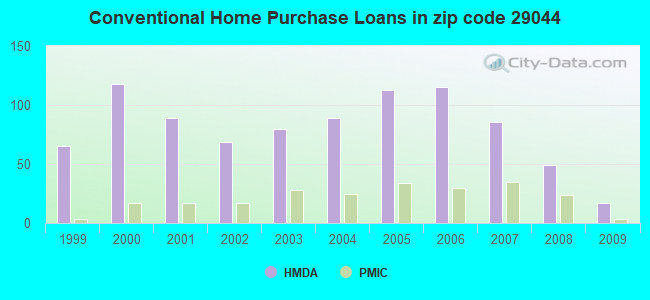
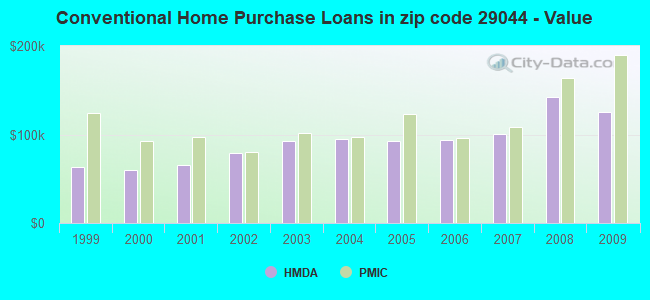
B) Conventional Home Purchase Loans
C) Refinancings
D) Home Improvement Loans
F) Non-occupant Loans on < 5 Family Dwellings (A B C & D)
G) Loans On Manufactured Home Dwelling (A B C & D)
Number
Average Value
Number
Average Value
Number
Average Value
Number
Average Value
Number
Average Value
Number
Average Value
LOANS ORIGINATED
22
$139,349
17
$125,824
92
$159,874
4
$97,468
3
$113,493
11
$50,372
APPLICATIONS APPROVED, NOT ACCEPTED
1
$261,050
4
$54,832
15
$128,291
2
$48,570
1
$49,590
5
$42,846
APPLICATIONS DENIED
4
$67,925
12
$44,140
68
$119,330
11
$65,589
6
$90,128
17
$53,782
APPLICATIONS WITHDRAWN
5
$177,870
5
$176,254
45
$133,618
0
$0
1
$21,880
4
$72,890
FILES CLOSED FOR INCOMPLETENESS
1
$126,240
0
$0
12
$139,649
1
$14,030
0
$0
3
$83,313
Aggregated Statistics For Year 2008 (Based on 4 partial tracts)
A) FHA, FSA/RHS & VA Home Purchase Loans
B) Conventional Home Purchase Loans
C) Refinancings
D) Home Improvement Loans
F) Non-occupant Loans on < 5 Family Dwellings (A B C & D)
G) Loans On Manufactured Home Dwelling (A B C & D)
Number
Average Value
Number
Average Value
Number
Average Value
Number
Average Value
Number
Average Value
Number
Average Value
LOANS ORIGINATED
23
$111,168
49
$142,695
100
$131,609
11
$132,508
23
$63,546
21
$62,354
APPLICATIONS APPROVED, NOT ACCEPTED
1
$49,590
9
$76,944
27
$90,428
3
$17,257
8
$33,301
5
$57,820
APPLICATIONS DENIED
4
$75,525
21
$66,522
105
$105,185
30
$69,545
9
$58,712
29
$61,403
APPLICATIONS WITHDRAWN
3
$97,650
6
$77,300
44
$121,907
3
$94,363
3
$42,227
5
$54,036
FILES CLOSED FOR INCOMPLETENESS
5
$155,184
1
$24,230
5
$88,906
0
$0
2
$35,450
1
$109,670
Aggregated Statistics For Year 2007 (Based on 4 partial tracts)
A) FHA, FSA/RHS & VA Home Purchase Loans
B) Conventional Home Purchase Loans
C) Refinancings
D) Home Improvement Loans
F) Non-occupant Loans on < 5 Family Dwellings (A B C & D)
G) Loans On Manufactured Home Dwelling (A B C & D)
Number
Average Value
Number
Average Value
Number
Average Value
Number
Average Value
Number
Average Value
Number
Average Value
LOANS ORIGINATED
16
$112,699
86
$100,777
109
$127,637
16
$68,175
25
$68,768
24
$55,918
APPLICATIONS APPROVED, NOT ACCEPTED
3
$103,273
21
$80,361
41
$118,289
8
$53,269
5
$53,246
13
$63,895
APPLICATIONS DENIED
5
$78,962
40
$98,526
155
$102,250
54
$45,513
15
$71,259
29
$56,264
APPLICATIONS WITHDRAWN
1
$186,680
19
$112,208
51
$110,132
5
$55,138
5
$82,548
4
$66,630
FILES CLOSED FOR INCOMPLETENESS
1
$66,360
7
$152,137
10
$152,001
2
$101,295
3
$59,933
1
$18,960
Aggregated Statistics For Year 2006 (Based on 4 partial tracts)
A) FHA, FSA/RHS & VA Home Purchase Loans
B) Conventional Home Purchase Loans
C) Refinancings
D) Home Improvement Loans
F) Non-occupant Loans on < 5 Family Dwellings (A B C & D)
G) Loans On Manufactured Home Dwelling (A B C & D)
Number
Average Value
Number
Average Value
Number
Average Value
Number
Average Value
Number
Average Value
Number
Average Value
LOANS ORIGINATED
12
$104,963
115
$93,852
104
$104,064
19
$46,221
40
$70,525
36
$52,519
APPLICATIONS APPROVED, NOT ACCEPTED
3
$70,223
29
$60,868
36
$80,902
7
$18,611
3
$39,847
15
$50,830
APPLICATIONS DENIED
6
$52,048
76
$79,757
178
$98,159
37
$47,852
26
$71,713
60
$46,866
APPLICATIONS WITHDRAWN
1
$206,580
18
$65,196
72
$107,830
5
$83,600
11
$57,336
3
$101,580
FILES CLOSED FOR INCOMPLETENESS
0
$0
6
$89,618
26
$93,730
1
$97,710
1
$80,340
1
$37,920
Aggregated Statistics For Year 2005 (Based on 4 partial tracts)
A) FHA, FSA/RHS & VA Home Purchase Loans
B) Conventional Home Purchase Loans
C) Refinancings
D) Home Improvement Loans
F) Non-occupant Loans on < 5 Family Dwellings (A B C & D)
G) Loans On Manufactured Home Dwelling (A B C & D)
Number
Average Value
Number
Average Value
Number
Average Value
Number
Average Value
Number
Average Value
Number
Average Value
LOANS ORIGINATED
13
$100,160
113
$92,777
138
$97,666
21
$41,797
34
$74,896
31
$58,804
APPLICATIONS APPROVED, NOT ACCEPTED
0
$0
29
$57,060
36
$100,000
5
$21,396
5
$50,912
15
$44,363
APPLICATIONS DENIED
3
$46,757
79
$59,234
187
$88,274
47
$42,170
20
$53,740
86
$55,321
APPLICATIONS WITHDRAWN
1
$74,380
34
$84,415
79
$97,126
7
$281,039
14
$128,404
18
$58,142
FILES CLOSED FOR INCOMPLETENESS
0
$0
3
$366,060
33
$95,892
0
$0
1
$81,670
5
$64,364
Aggregated Statistics For Year 2004 (Based on 4 partial tracts)
A) FHA, FSA/RHS & VA Home Purchase Loans
B) Conventional Home Purchase Loans
C) Refinancings
D) Home Improvement Loans
F) Non-occupant Loans on < 5 Family Dwellings (A B C & D)
G) Loans On Manufactured Home Dwelling (A B C & D)
Number
Average Value
Number
Average Value
Number
Average Value
Number
Average Value
Number
Average Value
Number
Average Value
LOANS ORIGINATED
12
$101,520
89
$94,355
150
$94,785
16
$38,719
24
$57,985
45
$48,326
APPLICATIONS APPROVED, NOT ACCEPTED
1
$130,070
24
$61,865
62
$80,251
8
$8,881
9
$47,741
27
$64,022
APPLICATIONS DENIED
5
$62,484
54
$63,161
218
$79,445
31
$42,445
19
$49,867
81
$58,456
APPLICATIONS WITHDRAWN
0
$0
15
$107,403
68
$92,352
8
$69,522
3
$54,677
11
$68,862
FILES CLOSED FOR INCOMPLETENESS
0
$0
5
$138,818
20
$98,748
0
$0
1
$53,560
5
$65,036
Aggregated Statistics For Year 2003 (Based on 4 partial tracts)
A) FHA, FSA/RHS & VA Home Purchase Loans
B) Conventional Home Purchase Loans
C) Refinancings
D) Home Improvement Loans
F) Non-occupant Loans on < 5 Family Dwellings (A B C & D)
Number
Average Value
Number
Average Value
Number
Average Value
Number
Average Value
Number
Average Value
LOANS ORIGINATED
6
$126,680
80
$92,200
255
$94,083
15
$22,223
23
$62,195
APPLICATIONS APPROVED, NOT ACCEPTED
1
$156,850
16
$83,494
70
$75,064
2
$24,885
5
$55,952
APPLICATIONS DENIED
1
$62,710
47
$53,564
197
$88,250
19
$26,630
18
$41,674
APPLICATIONS WITHDRAWN
0
$0
15
$88,235
72
$83,138
1
$182,300
3
$101,877
FILES CLOSED FOR INCOMPLETENESS
0
$0
3
$67,067
18
$69,582
2
$21,410
3
$42,933
Aggregated Statistics For Year 2002 (Based on 4 partial tracts)
A) FHA, FSA/RHS & VA Home Purchase Loans
B) Conventional Home Purchase Loans
C) Refinancings
D) Home Improvement Loans
F) Non-occupant Loans on < 5 Family Dwellings (A B C & D)
Number
Average Value
Number
Average Value
Number
Average Value
Number
Average Value
Number
Average Value
LOANS ORIGINATED
12
$95,705
69
$79,058
192
$96,602
9
$38,933
25
$88,645
APPLICATIONS APPROVED, NOT ACCEPTED
0
$0
20
$53,546
73
$68,282
1
$48,860
9
$46,569
APPLICATIONS DENIED
1
$207,090
78
$54,260
232
$80,177
11
$15,274
13
$55,666
APPLICATIONS WITHDRAWN
1
$110,110
9
$102,500
85
$85,405
0
$0
1
$76,510
FILES CLOSED FOR INCOMPLETENESS
1
$54,690
1
$79,060
40
$78,049
0
$0
3
$111,070
Aggregated Statistics For Year 2001 (Based on 4 partial tracts)
A) FHA, FSA/RHS & VA Home Purchase Loans
B) Conventional Home Purchase Loans
C) Refinancings
D) Home Improvement Loans
F) Non-occupant Loans on < 5 Family Dwellings (A B C & D)
Number
Average Value
Number
Average Value
Number
Average Value
Number
Average Value
Number
Average Value
LOANS ORIGINATED
16
$85,082
89
$65,718
218
$87,662
11
$13,950
19
$65,895
APPLICATIONS APPROVED, NOT ACCEPTED
0
$0
50
$50,996
53
$90,999
1
$12,400
6
$50,317
APPLICATIONS DENIED
2
$76,565
169
$47,075
289
$65,925
29
$22,836
12
$52,717
APPLICATIONS WITHDRAWN
1
$107,920
19
$89,136
93
$78,979
6
$23,535
2
$30,165
FILES CLOSED FOR INCOMPLETENESS
0
$0
0
$0
20
$81,336
1
$19,130
1
$43,020
Aggregated Statistics For Year 2000 (Based on 4 partial tracts)
A) FHA, FSA/RHS & VA Home Purchase Loans
B) Conventional Home Purchase Loans
C) Refinancings
D) Home Improvement Loans
E) Loans on Dwellings For 5+ Families
F) Non-occupant Loans on < 5 Family Dwellings (A B C & D)
Number
Average Value
Number
Average Value
Number
Average Value
Number
Average Value
Number
Average Value
Number
Average Value
LOANS ORIGINATED
16
$85,694
118
$60,405
114
$63,159
16
$13,578
0
$0
14
$59,504
APPLICATIONS APPROVED, NOT ACCEPTED
7
$74,209
61
$53,347
55
$67,003
3
$18,340
0
$0
7
$63,376
APPLICATIONS DENIED
5
$22,560
173
$46,053
304
$63,107
33
$24,664
1
$91,810
12
$38,549
APPLICATIONS WITHDRAWN
3
$57,457
13
$55,102
86
$62,029
3
$123,660
0
$0
3
$27,203
FILES CLOSED FOR INCOMPLETENESS
1
$57,380
5
$66,134
48
$60,657
0
$0
0
$0
0
$0
Aggregated Statistics For Year 1999 (Based on 2 partial tracts)
A) FHA, FSA/RHS & VA Home Purchase Loans
B) Conventional Home Purchase Loans
C) Refinancings
D) Home Improvement Loans
F) Non-occupant Loans on < 5 Family Dwellings (A B C & D)
Detailed PMIC statistics for the following Tracts:0119.02
, 0120.00
2002 - 2018 National Fire Incident Reporting System (NFIRS) incidents
According to the data from the years 2002 - 2018 the average number of fires per year is 72. The highest number of fire incidents - 122 took place in 2002, and the least - 44 in 2006. The data has a declining trend.
When looking into fire subcategories, the most reports belonged to: Outside Fires (55.4%), and Mobile Property/Vehicle Fires (21.3%).
Fire incident types reported to NFIRS in Zip Code 29044


 Nearest zip codes: 29062, 29052, 29061, 29168, 29207, 29152.


 According to the data from the years 2002 - 2018 the average number of fires per year is 72. The highest number of fire incidents - 122 took place in 2002, and the least - 44 in 2006. The data has a declining trend.
 When looking into fire subcategories, the most reports belonged to: Outside Fires (55.4%), and Mobile Property/Vehicle Fires (21.3%).