Estimated zip code population in 2022: 15,308 Zip code population in 2010: 10,146 Zip code population in 2000: 7,685
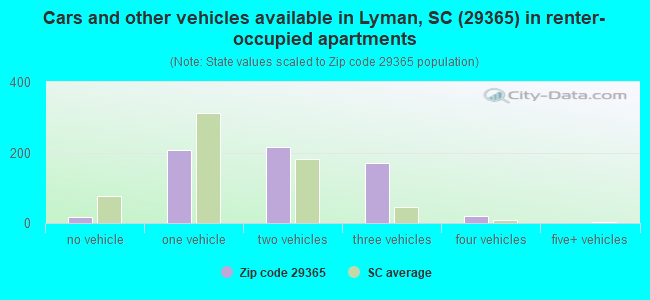
Houses and condos: 5,543 Renter-occupied apartments: 636
% of renters here:
12%
State:
28%
March 2022 cost of living index in zip code 29365: 84.1 (less than average, U.S. average is 100)
Land area: 18.3 sq. mi. Water area: 0.7 sq. mi.
Population density: 838 people per square mile
(low).
OSM Map
General Map
Google Map
MSN Map
OSM Map
General Map
Google Map
MSN Map
OSM Map
General Map
Google Map
MSN Map
OSM Map
General Map
Google Map
MSN Map
Please wait while loading the map...
Real estate property taxes paid for housing units in 2022:
This zip code:
0.5% ($1,316)
South Carolina:
0.5% ($1,185)
Median real estate property taxes paid for housing units with mortgages in 2022: $1,452 (0.5%) Median real estate property taxes paid for housing units with no mortgage in 2022: $972 (0.5%)
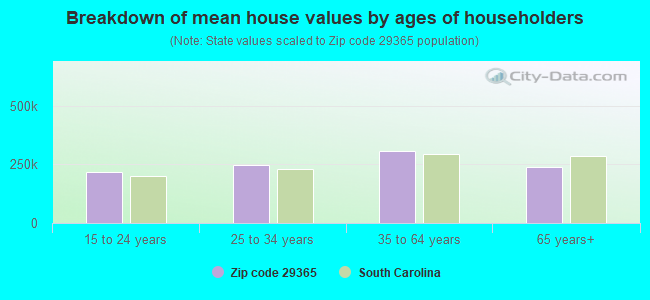
Estimated median house/condo value in 2022: $254,953
29365:
$254,953
South Carolina:
$254,600
According to our research of South Carolina and other state lists, there were 4 registered sex offenders living in 29365 zip code as of April 19, 2024. The ratio of all residents to sex offenders in zip code 29365 is 2,633 to 1. The ratio of registered sex offenders to all residents in this zip code is lower than the state average.
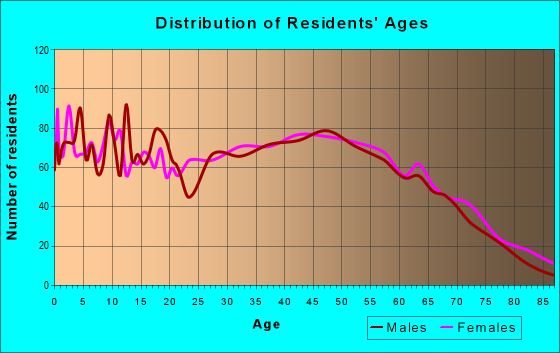
Median resident age:
This zip code:
33.8 years
South Carolina median age:
40.5 years
Average household size:
This zip code:
2.8 people
South Carolina:
2.4 people
Averages for the 2020 tax year for zip code 29365, filed in 2021:
Average Adjusted Gross Income (AGI) in 2020: $58,132 (Individual Income Tax Returns)
Here:
$58,132
State:
$65,754
Salary/wage: $51,633 (reported on 84.3% of returns)
Here:
$51,633
State:
$52,566
(% of AGI for various income ranges: 1231.3% for AGIs below $25k, 3827.6% for AGIs $25k-50k, 6874.7% for AGIs $50k-75k, 10245.1% for AGIs $75k-100k, 17042.2% for AGIs $100k-200k, 67120.0% for AGIs over 200k)
Taxable interest for individuals: $773 (reported on 19.5% of returns)
This zip code:
$773
South Carolina:
$1,749
(% of AGI for various income ranges: 12.4% for AGIs below $25k, 13.4% for AGIs $25k-50k, 20.0% for AGIs $50k-75k, 15.7% for AGIs $75k-100k, 49.4% for AGIs $100k-200k, 453.3% for AGIs over 200k)
Ordinary dividends: $3,181 (reported on 11.0% of returns)
Here:
$3,181
State:
$8,783
(% of AGI for various income ranges: 12.1% for AGIs below $25k, 22.0% for AGIs $25k-50k, 27.6% for AGIs $50k-75k, 55.3% for AGIs $75k-100k, 172.7% for AGIs $100k-200k, 1436.7% for AGIs over 200k)
Net capital gain/loss in AGI: +$10,814 (reported on 10.8% of returns)
Here:
+$10,814
State:
+$24,194
(% of AGI for various income ranges: 2.7% for AGIs below $25k, 12.5% for AGIs $25k-50k, 70.0% for AGIs $50k-75k, 101.6% for AGIs $75k-100k, 438.8% for AGIs $100k-200k, 13780.0% for AGIs over 200k)
Profit/loss from business: +$8,029 (reported on 17.1% of returns)
Here:
+$8,029
State:
+$11,253
(% of AGI for various income ranges: 108.1% for AGIs below $25k, 169.9% for AGIs $25k-50k, 171.1% for AGIs $50k-75k, 315.3% for AGIs $75k-100k, 291.4% for AGIs $100k-200k, 2220.0% for AGIs over 200k)
Taxable individual retirement arrangement distribution: $20,377 (reported on 7.9% of returns)
29365:
$20,377
South Carolina:
$21,604
(% of AGI for various income ranges: 64.8% for AGIs below $25k, 88.2% for AGIs $25k-50k, 156.9% for AGIs $50k-75k, 298.0% for AGIs $75k-100k, 1112.4% for AGIs $100k-200k)
Total itemized deductions: $28,922 (reported on 6.2% of returns)
Here:
$28,922
State:
$35,199
(% of AGI for various income ranges: 127.6% for AGIs $25k-50k, 246.5% for AGIs $50k-75k, 317.3% for AGIs $75k-100k, 837.3% for AGIs $100k-200k, 7296.7% for AGIs over 200k)
Charity contributions: $11,218 (reported on 5.0% of returns)
Here:
$11,218
State:
$14,319
(% of AGI for various income ranges: 20.1% for AGIs $25k-50k, 52.0% for AGIs $50k-75k, 65.5% for AGIs $75k-100k, 267.8% for AGIs $100k-200k, 4320.0% for AGIs over 200k)
Taxes paid: $7,137 (reported on 6.2% of returns)
29365:
$7,137
State:
$7,486
(% of AGI for various income ranges: 26.8% for AGIs $25k-50k, 53.6% for AGIs $50k-75k, 93.5% for AGIs $75k-100k, 241.0% for AGIs $100k-200k, 1370.0% for AGIs over 200k)
Earned income credit: $2,186 (reported on 16.6% of returns)
Here:
$2,186
State:
$2,397
(% of AGI for various income ranges: 91.2% for AGIs below $25k, 80.7% for AGIs $25k-50k, 2.3% for AGIs $50k-75k)
Percentage of individuals using paid preparers for their 2020 taxes: 92.4%
Here:
92%
State:
93%
(% for various income ranges: 90.2% for AGIs below $25k, 92.6% for AGIs $25k-50k, 93.0% for AGIs $50k-75k, 94.7% for AGIs $75k-100k, 94.2% for AGIs $100k-200k, 91.7% for AGIs over 200k)
Averages for the 2012 tax year for zip code 29365, filed in 2013:
Average Adjusted Gross Income (AGI) in 2012: $46,048 (Individual Income Tax Returns)
Here:
$46,048
State:
$51,133
Salary/wage: $42,336 (reported on 87.4% of returns)
Here:
$42,336
State:
$42,173
(% of AGI for various income ranges: 76.0% for AGIs below $25k, 84.5% for AGIs $25k-50k, 85.8% for AGIs $50k-75k, 80.5% for AGIs $75k-100k, 78.9% for AGIs $100k-200k, 56.5% for AGIs over 200k)
Taxable interest for individuals: $707 (reported on 23.2% of returns)
This zip code:
$707
South Carolina:
$1,468
(% of AGI for various income ranges: 0.9% for AGIs below $25k, 0.3% for AGIs $25k-50k, 0.3% for AGIs $50k-75k, 0.3% for AGIs $75k-100k, 0.3% for AGIs $100k-200k, 0.4% for AGIs over 200k)
Ordinary dividends: $1,929 (reported on 11.8% of returns)
Here:
$1,929
State:
$6,511
(% of AGI for various income ranges: 0.6% for AGIs below $25k, 0.5% for AGIs $25k-50k, 0.3% for AGIs $50k-75k, 0.2% for AGIs $75k-100k, 0.9% for AGIs $100k-200k, 0.3% for AGIs over 200k)
Net capital gain/loss in AGI: +$2,546 (reported on 7.8% of returns)
Here:
+$2,546
State:
+$13,061
(% of AGI for various income ranges: 0.2% for AGIs $50k-75k, 0.4% for AGIs $75k-100k, 1.5% for AGIs $100k-200k)
Profit/loss from business: +$7,321 (reported on 14.7% of returns)
Here:
+$7,321
State:
+$10,167
(% of AGI for various income ranges: 7.7% for AGIs below $25k, 2.4% for AGIs $25k-50k, 1.8% for AGIs $50k-75k, 2.5% for AGIs $75k-100k, 0.9% for AGIs $100k-200k)
Taxable individual retirement arrangement distribution: $13,711 (reported on 9.3% of returns)
29365:
$13,711
South Carolina:
$17,019
(% of AGI for various income ranges: 2.8% for AGIs below $25k, 2.4% for AGIs $25k-50k, 1.7% for AGIs $50k-75k, 3.1% for AGIs $75k-100k, 4.7% for AGIs $100k-200k)
Total itemized deductions: $18,543 (24% of AGI, reported on 31.8% of returns)
Here:
$18,543
State:
$22,890
Here:
23.7% of AGI
State:
21.4% of AGI
(% of AGI for various income ranges: 8.6% for AGIs below $25k, 10.1% for AGIs $25k-50k, 13.5% for AGIs $50k-75k, 14.6% for AGIs $75k-100k, 15.2% for AGIs $100k-200k, 13.2% for AGIs over 200k)
Charity contributions: $3,898 (reported on 26.7% of returns)
Here:
$3,898
State:
$5,169
(% of AGI for various income ranges: 0.9% for AGIs below $25k, 1.5% for AGIs $25k-50k, 2.4% for AGIs $50k-75k, 2.6% for AGIs $75k-100k, 3.3% for AGIs $100k-200k, 2.1% for AGIs over 200k)
Taxes paid: $5,807 (reported on 31.8% of returns)
29365:
$5,807
State:
$7,644
(% of AGI for various income ranges: 1.3% for AGIs below $25k, 2.4% for AGIs $25k-50k, 3.7% for AGIs $50k-75k, 4.8% for AGIs $75k-100k, 5.9% for AGIs $100k-200k, 6.3% for AGIs over 200k)
Earned income credit: $2,276 (reported on 21.3% of returns)
Here:
$2,276
State:
$2,418
(% of AGI for various income ranges: 7.4% for AGIs below $25k, 1.4% for AGIs $25k-50k)
Percentage of individuals using paid preparers for their 2012 taxes: 54.1%
Here:
54%
State:
57%
(% for various income ranges: 51.4% for AGIs below $25k, 53.7% for AGIs $25k-50k, 58.8% for AGIs $50k-75k, 54.5% for AGIs $75k-100k, 55.3% for AGIs $100k-200k, 75.0% for AGIs over 200k)
Averages for the 2004 tax year for zip code 29365, filed in 2005:
Average Adjusted Gross Income (AGI) in 2004: $39,090 (Individual Income Tax Returns)
Here:
$39,090
State:
$41,965
Salary/wage: $37,064 (reported on 88.4% of returns)
Here:
$37,064
State:
$35,695
(% of AGI for various income ranges: 158.6% for AGIs below $10k, 79.4% for AGIs $10k-25k, 85.9% for AGIs $25k-50k, 88.6% for AGIs $50k-75k, 86.1% for AGIs $75k-100k, 70.1% for AGIs over 100k)
Taxable interest for individuals: $1,039 (reported on 33.5% of returns)
This zip code:
$1,039
South Carolina:
$1,623
(% of AGI for various income ranges: 5.0% for AGIs below $10k, 1.5% for AGIs $10k-25k, 0.8% for AGIs $25k-50k, 0.5% for AGIs $50k-75k, 0.8% for AGIs $75k-100k, 1.0% for AGIs over 100k)
Taxable dividends: $1,289 (reported on 15.1% of returns)
Here:
$1,289
State:
$3,999
(% of AGI for various income ranges: 0.9% for AGIs below $10k, 0.6% for AGIs $10k-25k, 0.4% for AGIs $25k-50k, 0.2% for AGIs $50k-75k, 0.4% for AGIs $75k-100k, 1.1% for AGIs over 100k)
Net capital gain/loss: +$4,739 (reported on 10.9% of returns)
Here:
+$4,739
State:
+$13,100
(% of AGI for various income ranges: -1.3% for AGIs below $10k, -0.2% for AGIs $10k-25k, -0.0% for AGIs $25k-50k, 0.3% for AGIs $50k-75k, 0.5% for AGIs $75k-100k, 6.3% for AGIs over 100k)
Profit/loss from business: +$6,431 (reported on 15.4% of returns)
Here:
+$6,431
State:
+$9,144
(% of AGI for various income ranges: 4.2% for AGIs below $10k, 4.4% for AGIs $10k-25k, 3.1% for AGIs $25k-50k, 2.1% for AGIs $50k-75k, 3.1% for AGIs $75k-100k, 0.7% for AGIs over 100k)
IRA payment deduction: $2,869 (reported on 1.6% of returns)
29365:
$2,869
South Carolina:
$2,972
Total itemized deductions: $16,201 (25% of AGI, reported on 37.6% of returns)
Here:
$16,201
State:
$19,039
Here:
25.0% of AGI
State:
22.8% of AGI
(% of AGI for various income ranges: 15.9% for AGIs below $10k, 10.8% for AGIs $10k-25k, 13.3% for AGIs $25k-50k, 16.7% for AGIs $50k-75k, 19.3% for AGIs $75k-100k, 16.5% for AGIs over 100k)
Charity contributions deductions: $3,331 (5% of AGI, reported on 32.5% of returns)
Here:
$3,331
State:
$4,305
Here:
4.9% of AGI
State:
5.0% of AGI
(% of AGI for various income ranges: 1.6% for AGIs below $10k, 1.6% for AGIs $10k-25k, 1.9% for AGIs $25k-50k, 2.9% for AGIs $50k-75k, 4.0% for AGIs $75k-100k, 3.3% for AGIs over 100k)
Total tax: $4,542 (reported on 74.1% of returns)
29365:
$4,542
State:
$6,497
(% of AGI for various income ranges: 5.1% for AGIs below $10k, 3.7% for AGIs $10k-25k, 6.4% for AGIs $25k-50k, 8.1% for AGIs $50k-75k, 9.4% for AGIs $75k-100k, 14.5% for AGIs over 100k)
Earned income credit: $1,698 (reported on 17.8% of returns)
Here:
$1,698
State:
$1,882
Percentage of individuals using paid preparers for their 2004 taxes: 65.6%
Here:
66%
State:
66%
(% for various income ranges: 58.0% for AGIs below $10k, 67.7% for AGIs $10k-25k, 69.8% for AGIs $25k-50k, 65.4% for AGIs $50k-75k, 59.1% for AGIs $75k-100k, 70.2% for AGIs over 100k)
Likely homosexual households (counted as self-reported same-sex unmarried-partner households)
Lesbian couples: 0.3% of all households
Gay men: 0.3% of all households
Household received Food Stamps/SNAP in the past 12 months: 390 Household did not receive Food Stamps/SNAP in the past 12 months: 5,005
Women who had a birth in the past 12 months: 164 (167 now married, 6 unmarried) Women who did not have a birth in the past 12 months: 3,463 (1,976 now married, 1,506 unmarried)
Housing units in zip code 29365 with a mortgage: 3,276 (206 second mortgage, 11 home equity loan, 173 both second mortgage and home equity loan) Houses without a mortgage: 118
Median monthly owner costs for units with a mortgage: $1,259 Median monthly owner costs for units without a mortgage: $402
Residents with income below the poverty level in 2022:
This zip code:
8.9%
Whole state:
14.0%
Residents with income below 50% of the poverty level in 2022:
This zip code:
6.3%
Whole state:
7.3%
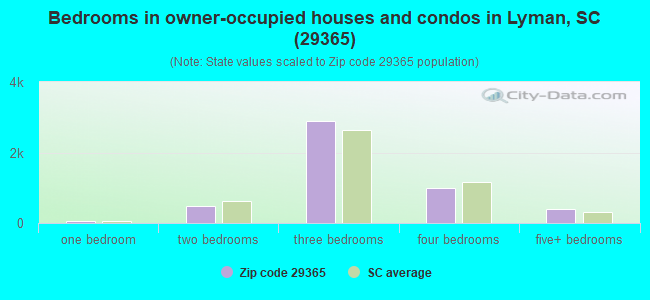
Median number of rooms in houses and condos:
Here:
6.6
State:
6.4
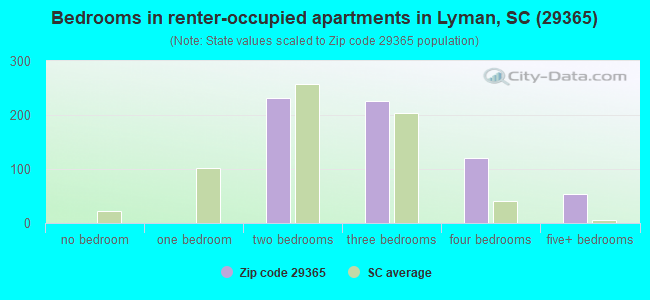
Median number of rooms in apartments:
Here:
5.3
State:
4.5
Notable locations in this zip code not listed on our city pages
Churches in zip code 29365 include: Shiloh Church (A), New Trinity Church (B), Wesleyan Church (C), Calvary Church (D), Friendship Church (E), Piney Grove Church (F). Display/hide their locations on the map
In group quarters: 43 (-1 institutionalized population)
Size of family households: 2,101 2-persons, 731 3-persons, 632 4-persons, 387 5-persons, 231 6-persons, 240 7-or-more-persons
Size of nonfamily households: 895 1-person, 224 2-persons
3,856 married couples with children.
457 single-parent households (181 men, 276 women).
81.8% of residents of 29365 zip code speak English at home.
5.9% of residents speak Spanish at home (80% very well, 15% well, 5% not well).
11.5% of residents speak other Indo-European language at home (53% very well, 26% well, 12% not well, 9% not at all).
1.2% of residents speak Asian or Pacific Island language at home (60% very well, 24% well, 16% not well).
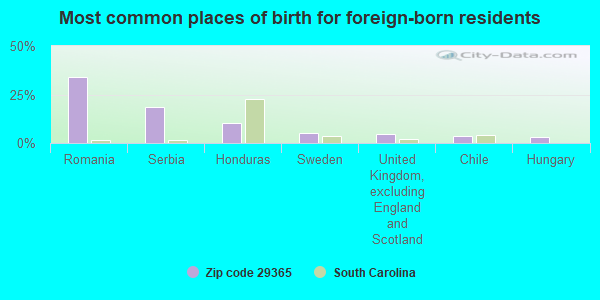
Foreign born population: 1,433 (9.4%) (48.1% of them are naturalized citizens)
This zip code:
9.4%
Whole state:
5.2%
34%Romania
18%Serbia
10%Honduras
5%Sweden
5%United Kingdom, excluding England and Scotland
4%Chile
3%Hungary
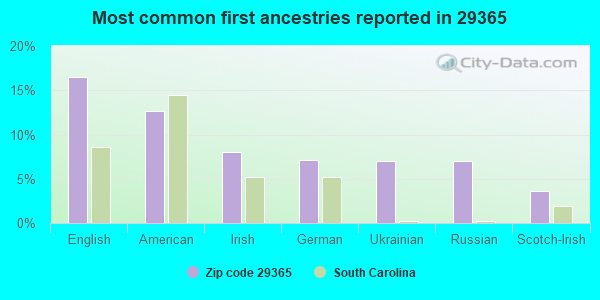
17%English
13%American
8%Irish
7%German
7%Ukrainian
7%Russian
4%Scotch-Irish
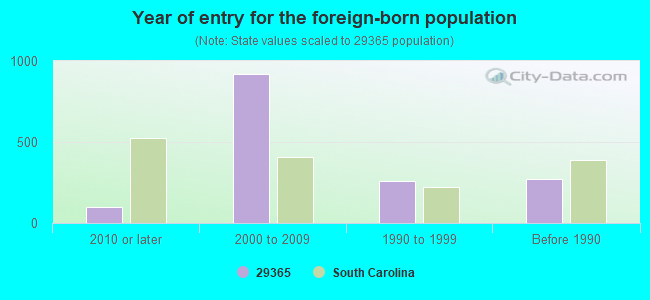
Year of entry for the foreign-born population
982010 or later
9172000 to 2009
2571990 to 1999
269Before 1990
Facilities with environmental interests located in this zip code:
BOILER TUBE CO OF AMERICA (506 CHARLOTTE HWY in LYMAN, SC)
AIR MINOR (AIRS/AFS) Small Quantity Generators, between 100 kg and 1000 kg of hazardous waste/month (Resource Conservation and Recovery Act (tracking hazardous waste)) - notification STATE MASTER (South Carolina database) - National Pollutant Discharge Elimination System Permit, HAZARDOUS WASTE PROGRAM STATE MASTER (South Carolina database) - UNDERGROUND STORAGE TANK PROGRAM STATE MASTER (South Carolina database) - AIR PROGRAM, RADIOACTIVE MATERIALS, HAZARDOUS WASTE PROGRAM TRI REPORTER (Tracking of toxic chemicals releasing facilities) Business SIC classification: FABRICATED PLATE WORK (BOILER SHOPS); FABRICATED PIPE AND PIPE FITTINGS Organizations: THERMAL ENGINEERING INT CORP (CONTACT/OWNER)
Alternative names: BOILER TUBE OF AMERICA, SENIOR BOILER TUBE CO
CUSTOM WORKS PLATING & POLISHING (511 INMAN ROAD in LYMAN, SC)
AIR MINOR (AIRS/AFS) (Resource Conservation and Recovery Act (tracking hazardous waste)) STATE MASTER (South Carolina database) - AIR PROGRAM, HAZARDOUS WASTE PROGRAM Business SIC classification: ELECTROPLATING, PLATING, POLISHING, ANODIZING, AND COLORING; SERVICES Business NAICS classification: ELECTROPLATING, PLATING, POLISHING, ANODIZING, AND COLORING. Organizations: DONNA BROWN (CONTACT/OWNER)
CAROLINA TRANSCO WMGMT PALMETTO LANDFILL (RT 3 in LYMAN, SC)
(Resource Conservation and Recovery Act (tracking hazardous waste)) STATE MASTER (South Carolina database) - HAZARDOUS WASTE PROGRAM Organizations: OPERNAME (CONTACT/OPERATOR)
, OWNERNAME (CONTACT/OWNER)
CARL STUART (2852 HWY 357 in LYMAN, SC)
(Resource Conservation and Recovery Act (tracking hazardous waste)) STATE MASTER (South Carolina database) - HAZARDOUS WASTE PROGRAM Alternative names: CARL STUART DEACTIVATED, STUARTS OIL SERVICE
F & R CONSTRUCTION COMPANY (BALLENGER ROAD in LYMAN, SC)
AIR MINOR (AIRS/AFS) STATE MASTER (South Carolina database) - AIR PROGRAM Business SIC classification: HIGHWAY AND STREET CONSTRUCTION, EXCEPT ELEVATED HIGHWAYS Alternative names: F & R ASPHALT CRUSHER, F & R CONSTRUCTION:CRUSHER
CAROLINA WASTE OIL (207 HAMMETT STORE RD in LYMAN, SC)
USED OIL PROGRAM (Resource Conservation and Recovery Act (tracking hazardous waste)) STATE MASTER (South Carolina database) - HAZARDOUS WASTE PROGRAM Organizations: TRAVIS PRUITT (CONTACT/OWNER)
F&R ASPHALT INC -PLANT #1 (BALLENGER RD in LYMAN, SC)
AIR SYNTHETIC MINOR (AIRS/AFS) STATE MASTER (South Carolina database) - AIR MAJOR, AIR PROGRAM, Business SIC classification: ASPHALT PAVING MIXTURES AND BLOCKS Alternative names: F & R ASPHALT:PLANT #1
CAROLINAS RECYCLING GROUP, LLC (P.O. BOX 578 in LYMAN, NC)
National Pollutant Discharge Elimination System NON-MAJOR (Tracking pollutant discharge elimination systems) - permit Business SIC classification: SCRAP AND WASTE MATERIALS Alternative names: CAROLINAS RECYCLING GRP LLC PL, JACKSON IRON & METAL CO, INC-P
ASPHALT CONTRACTORS LLC (HALF MOON ROAD in LYMAN, SC)
CRITERIA AND HAZARDOUS AIR POLLUTANT INVENTORY (Inventory of air pollution sources) Business SIC classification: ASPHALT PAVING MIXTURES AND BLOCKS
F & R ASPHALT PLANT #1 (BALLENGER ROAD in INMAN, SC)
CRITERIA AND HAZARDOUS AIR POLLUTANT INVENTORY (Inventory of air pollution sources) Business SIC classification: ASPHALT PAVING MIXTURES AND BLOCKS
FREE RADIATOR SHOP (12316 GREENVILLE HIGHWAY (HWY29) in LYMAN, SC)
SUPERFUND (Superfund database)
Housing units lacking complete kitchen facilities: 1.4%
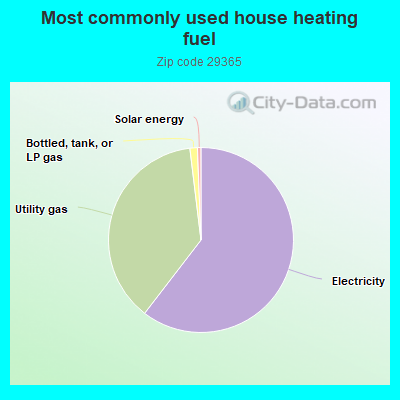
59.9%Electricity
37.3%Utility gas
1.3%Bottled, tank, or LP gas
0.6%Solar energy
Population in 1990: 4,515. Population change in the 1990s: +3,170 (+70.2%).
Place of birth for U.S.-born residents:
This state: 8,462
Northeast: 1,677
Midwest: 697
South: 2,522
West: 319
59% of the 29365 zip code residents lived in the same house 5 years ago. Out of people who lived in different houses, 57% lived in this county. Out of people who lived in different counties, 50% lived in South Carolina.
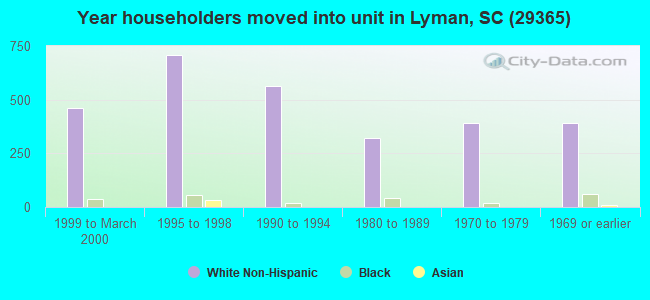
86% of the 29365 zip code residents lived in the same house 1 year ago. Out of people who lived in different houses, 36% moved from this county. Out of people who lived in different houses, 35% moved from different county within same state. Out of people who lived in different houses, 30% moved from different state.
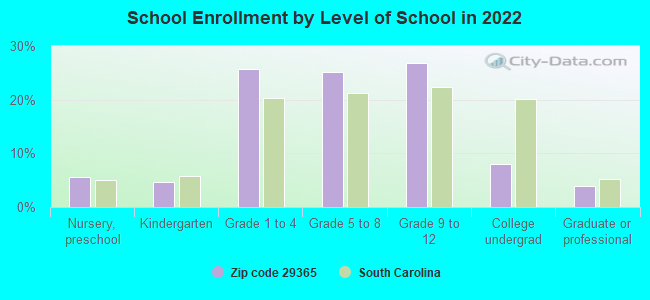
Private vs. public school enrollment:
Students in private schools in grades 1 to 8 (elementary and middle school): 321
Here:
17.5%
South Carolina:
14.4%
Students in private schools in grades 9 to 12 (high school): 306
Here:
31.4%
South Carolina:
11.1%
Students in private undergraduate colleges: 21
Here:
7.6%
South Carolina:
21.9%
Occupation by median earnings in the past 12 months ($)
90,460Architecture and engineering occupations
70,554Computer and mathematical occupations
67,537Sales and related occupations
67,154Health diagnosing and treating practitioners and other technical occupations
64,294Community and social service occupations
63,452Arts, design, entertainment, sports, and media occupations
Companies with federal contracts located in this zip code:
VENTEX CLEANING SYSTEMS (127 CHATIM RIDGE CT in LYMAN, SC; small business)
$6,300 with Air Force for Other Housekeeping Services. Signed on 2003-06-09. Completion date: 2003-12-12.
Top industries in this zip code by the number of employees in 2005:
2003 - 2018 National Fire Incident Reporting System (NFIRS) incidents
According to the data from the years 2003 - 2018 the average number of fires per year is 58. The highest number of reported fire incidents - 94 took place in 2016, and the least - 28 in 2003. The data has a growing trend.
When looking into fire subcategories, the most incidents belonged to: Outside Fires (45.0%), and Structure Fires (36.3%).
Fire incident types reported to NFIRS in Zip Code 29365
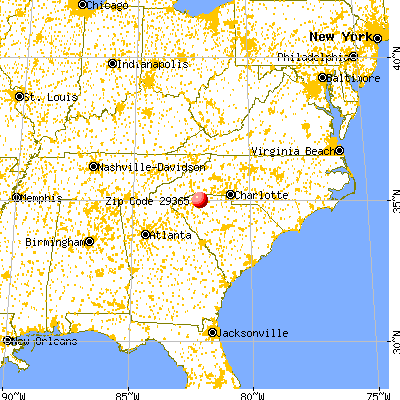


 Nearest zip codes: 29385, 29334, 29377, 29651, 29650, 29375.
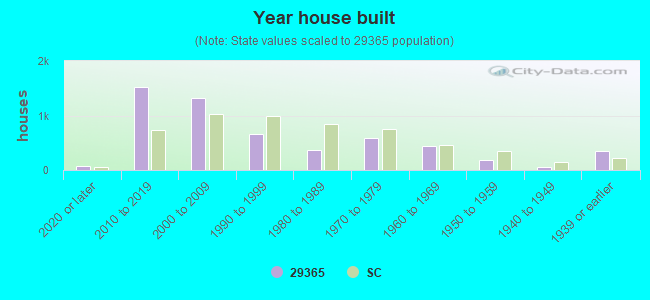


 According to the data from the years 2003 - 2018 the average number of fires per year is 58. The highest number of reported fire incidents - 94 took place in 2016, and the least - 28 in 2003. The data has a growing trend.
 When looking into fire subcategories, the most incidents belonged to: Outside Fires (45.0%), and Structure Fires (36.3%).