Estimated zip code population in 2022: 4,512 Zip code population in 2010: 5,118 Zip code population in 2000: 4,601
Houses and condos: 2,029 Renter-occupied apartments: 461
% of renters here:
28%
State:
28%
March 2022 cost of living index in zip code 29944: 79.2 (low, U.S. average is 100)
Land area: 132.4 sq. mi. Water area: 0.0 sq. mi.
Population density: 34 people per square mile
(very low).
OSM Map
General Map
Google Map
MSN Map
OSM Map
General Map
Google Map
MSN Map
OSM Map
General Map
Google Map
MSN Map
OSM Map
General Map
Google Map
MSN Map
Please wait while loading the map...
Real estate property taxes paid for housing units in 2022:
This zip code:
0.7% ($668)
South Carolina:
0.5% ($1,185)
Median real estate property taxes paid for housing units with mortgages in 2022: $757 (0.6%) Median real estate property taxes paid for housing units with no mortgage in 2022: $479 (0.6%)
Estimated median house/condo value in 2022: $91,972
29944:
$91,972
South Carolina:
$254,600
According to our research of South Carolina and other state lists, there was 1 registered sex offender living in 29944 zip code as of April 25, 2024. The ratio of all residents to sex offenders in zip code 29944 is 4,793 to 1. The ratio of registered sex offenders to all residents in this zip code is much lower than the state average.
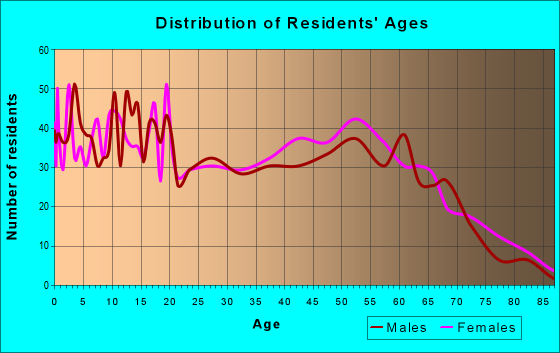
Median resident age:
This zip code:
39.2 years
South Carolina median age:
40.5 years
Average household size:
This zip code:
2.7 people
South Carolina:
2.4 people
Averages for the 2020 tax year for zip code 29944, filed in 2021:
Average Adjusted Gross Income (AGI) in 2020: $39,165 (Individual Income Tax Returns)
Here:
$39,165
State:
$65,754
Salary/wage: $36,093 (reported on 83.8% of returns)
Here:
$36,093
State:
$52,566
(% of AGI for various income ranges: 1254.2% for AGIs below $25k, 3878.3% for AGIs $25k-50k, 7069.4% for AGIs $50k-75k, 10056.2% for AGIs $75k-100k, 22818.3% for AGIs $100k-200k)
Taxable interest for individuals: $597 (reported on 14.2% of returns)
This zip code:
$597
South Carolina:
$1,749
(% of AGI for various income ranges: 4.3% for AGIs below $25k, 6.0% for AGIs $25k-50k, 17.2% for AGIs $50k-75k, 36.2% for AGIs $75k-100k, 90.0% for AGIs $100k-200k)
Ordinary dividends: $1,730 (reported on 4.9% of returns)
Here:
$1,730
State:
$8,783
(% of AGI for various income ranges: 4.7% for AGIs below $25k, 35.6% for AGIs $50k-75k, 125.0% for AGIs $100k-200k)
Net capital gain/loss in AGI: +$7,900 (reported on 5.9% of returns)
Here:
+$7,900
State:
+$24,194
(% of AGI for various income ranges: 3.8% for AGIs below $25k, 180.6% for AGIs $50k-75k, 345.0% for AGIs $75k-100k, 533.3% for AGIs $100k-200k)
Profit/loss from business: +$3,984 (reported on 15.7% of returns)
Here:
+$3,984
State:
+$11,253
(% of AGI for various income ranges: 86.2% for AGIs below $25k, 40.0% for AGIs $25k-50k, 149.4% for AGIs $50k-75k, 128.8% for AGIs $75k-100k, 156.7% for AGIs $100k-200k)
Taxable individual retirement arrangement distribution: $10,867 (reported on 5.9% of returns)
29944:
$10,867
South Carolina:
$21,604
(% of AGI for various income ranges: 35.3% for AGIs below $25k, 61.3% for AGIs $25k-50k, 251.7% for AGIs $50k-75k, 515.0% for AGIs $100k-200k)
Total itemized deductions: $31,071 (reported on 3.4% of returns)
Here:
$31,071
State:
$35,199
(% of AGI for various income ranges: 623.9% for AGIs $50k-75k, 1753.3% for AGIs $100k-200k)
Charity contributions: $14,883 (reported on 2.9% of returns)
Here:
$14,883
State:
$14,319
(% of AGI for various income ranges: 68.7% for AGIs $25k-50k, 950.0% for AGIs $100k-200k)
Taxes paid: $6,186 (reported on 3.4% of returns)
29944:
$6,186
State:
$7,486
(% of AGI for various income ranges: 95.6% for AGIs $50k-75k, 435.0% for AGIs $100k-200k)
Earned income credit: $2,679 (reported on 30.4% of returns)
Here:
$2,679
State:
$2,397
(% of AGI for various income ranges: 165.7% for AGIs below $25k, 99.6% for AGIs $25k-50k)
Percentage of individuals using paid preparers for their 2020 taxes: 94.1%
Here:
94%
State:
93%
(% for various income ranges: 93.4% for AGIs below $25k, 93.4% for AGIs $25k-50k, 96.2% for AGIs $50k-75k, 100.0% for AGIs $75k-100k, 92.9% for AGIs $100k-200k)
Averages for the 2012 tax year for zip code 29944, filed in 2013:
Average Adjusted Gross Income (AGI) in 2012: $35,104 (Individual Income Tax Returns)
Here:
$35,104
State:
$51,133
Salary/wage: $31,931 (reported on 87.1% of returns)
Here:
$31,931
State:
$42,173
(% of AGI for various income ranges: 82.6% for AGIs below $25k, 84.3% for AGIs $25k-50k, 80.3% for AGIs $50k-75k, 80.2% for AGIs $75k-100k, 67.6% for AGIs $100k-200k)
Taxable interest for individuals: $706 (reported on 17.0% of returns)
This zip code:
$706
South Carolina:
$1,468
(% of AGI for various income ranges: 0.5% for AGIs below $25k, 0.2% for AGIs $25k-50k, 0.4% for AGIs $50k-75k, 0.2% for AGIs $75k-100k, 0.4% for AGIs $100k-200k)
Ordinary dividends: $1,682 (reported on 5.7% of returns)
Here:
$1,682
State:
$6,511
(% of AGI for various income ranges: 0.3% for AGIs below $25k, 0.2% for AGIs $25k-50k, 0.2% for AGIs $50k-75k, 0.6% for AGIs $100k-200k)
Net capital gain/loss in AGI: +$6,778 (reported on 4.6% of returns)
Here:
+$6,778
State:
+$13,061
(% of AGI for various income ranges: 0.8% for AGIs $25k-50k, 1.7% for AGIs $50k-75k, 1.6% for AGIs $100k-200k)
Profit/loss from business: +$5,292 (reported on 13.4% of returns)
Here:
+$5,292
State:
+$10,167
(% of AGI for various income ranges: 6.7% for AGIs below $25k, 1.1% for AGIs $25k-50k, 1.0% for AGIs $50k-75k, 1.8% for AGIs $75k-100k)
Taxable individual retirement arrangement distribution: $9,977 (reported on 6.7% of returns)
29944:
$9,977
South Carolina:
$17,019
(% of AGI for various income ranges: 1.9% for AGIs below $25k, 1.3% for AGIs $25k-50k, 2.1% for AGIs $50k-75k, 5.9% for AGIs $75k-100k)
Total itemized deductions: $17,517 (24% of AGI, reported on 18.0% of returns)
Here:
$17,517
State:
$22,890
Here:
23.9% of AGI
State:
21.4% of AGI
(% of AGI for various income ranges: 4.6% for AGIs below $25k, 6.9% for AGIs $25k-50k, 9.8% for AGIs $50k-75k, 11.0% for AGIs $75k-100k, 13.9% for AGIs $100k-200k)
Charity contributions: $4,893 (reported on 14.4% of returns)
Here:
$4,893
State:
$5,169
(% of AGI for various income ranges: 0.8% for AGIs below $25k, 1.1% for AGIs $25k-50k, 2.3% for AGIs $50k-75k, 2.9% for AGIs $75k-100k, 3.5% for AGIs $100k-200k)
Taxes paid: $5,586 (reported on 18.0% of returns)
29944:
$5,586
State:
$7,644
(% of AGI for various income ranges: 0.7% for AGIs below $25k, 1.6% for AGIs $25k-50k, 2.7% for AGIs $50k-75k, 3.8% for AGIs $75k-100k, 6.1% for AGIs $100k-200k)
Earned income credit: $2,535 (reported on 38.7% of returns)
Here:
$2,535
State:
$2,418
(% of AGI for various income ranges: 11.7% for AGIs below $25k, 2.0% for AGIs $25k-50k)
Percentage of individuals using paid preparers for their 2012 taxes: 63.4%
Here:
63%
State:
57%
(% for various income ranges: 61.2% for AGIs below $25k, 64.8% for AGIs $25k-50k, 59.1% for AGIs $50k-75k, 70.0% for AGIs $75k-100k, 80.0% for AGIs $100k-200k)
Averages for the 2004 tax year for zip code 29944, filed in 2005:
Average Adjusted Gross Income (AGI) in 2004: $29,623 (Individual Income Tax Returns)
Here:
$29,623
State:
$41,965
Salary/wage: $27,387 (reported on 89.4% of returns)
Here:
$27,387
State:
$35,695
(% of AGI for various income ranges: 100.7% for AGIs below $10k, 87.0% for AGIs $10k-25k, 88.0% for AGIs $25k-50k, 83.8% for AGIs $50k-75k, 81.0% for AGIs $75k-100k, 60.7% for AGIs over 100k)
Taxable interest for individuals: $1,027 (reported on 20.8% of returns)
This zip code:
$1,027
South Carolina:
$1,623
(% of AGI for various income ranges: 1.8% for AGIs below $10k, 0.8% for AGIs $10k-25k, 0.7% for AGIs $25k-50k, 0.4% for AGIs $50k-75k, 0.2% for AGIs $75k-100k, 1.2% for AGIs over 100k)
Taxable dividends: $1,202 (reported on 6.6% of returns)
Here:
$1,202
State:
$3,999
(% of AGI for various income ranges: 0.6% for AGIs below $10k, 0.1% for AGIs $10k-25k, 0.3% for AGIs $25k-50k, 0.2% for AGIs $50k-75k, 0.1% for AGIs $75k-100k, 0.7% for AGIs over 100k)
Net capital gain/loss: +$13,789 (reported on 5.9% of returns)
Here:
+$13,789
State:
+$13,100
(% of AGI for various income ranges: -0.8% for AGIs below $10k, -0.1% for AGIs $10k-25k, 0.4% for AGIs $25k-50k, 0.4% for AGIs $50k-75k, 4.1% for AGIs $75k-100k, 14.7% for AGIs over 100k)
Profit/loss from business: +$2,894 (reported on 12.6% of returns)
Here:
+$2,894
State:
+$9,144
(% of AGI for various income ranges: 5.7% for AGIs below $10k, 2.8% for AGIs $10k-25k, 0.5% for AGIs $25k-50k, 0.7% for AGIs $50k-75k, 1.0% for AGIs $75k-100k, 0.5% for AGIs over 100k)
IRA payment deduction: $1,875 (reported on 0.8% of returns)
29944:
$1,875
South Carolina:
$2,972
Total itemized deductions: $15,676 (24% of AGI, reported on 19.7% of returns)
Here:
$15,676
State:
$19,039
Here:
23.9% of AGI
State:
22.8% of AGI
(% of AGI for various income ranges: 4.2% for AGIs $10k-25k, 8.7% for AGIs $25k-50k, 13.2% for AGIs $50k-75k, 15.4% for AGIs $75k-100k, 16.0% for AGIs over 100k)
Charity contributions deductions: $3,805 (6% of AGI, reported on 17.2% of returns)
Here:
$3,805
State:
$4,305
Here:
5.7% of AGI
State:
5.0% of AGI
(% of AGI for various income ranges: 0.6% for AGIs $10k-25k, 1.6% for AGIs $25k-50k, 3.2% for AGIs $50k-75k, 4.2% for AGIs $75k-100k, 2.8% for AGIs over 100k)
Total tax: $3,719 (reported on 58.2% of returns)
29944:
$3,719
State:
$6,497
(% of AGI for various income ranges: 2.1% for AGIs below $10k, 2.3% for AGIs $10k-25k, 5.7% for AGIs $25k-50k, 8.4% for AGIs $50k-75k, 9.5% for AGIs $75k-100k, 14.9% for AGIs over 100k)
Earned income credit: $2,024 (reported on 36.8% of returns)
Here:
$2,024
State:
$1,882
Percentage of individuals using paid preparers for their 2004 taxes: 73.7%
Here:
74%
State:
66%
(% for various income ranges: 68.6% for AGIs below $10k, 78.3% for AGIs $10k-25k, 72.1% for AGIs $25k-50k, 70.6% for AGIs $50k-75k, 80.0% for AGIs $75k-100k, 78.2% for AGIs over 100k)
Household received Food Stamps/SNAP in the past 12 months: 430 Household did not receive Food Stamps/SNAP in the past 12 months: 1,252
Women who had a birth in the past 12 months: 45 (38 now married, 8 unmarried) Women who did not have a birth in the past 12 months: 723 (397 now married, 329 unmarried)
Housing units in zip code 29944 with a mortgage: 397 Houses without a mortgage: 18
Median monthly owner costs for units with a mortgage: $1,019 Median monthly owner costs for units without a mortgage: $336
Residents with income below the poverty level in 2022:
This zip code:
15.7%
Whole state:
14.0%
Residents with income below 50% of the poverty level in 2022:
This zip code:
8.0%
Whole state:
7.3%
Median number of rooms in houses and condos:
Here:
6.1
State:
6.4
Median number of rooms in apartments:
Here:
4.7
State:
4.5
Notable locations in this zip code not listed on our city pages
Notable locations in zip code 29944: Airport Industrial Park (A), Shumans Store (B), Varnville Town Hall (C), Varnville Fire Department Station 60 (D), Jasper County Fire Department Grays (E), Cummings Fire Department Station 90 (F), Varnville Police Department (G), Hampton County Sheriff's Office (H). Display/hide their locations on the map
Churches in zip code 29944 include: Deep Branch Church (A), Varnville First Baptist Church (B), Samaritan Baptist Church (C), Huggin Oak Church of God (D), Antioch Christian Church (E), Mill Creek Church (F), Antioch Church (G), Camp Barnach Church (H), Sand Hill Church (I). Display/hide their locations on the map
Streams, rivers, and creeks: Cowpen Branch (A), Elbo Creek (B), Alligator Creek (C), Sanders Branch (D), Mill Creek (E), House Fork (F), Camp Branch (G), Tennants Branch (H), Cedar Branch (I). Display/hide their locations on the map
In group quarters: 67 (-1 institutionalized population)
Size of family households: 661 2-persons, 156 3-persons, 107 4-persons, 191 5-persons, 23 6-persons, 33 7-or-more-persons
Size of nonfamily households: 467 1-person, 22 2-persons, 15 5-persons
801 married couples with children.
273 single-parent households (69 men, 204 women).
89.4% of residents of 29944 zip code speak English at home.
7.7% of residents speak Spanish at home (38% very well, 5% well, 37% not well, 21% not at all).
0.5% of residents speak other Indo-European language at home (81% very well, 19% not well).
1.1% of residents speak Asian or Pacific Island language at home (49% very well, 51% not well).
Foreign born population: 312 (6.9%) (14.0% of them are naturalized citizens)
This zip code:
6.9%
Whole state:
5.2%
77%Honduras
7%Malaysia
4%Sudan
2%Thailand
2%France
11%American
7%European
5%English
3%German
2%Scottish
2%Eastern European
1%Italian
Year of entry for the foreign-born population
1182010 or later
2262000 to 2009
01990 to 1999
25Before 1990
Facilities with environmental interests located in this zip code:
CARSONITE INTERNATIONAL CORPORATION (1101 MAIN ST. in VARNVILLE, SC)
AIR MAJOR (AIRS/AFS) CRITERIA AND HAZARDOUS AIR POLLUTANT INVENTORY (Inventory of air pollution sources) HAZARDOUS WASTE BIENNIAL REPORTER (Resource Conservation and Recovery Act (tracking hazardous waste)) Large Quantity Generators, more that 1000 kg of hazardous waste/month (Resource Conservation and Recovery Act (tracking hazardous waste)) STATE MASTER (South Carolina database) - AIR MAJOR, AIR PROGRAM, TRI REPORTER, HAZARDOUS WASTE PROGRAM TRI REPORTER (Tracking of toxic chemicals releasing facilities) Business SIC classification: PLASTICS PRODUCTS Business NAICS classification: ALL OTHER PLASTICS PRODUCT MANUFACTURING.; ALL OTHER PLASTICS PRODUCT MANUFACTURING.
Housing units lacking complete plumbing facilities: 3.0% Housing units lacking complete kitchen facilities: 3.2%
78.6%Electricity
10.9%Bottled, tank, or LP gas
6.1%Utility gas
3.6%No fuel used
1.1%Fuel oil, kerosene, etc.
Population in 1990: 1,890. Population change in the 1990s: +2,711 (+143.4%).
Place of birth for U.S.-born residents:
This state: 3,263
Northeast: 221
Midwest: 141
South: 371
West: 104
70% of the 29944 zip code residents lived in the same house 5 years ago. Out of people who lived in different houses, 65% lived in this county. Out of people who lived in different counties, 50% lived in South Carolina.
88% of the 29944 zip code residents lived in the same house 1 year ago. Out of people who lived in different houses, 22% moved from this county. Out of people who lived in different houses, 70% moved from different county within same state. Out of people who lived in different houses, 5% moved from different state. Out of people who lived in different houses, 3% moved from abroad.
Private vs. public school enrollment:
Students in private schools in grades 1 to 8 (elementary and middle school): 32
Here:
5.8%
South Carolina:
14.4%
Students in private schools in grades 9 to 12 (high school): 8
Here:
6.0%
South Carolina:
11.1%
Students in private undergraduate colleges: 24
Here:
14.4%
South Carolina:
21.9%
Occupation by median earnings in the past 12 months ($)
62,156Installation, maintenance, and repair occupations
59,160Management occupations
57,572Personal care and service occupations
55,336Fire fighting and prevention, and other protective service workers including supervisors
48,431Education, training, and library occupations
44,573Community and social service occupations
Companies with federal contracts located in this zip code:
AMERICAN MACHINING AND MFG (1412 YEMASSEE HWY in VARNVILLE, SC) : $52,744 in 5 contractsfrom 2004 to 2006
Contracts for Athletic and Sporting Equipment, Recreational and Gymnastic Equipment, Pipe and Conduit, Nonmetallic by Navy, Army Signed by year:2000: $0; 2001: $0; 2002: $0; 2003: $0; 2004: $24,025; 2005: $22,806; 2006: $5,913.
Biggest contracts:
$24,025 with Navy for Athletic and Sporting Equipment. Signed on 2004-09-23. Completion date: 2004-10-25.
$12,331 with Navy for Recreational and Gymnastic Equipment. Signed on 2005-09-08. Completion date: 2005-09-30.
$6,296 with Navy for Pipe and Conduit, Nonmetallic. Signed on 2005-09-20. Completion date: 2005-10-15.
$5,913 with Army for Athletic and Sporting Equipment. Taking place in KS. Signed on 2006-05-11. Completion date: 2006-05-12.
Top industries in this zip code by the number of employees in 2005:
Health Care and Social Assistance: General Medical and Surgical Hospitals (100-249 employees: 1 establishment)
Accommodation and Food Services: Full-Service Restaurants (20-49: 1, 10-19: 1)
Health Care and Social Assistance: Vocational Rehabilitation Services (20-49: 1)
Health Care and Social Assistance: Residential Mental Retardation Facilities (20-49: 1)
Health Care and Social Assistance: Offices of Physicians (except Mental Health Specialists) (10-19: 2, 1-4: 1)
Health Care and Social Assistance: Child Day Care Services (10-19: 1, 1-4: 2)
Construction: Plumbing, Heating, and Air-Conditioning Contractors (10-19: 1, 1-4: 1)
People in group quarters in 2010:
56 people in local jails and other municipal confinement facilities
14 people in group homes intended for adults
Fatal accident statistics in 2014:
Fatal accident count: 3
Vehicles involved in fatal accidents: 3
Fatal accidents caused by drunken drivers: 1
Fatalities: 3
Persons involved in fatal accidents: 7
Pedestrians involved in fatal accidents: 0
Fatal accident statistics in 2012:
Fatal accident count: 1
Vehicles involved in fatal accidents: 2
Fatal accidents caused by drunken drivers: 0
Fatalities: 1
Persons involved in fatal accidents: 1
Pedestrians involved in fatal accidents: 1
2003 - 2018 National Fire Incident Reporting System (NFIRS) incidents
Based on the data from the years 2003 - 2018 the average number of fire incidents per year is 27. The highest number of reported fires - 57 took place in 2011, and the least - 2 in 2003. The data has an increasing trend.
When looking into fire subcategories, the most reports belonged to: Outside Fires (45.8%), and Structure Fires (43.5%).
Fire incident types reported to NFIRS in Zip Code 29944


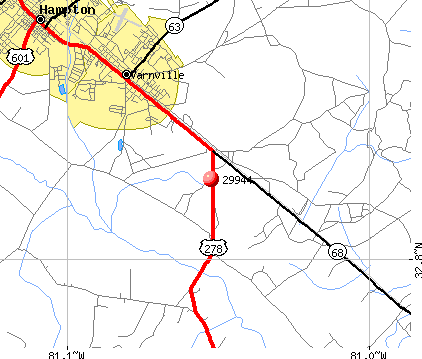 Nearest zip codes: 29916, 29924, 29929, 29921, 29911, 29934.


 Based on the data from the years 2003 - 2018 the average number of fire incidents per year is 27. The highest number of reported fires - 57 took place in 2011, and the least - 2 in 2003. The data has an increasing trend.
 When looking into fire subcategories, the most reports belonged to: Outside Fires (45.8%), and Structure Fires (43.5%).