Estimated zip code population in 2022: 26,630 Zip code population in 2010: 23,680 Zip code population in 2000: 25,063
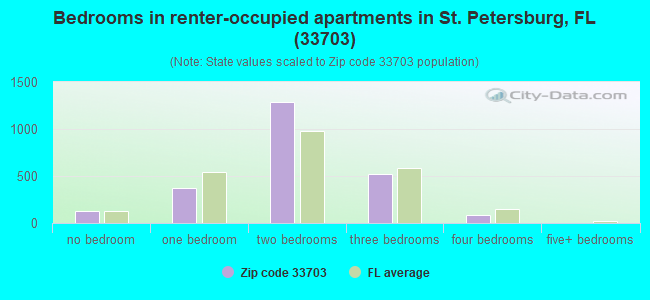
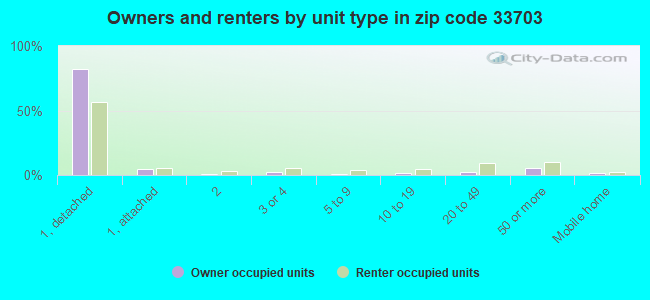
Houses and condos: 12,580 Renter-occupied apartments: 2,398
% of renters here:
21%
State:
33%
March 2022 cost of living index in zip code 33703: 98.6 (near average, U.S. average is 100)
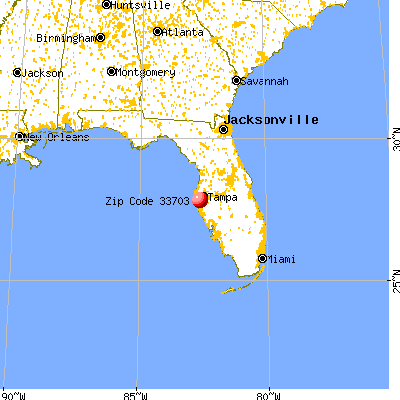
Land area: 5.2 sq. mi. Water area: 1.7 sq. mi.
Population density: 5,099 people per square mile
(average).
OSM Map
General Map
Google Map
MSN Map
OSM Map
General Map
Google Map
MSN Map
OSM Map
General Map
Google Map
MSN Map
OSM Map
General Map
Google Map
MSN Map
Please wait while loading the map...
Real estate property taxes paid for housing units in 2022:
This zip code:
0.6% ($2,855)
Florida:
0.7% ($2,529)
Median real estate property taxes paid for housing units with mortgages in 2022: $3,239 (0.7%) Median real estate property taxes paid for housing units with no mortgage in 2022: $2,304 (0.6%)
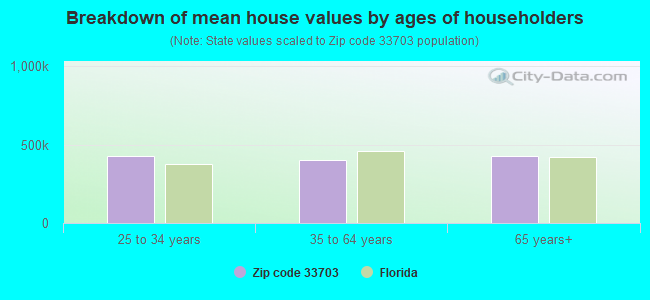
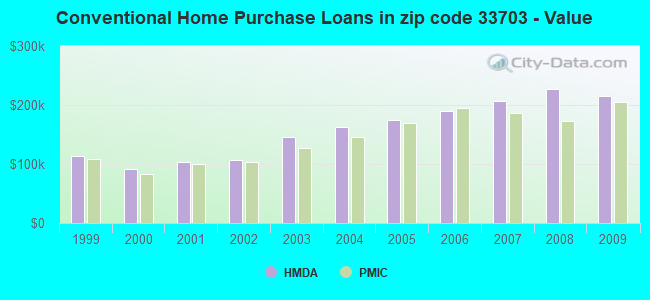
Estimated median house/condo value in 2022: $452,744
33703:
$452,744
Florida:
$354,100
According to our research of Florida and other state lists, there were 28 registered sex offenders living in 33703 zip code as of April 19, 2024. The ratio of all residents to sex offenders in zip code 33703 is 875 to 1. The ratio of registered sex offenders to all residents in this zip code is lower than the state average.
Median resident age:
This zip code:
43.8 years
Florida median age:
42.7 years
Average household size:
This zip code:
2.3 people
Florida:
2.5 people
Averages for the 2020 tax year for zip code 33703, filed in 2021:
Average Adjusted Gross Income (AGI) in 2020: $114,068 (Individual Income Tax Returns)
Here:
$114,068
State:
$82,200
Salary/wage: $89,905 (reported on 79.6% of returns)
Here:
$89,905
State:
$58,347
(% of AGI for various income ranges: 1162.7% for AGIs below $25k, 3750.0% for AGIs $25k-50k, 6626.2% for AGIs $50k-75k, 9996.8% for AGIs $75k-100k, 18831.8% for AGIs $100k-200k, 98221.8% for AGIs over 200k)
Taxable interest for individuals: $2,783 (reported on 35.2% of returns)
This zip code:
$2,783
Florida:
$4,272
(% of AGI for various income ranges: 28.4% for AGIs below $25k, 27.7% for AGIs $25k-50k, 62.9% for AGIs $50k-75k, 106.0% for AGIs $75k-100k, 215.9% for AGIs $100k-200k, 1680.2% for AGIs over 200k)
Ordinary dividends: $9,289 (reported on 30.4% of returns)
Here:
$9,289
State:
$15,863
(% of AGI for various income ranges: 65.3% for AGIs below $25k, 77.9% for AGIs $25k-50k, 165.6% for AGIs $50k-75k, 327.7% for AGIs $75k-100k, 531.1% for AGIs $100k-200k, 5225.5% for AGIs over 200k)
Net capital gain/loss in AGI: +$46,245 (reported on 28.2% of returns)
Here:
+$46,245
State:
+$62,983
(% of AGI for various income ranges: 24.6% for AGIs below $25k, 52.6% for AGIs $25k-50k, 153.5% for AGIs $50k-75k, 324.4% for AGIs $75k-100k, 875.7% for AGIs $100k-200k, 36344.0% for AGIs over 200k)
Profit/loss from business: +$17,203 (reported on 17.6% of returns)
Here:
+$17,203
State:
+$9,719
(% of AGI for various income ranges: 171.5% for AGIs below $25k, 181.1% for AGIs $25k-50k, 191.2% for AGIs $50k-75k, 314.5% for AGIs $75k-100k, 683.0% for AGIs $100k-200k, 4272.8% for AGIs over 200k)
Taxable individual retirement arrangement distribution: $24,701 (reported on 11.2% of returns)
33703:
$24,701
Florida:
$24,823
(% of AGI for various income ranges: 86.5% for AGIs below $25k, 128.9% for AGIs $25k-50k, 249.4% for AGIs $50k-75k, 497.0% for AGIs $75k-100k, 813.2% for AGIs $100k-200k, 3191.8% for AGIs over 200k)
Self-employed (Keogh) retirement plans: $26,456 (reported on 0.7% of returns)
33703:
$26,456
Florida:
$29,694
(% of AGI for various income ranges: 40.9% for AGIs $100k-200k, 468.5% for AGIs over 200k)
Total itemized deductions: $37,883 (reported on 12.1% of returns)
Here:
$37,883
State:
$45,393
(% of AGI for various income ranges: 65.7% for AGIs below $25k, 94.5% for AGIs $25k-50k, 265.7% for AGIs $50k-75k, 496.1% for AGIs $75k-100k, 992.0% for AGIs $100k-200k, 8580.0% for AGIs over 200k)
Charity contributions: $13,981 (reported on 9.5% of returns)
Here:
$13,981
State:
$20,178
(% of AGI for various income ranges: 2.8% for AGIs below $25k, 9.7% for AGIs $25k-50k, 30.2% for AGIs $50k-75k, 59.0% for AGIs $75k-100k, 181.3% for AGIs $100k-200k, 3286.2% for AGIs over 200k)
Taxes paid: $7,496 (reported on 11.8% of returns)
33703:
$7,496
State:
$6,967
(% of AGI for various income ranges: 8.5% for AGIs below $25k, 16.5% for AGIs $25k-50k, 58.6% for AGIs $50k-75k, 117.9% for AGIs $75k-100k, 229.7% for AGIs $100k-200k, 1495.5% for AGIs over 200k)
Earned income credit: $1,745 (reported on 9.5% of returns)
Here:
$1,745
State:
$2,306
(% of AGI for various income ranges: 63.2% for AGIs below $25k, 37.2% for AGIs $25k-50k)
Percentage of individuals using paid preparers for their 2020 taxes: 92.1%
Here:
92%
State:
92%
(% for various income ranges: 89.7% for AGIs below $25k, 92.2% for AGIs $25k-50k, 93.2% for AGIs $50k-75k, 92.6% for AGIs $75k-100k, 93.0% for AGIs $100k-200k, 94.1% for AGIs over 200k)
Averages for the 2012 tax year for zip code 33703, filed in 2013:
Average Adjusted Gross Income (AGI) in 2012: $72,491 (Individual Income Tax Returns)
Here:
$72,491
State:
$60,316
Salary/wage: $62,573 (reported on 81.2% of returns)
Here:
$62,573
State:
$45,277
(% of AGI for various income ranges: 70.0% for AGIs below $25k, 79.7% for AGIs $25k-50k, 77.8% for AGIs $50k-75k, 75.6% for AGIs $75k-100k, 74.0% for AGIs $100k-200k, 60.6% for AGIs over 200k)
Taxable interest for individuals: $2,167 (reported on 36.6% of returns)
This zip code:
$2,167
Florida:
$3,587
(% of AGI for various income ranges: 2.0% for AGIs below $25k, 0.8% for AGIs $25k-50k, 1.2% for AGIs $50k-75k, 0.8% for AGIs $75k-100k, 0.9% for AGIs $100k-200k, 1.2% for AGIs over 200k)
Ordinary dividends: $7,139 (reported on 26.1% of returns)
Here:
$7,139
State:
$12,831
(% of AGI for various income ranges: 2.9% for AGIs below $25k, 1.8% for AGIs $25k-50k, 2.0% for AGIs $50k-75k, 1.9% for AGIs $75k-100k, 2.2% for AGIs $100k-200k, 3.4% for AGIs over 200k)
Net capital gain/loss in AGI: +$13,300 (reported on 21.8% of returns)
Here:
+$13,300
State:
+$33,493
(% of AGI for various income ranges: 0.1% for AGIs below $25k, 0.6% for AGIs $25k-50k, 0.5% for AGIs $50k-75k, 0.8% for AGIs $75k-100k, 1.5% for AGIs $100k-200k, 9.3% for AGIs over 200k)
Profit/loss from business: +$13,297 (reported on 15.3% of returns)
Here:
+$13,297
State:
+$10,012
(% of AGI for various income ranges: 7.7% for AGIs below $25k, 2.9% for AGIs $25k-50k, 2.6% for AGIs $50k-75k, 2.3% for AGIs $75k-100k, 2.4% for AGIs $100k-200k, 2.5% for AGIs over 200k)
Taxable individual retirement arrangement distribution: $20,021 (reported on 11.6% of returns)
33703:
$20,021
Florida:
$21,544
(% of AGI for various income ranges: 4.0% for AGIs below $25k, 2.5% for AGIs $25k-50k, 2.9% for AGIs $50k-75k, 3.8% for AGIs $75k-100k, 3.8% for AGIs $100k-200k, 2.9% for AGIs over 200k)
Self-employment retirement plans: $19,214 (reported on 0.6% of returns)
33703:
$19,214
Florida:
$20,611
Total itemized deductions: $22,225 (15% of AGI, reported on 30.0% of returns)
Here:
$22,225
State:
$25,533
Here:
15.1% of AGI
State:
18.0% of AGI
(% of AGI for various income ranges: 9.0% for AGIs below $25k, 8.5% for AGIs $25k-50k, 9.5% for AGIs $50k-75k, 10.2% for AGIs $75k-100k, 10.9% for AGIs $100k-200k, 8.0% for AGIs over 200k)
Charity contributions: $4,276 (reported on 24.0% of returns)
Here:
$4,276
State:
$5,698
(% of AGI for various income ranges: 0.5% for AGIs below $25k, 0.9% for AGIs $25k-50k, 1.1% for AGIs $50k-75k, 1.2% for AGIs $75k-100k, 1.7% for AGIs $100k-200k, 1.7% for AGIs over 200k)
Taxes paid: $5,699 (reported on 29.5% of returns)
33703:
$5,699
State:
$6,203
(% of AGI for various income ranges: 1.4% for AGIs below $25k, 1.5% for AGIs $25k-50k, 2.0% for AGIs $50k-75k, 2.3% for AGIs $75k-100k, 2.8% for AGIs $100k-200k, 2.5% for AGIs over 200k)
Earned income credit: $1,855 (reported on 13.5% of returns)
Here:
$1,855
State:
$2,372
(% of AGI for various income ranges: 4.4% for AGIs below $25k, 0.7% for AGIs $25k-50k)
Percentage of individuals using paid preparers for their 2012 taxes: 47.4%
Here:
47%
State:
54%
(% for various income ranges: 43.2% for AGIs below $25k, 41.1% for AGIs $25k-50k, 45.7% for AGIs $50k-75k, 50.5% for AGIs $75k-100k, 57.4% for AGIs $100k-200k, 77.1% for AGIs over 200k)
Averages for the 2004 tax year for zip code 33703, filed in 2005:
Average Adjusted Gross Income (AGI) in 2004: $57,315 (Individual Income Tax Returns)
Here:
$57,315
State:
$50,523
Salary/wage: $50,583 (reported on 81.2% of returns)
Here:
$50,583
State:
$39,563
(% of AGI for various income ranges: 144.2% for AGIs below $10k, 73.0% for AGIs $10k-25k, 81.1% for AGIs $25k-50k, 77.1% for AGIs $50k-75k, 75.2% for AGIs $75k-100k, 64.6% for AGIs over 100k)
Taxable interest for individuals: $2,173 (reported on 49.0% of returns)
This zip code:
$2,173
Florida:
$3,211
(% of AGI for various income ranges: 12.5% for AGIs below $10k, 3.6% for AGIs $10k-25k, 1.7% for AGIs $25k-50k, 1.8% for AGIs $50k-75k, 1.9% for AGIs $75k-100k, 1.5% for AGIs over 100k)
Taxable dividends: $3,670 (reported on 30.2% of returns)
Here:
$3,670
State:
$6,129
(% of AGI for various income ranges: 9.5% for AGIs below $10k, 2.6% for AGIs $10k-25k, 1.7% for AGIs $25k-50k, 1.7% for AGIs $50k-75k, 1.7% for AGIs $75k-100k, 1.9% for AGIs over 100k)
Net capital gain/loss: +$12,124 (reported on 25.8% of returns)
Here:
+$12,124
State:
+$27,205
(% of AGI for various income ranges: -8.4% for AGIs below $10k, 0.2% for AGIs $10k-25k, 0.8% for AGIs $25k-50k, 1.2% for AGIs $50k-75k, 2.3% for AGIs $75k-100k, 10.0% for AGIs over 100k)
Profit/loss from business: +$12,230 (reported on 14.0% of returns)
Here:
+$12,230
State:
+$10,634
(% of AGI for various income ranges: 12.1% for AGIs below $10k, 5.3% for AGIs $10k-25k, 2.7% for AGIs $25k-50k, 2.8% for AGIs $50k-75k, 2.3% for AGIs $75k-100k, 2.8% for AGIs over 100k)
IRA payment deduction: $3,105 (reported on 3.5% of returns)
33703:
$3,105
Florida:
$3,082
(% of AGI for various income ranges: 0.7% for AGIs below $10k, 0.3% for AGIs $10k-25k, 0.3% for AGIs $25k-50k, 0.2% for AGIs $50k-75k, 0.2% for AGIs $75k-100k, 0.1% for AGIs over 100k)
Self-employed pension: $12,450 (reported on 0.9% of returns)
Here:
$12,450
Florida:
$15,857
Total itemized deductions: $18,428 (19% of AGI, reported on 36.1% of returns)
Here:
$18,428
State:
$20,370
Here:
18.9% of AGI
State:
20.7% of AGI
(% of AGI for various income ranges: 21.4% for AGIs below $10k, 10.6% for AGIs $10k-25k, 12.2% for AGIs $25k-50k, 13.2% for AGIs $50k-75k, 13.4% for AGIs $75k-100k, 10.5% for AGIs over 100k)
Charity contributions deductions: $3,297 (3% of AGI, reported on 29.8% of returns)
Here:
$3,297
State:
$4,064
Here:
3.1% of AGI
State:
3.8% of AGI
(% of AGI for various income ranges: 1.0% for AGIs below $10k, 0.9% for AGIs $10k-25k, 1.1% for AGIs $25k-50k, 1.6% for AGIs $50k-75k, 1.9% for AGIs $75k-100k, 2.1% for AGIs over 100k)
Total tax: $10,365 (reported on 79.9% of returns)
33703:
$10,365
State:
$9,431
(% of AGI for various income ranges: 4.1% for AGIs below $10k, 4.4% for AGIs $10k-25k, 7.5% for AGIs $25k-50k, 9.7% for AGIs $50k-75k, 11.4% for AGIs $75k-100k, 20.5% for AGIs over 100k)
Earned income credit: $1,524 (reported on 10.4% of returns)
Here:
$1,524
State:
$1,808
Percentage of individuals using paid preparers for their 2004 taxes: 52.3%
Here:
52%
State:
60%
(% for various income ranges: 48.1% for AGIs below $10k, 53.4% for AGIs $10k-25k, 48.8% for AGIs $25k-50k, 50.0% for AGIs $50k-75k, 53.0% for AGIs $75k-100k, 65.0% for AGIs over 100k)
Likely homosexual households (counted as self-reported same-sex unmarried-partner households)
Lesbian couples: 0.4% of all households
Gay men: 1.1% of all households
Household received Food Stamps/SNAP in the past 12 months: 500 Household did not receive Food Stamps/SNAP in the past 12 months: 11,195
Women who had a birth in the past 12 months: 349 (141 now married, 196 unmarried) Women who did not have a birth in the past 12 months: 6,030 (2,989 now married, 3,042 unmarried)
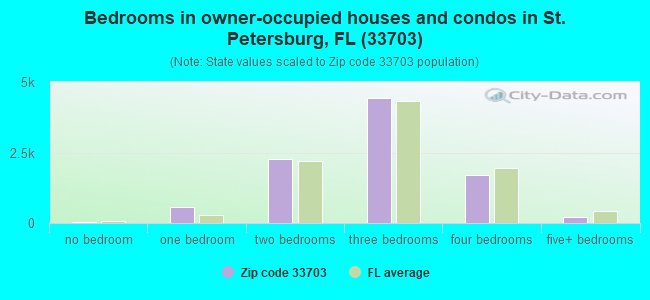
Housing units in zip code 33703 with a mortgage: 5,470 (600 second mortgage, 496 both second mortgage and home equity loan) Houses without a mortgage: 111
Median monthly owner costs for units with a mortgage: $2,209 Median monthly owner costs for units without a mortgage: $705
Residents with income below the poverty level in 2022:
This zip code:
5.0%
Whole state:
12.7%
Residents with income below 50% of the poverty level in 2022:
This zip code:
1.7%
Whole state:
6.6%
Median number of rooms in houses and condos:
Here:
5.9
State:
5.9
Median number of rooms in apartments:
Here:
4.7
State:
4.2
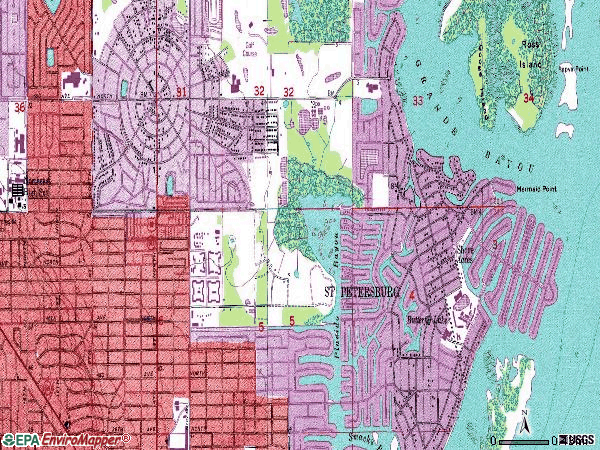
Notable locations in this zip code not listed on our city pages
Churches in zip code 33703 include: Allendale United Methodist Church (A), Northeast Christian Church (B), Northeast Presbyterian Church (C), Liberty Baptist Church (D), North East Park Baptist Church (E). Display/hide their locations on the map
Parks in zip code 33703 include: Arrowhead Park (1), Denver Park (2), Edgemoor Park (3), Franklin Heights Park (4), Harding Park (5), Jack Puryear Park (6), Pocket Park (7), Roberts Park (8), Shore Acres Mini Park (9). Display/hide their locations on the map
3,564 married couples with children.
914 single-parent households (168 men, 746 women).
87.3% of residents of 33703 zip code speak English at home.
5.6% of residents speak Spanish at home (63% very well, 26% well, 8% not well, 3% not at all).
4.5% of residents speak other Indo-European language at home (74% very well, 18% well, 7% not well).
1.9% of residents speak Asian or Pacific Island language at home (53% very well, 30% well, 17% not well).
0.5% of residents speak other language at home (66% very well, 34% not well).
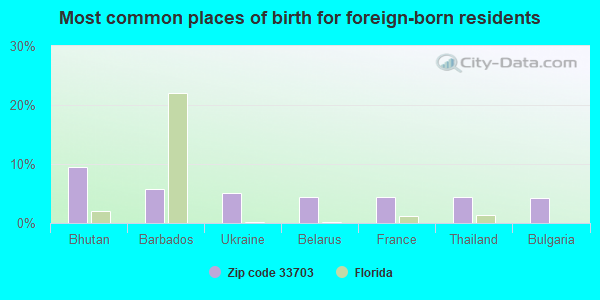
Foreign born population: 2,261 (8.5%) (70.9% of them are naturalized citizens)
This zip code:
8.5%
Whole state:
21.7%
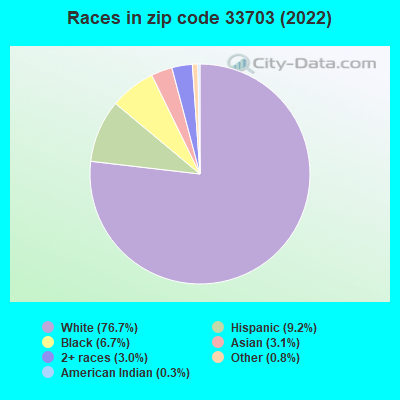
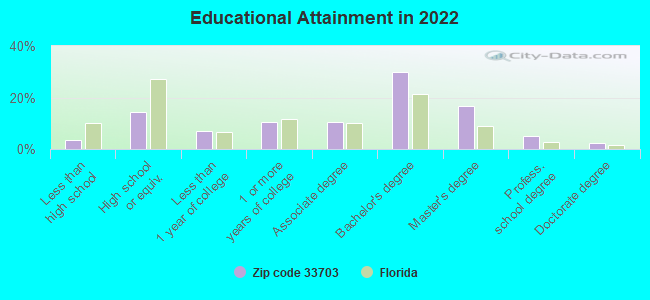
10%Bhutan
6%Barbados
5%Ukraine
4%Belarus
4%France
4%Thailand
4%Bulgaria
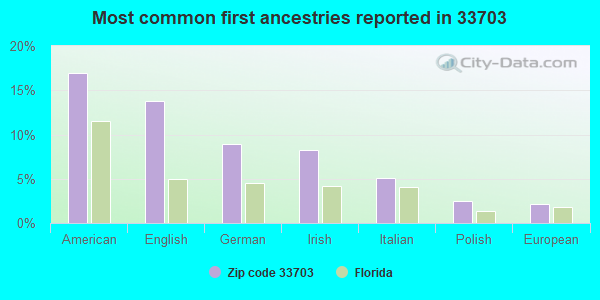
17%American
14%English
9%German
8%Irish
5%Italian
2%Polish
2%European
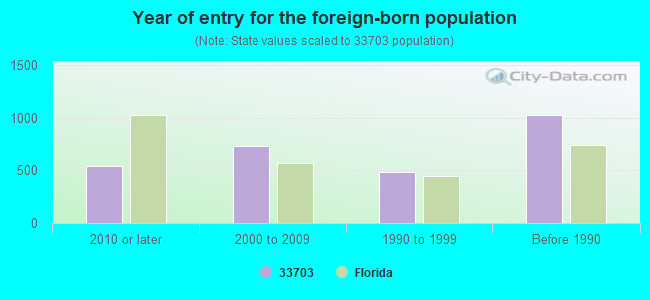
Year of entry for the foreign-born population
5412010 or later
7312000 to 2009
4841990 to 1999
1,027Before 1990
Facilities with environmental interests located in this zip code:
MEADOWLAWN MIDDLE SCHOOL (6050 16TH STREET, N. in ST. PETERSBURG, FL)
(Geographic Names Information System) (National Center for Education Statistics) - STATE ID-2321 Organizations: PINELLAS COUNTY SCHOOL DISTRICT (SCHOOL DISTRICT)
NORTHEAST HIGH SCHOOL (5500 16TH STREET, NORTH in ST PETERSBURG, FL)
(Geographic Names Information System) (National Center for Education Statistics) - STATE ID-2641 Organizations: PINELLAS COUNTY SCHOOL DISTRICT (SCHOOL DISTRICT)
JBV INC (5427 4TH STREET N in SAINT PETERSBURG, FL)
AIR MINOR (AIRS/AFS) Small Quantity Generators, between 100 kg and 1000 kg of hazardous waste/month (Resource Conservation and Recovery Act (tracking hazardous waste)) - notification Business SIC classification: DRYCLEANING PLANTS, EXCEPT RUG CLEANING Organizations: WAGNER MICHAEL PRES (CONTACT/OWNER)
Alternative names: ELITE DRY CLEANERS INC
SHORE ACRES ELEMENTARY SCHOOL (1800 62ND AVENUE N.E. in ST. PETERSBURG, FL)
National Pollutant Discharge Elimination System NON-MAJOR (Tracking pollutant discharge elimination systems) - permit Organizations: HOWARD HINSLEY (CONTACT/OWNER)
CIRCLE K #8622 (1598 54TH AVE N in ST PETERSBURG, FL)
(Resource Conservation and Recovery Act (tracking hazardous waste)) Organizations: STEVE BELIN, COMPLIANCE MGR (CONTACT/OWNER)
PACER INC (6111 10TH STREET NORTH in ST PETERSBURG, FL)
AIR MINOR (AIRS/AFS) Business SIC classification: DRYCLEANING PLANTS, EXCEPT RUG CLEANING
SHORECREST PREP SCHOOL INC (5101 1ST STREET N in SAINT PETERSBURG, FL)
COMPLIANCE ACTIVITY (Tracking inspections of insecticide, fungicide, and rodenticide, and toxic substances) Small Quantity Generators, between 100 kg and 1000 kg of hazardous waste/month (Resource Conservation and Recovery Act (tracking hazardous waste)) - notification Organizations: JAMES B BARTLETT (CONTACT/OWNER)
Alternative names: SHORECREST PREPARATORY SCHOOL
KENS CLEANERS & LAUNDRY (5317 16 ST NORTH in ST PETERSBURG, FL)
Small Quantity Generators, between 100 kg and 1000 kg of hazardous waste/month (Resource Conservation and Recovery Act (tracking hazardous waste)) - notification Organizations: ALFRED BLAINE (CONTACT/OWNER)
MIDAS MUFFLER (5844 4TH ST N in ST PETERSBURG, FL)
Small Quantity Generators, between 100 kg and 1000 kg of hazardous waste/month (Resource Conservation and Recovery Act (tracking hazardous waste)) - notification Organizations: ED GORECKI, SAFETY DIR (CONTACT/OWNER)
MIKES MOBIL SS# H8D (101 40TH AVE N in ST PETERSBURG, FL)
Small Quantity Generators, between 100 kg and 1000 kg of hazardous waste/month (Resource Conservation and Recovery Act (tracking hazardous waste)) - notification Organizations: M MORAN (CONTACT/OWNER)
SHORECREST PREPARATORY SCHOOL (5201 1ST STREET N.E. in SAINT PETERSBURG, FL)
COMPLIANCE ACTIVITY (Tracking inspections of insecticide, fungicide, and rodenticide, and toxic substances)
Housing units lacking complete plumbing facilities: 0.2% Housing units lacking complete kitchen facilities: 1.1%
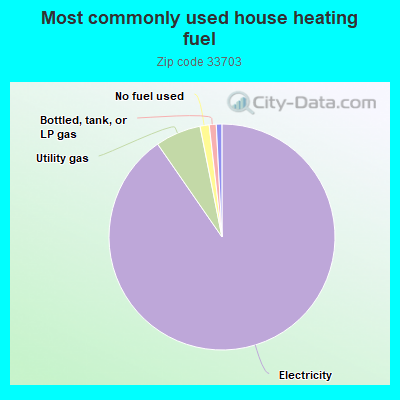
90.0%Electricity
6.5%Utility gas
1.3%No fuel used
1.0%Bottled, tank, or LP gas
0.8%Solar energy
Population in 1990: 23,348. Population change in the 1990s: +1,715 (+7.3%).
Place of birth for U.S.-born residents:
This state: 10,637
Northeast: 5,029
Midwest: 3,765
South: 3,116
West: 1,074
55% of the 33703 zip code residents lived in the same house 5 years ago. Out of people who lived in different houses, 62% lived in this county. Out of people who lived in different counties, 50% lived in Florida.
88% of the 33703 zip code residents lived in the same house 1 year ago. Out of people who lived in different houses, 49% moved from this county. Out of people who lived in different houses, 20% moved from different county within same state. Out of people who lived in different houses, 20% moved from different state. Out of people who lived in different houses, 10% moved from abroad.
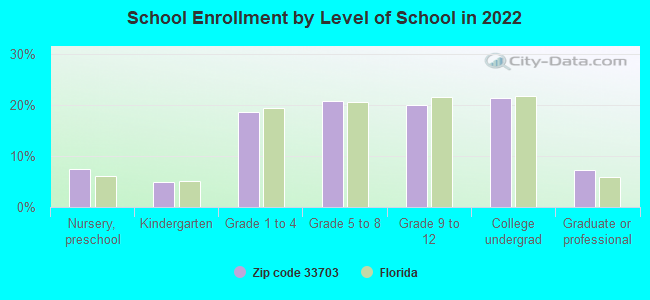
Private vs. public school enrollment:
Students in private schools in grades 1 to 8 (elementary and middle school): 752
Here:
33.3%
Florida:
15.8%
Students in private schools in grades 9 to 12 (high school): 294
Here:
25.8%
Florida:
12.9%
Students in private undergraduate colleges: 146
Here:
12.2%
Florida:
23.6%
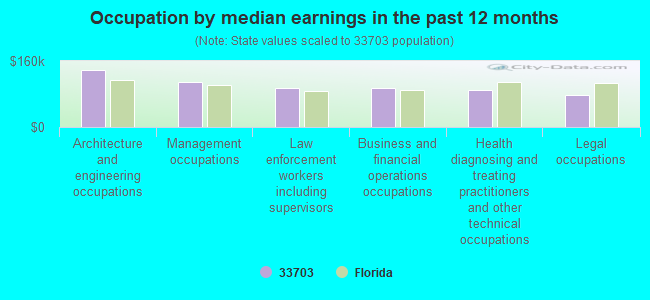
Occupation by median earnings in the past 12 months ($)
137,363Architecture and engineering occupations
108,882Management occupations
94,779Law enforcement workers including supervisors
94,663Business and financial operations occupations
89,940Health diagnosing and treating practitioners and other technical occupations
78,445Legal occupations
Companies with federal contracts located in this zip code:
ALLUVION TECHNOLOGIES (4218 HUNTINGTON STREET NE in SAINT PETERSBU, FL; small business) : $95,891 in 7 contractsfrom 2002 to 2006
Contracts for Resistors, Coils and Transformers, Headsets, Handsets, Microphones and Speakers, Semiconductor Devices and Associated Hardware, and moreby Defense Logistics Agency Signed by year:2000: $0; 2001: $0; 2002: $54,530; 2003: $0; 2004: $0; 2005: $31,639; 2006: $9,722.
Biggest contracts:
$54,530 with Defense Logistics Agency for Resistors. Signed on 2002-07-12. Completion date: 2003-06-27.
$13,318, same as above.Signed on 2005-06-13. Completion date: 2005-07-23.
$7,885 with Defense Logistics Agency for Coils and Transformers. Signed on 2005-12-20. Completion date: 2006-01-19.
$5,389 with Defense Logistics Agency for Headsets, Handsets, Microphones and Speakers. Signed on 2005-11-22. Completion date: 2005-12-28.
FCF SHOTBLASTING INC (3760 ARKANSAS AVE NE in SAINT PETERSBU, FL; small business)
$10,500 with Air Force for Construction of Structures and Facilities -- Miscellaneous Buildings. Signed on 2005-01-07. Completion date: 2005-01-16.
Top industries in this zip code by the number of employees in 2005:
2002 - 2018 National Fire Incident Reporting System (NFIRS) incidents
Based on the data from the years 2002 - 2018 the average number of fires per year is 56. The highest number of reported fire incidents - 88 took place in 2005, and the least - 31 in 2014. The data has a declining trend.
When looking into fire subcategories, the most reports belonged to: Outside Fires (37.9%), and Structure Fires (35.7%).
Fire incident types reported to NFIRS in Zip Code 33703


 Nearest zip codes: 33704, 33702, 33701, 33714, 33713, 33716.


 Based on the data from the years 2002 - 2018 the average number of fires per year is 56. The highest number of reported fire incidents - 88 took place in 2005, and the least - 31 in 2014. The data has a declining trend.
 When looking into fire subcategories, the most reports belonged to: Outside Fires (37.9%), and Structure Fires (35.7%).