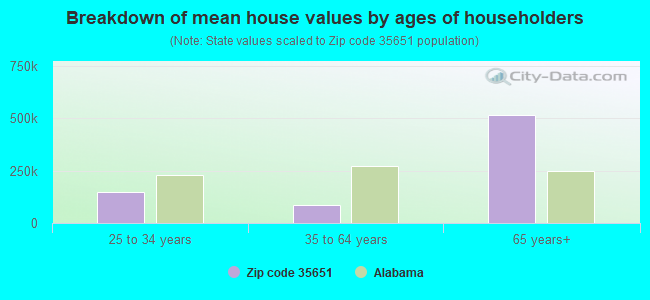
Estimated median house/condo value in 2022: $247,038
35651:
$247,038
Alabama:
$200,900
According to our research of Alabama and other state lists, there were 3 registered sex offenders living in 35651 zip code as of April 24, 2024. The ratio of all residents to sex offenders in zip code 35651 is 506 to 1. The ratio of registered sex offenders to all residents in this zip code is near the state average.
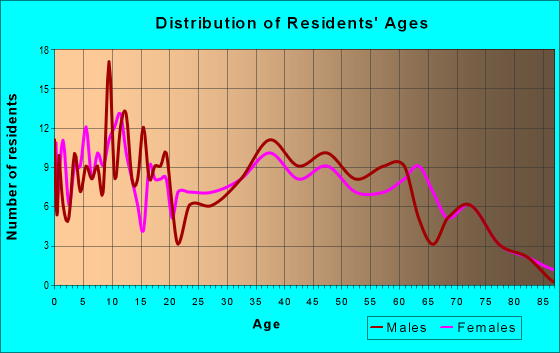
Median resident age:
This zip code:
46.1 years
Alabama median age:
39.6 years
Average household size:
This zip code:
2.9 people
Alabama:
2.5 people
Averages for the 2020 tax year for zip code 35651, filed in 2021:
Average Adjusted Gross Income (AGI) in 2020: $49,582 (Individual Income Tax Returns)
Here:
$49,582
State:
$63,984
Salary/wage: $48,275 (reported on 81.8% of returns)
Here:
$48,275
State:
$52,834
(% of AGI for various income ranges: 1214.5% for AGIs below $25k, 3778.9% for AGIs $25k-50k, 5990.0% for AGIs $50k-75k, 9920.0% for AGIs $75k-100k, 15180.0% for AGIs $100k-200k)
Taxable interest for individuals: $308 (reported on 29.5% of returns)
This zip code:
$308
Alabama:
$1,615
(% of AGI for various income ranges: 8.2% for AGIs below $25k, 10.0% for AGIs $25k-50k, 16.7% for AGIs $50k-75k, 30.0% for AGIs $100k-200k)
Ordinary dividends: $1,000 (reported on 9.1% of returns)
Here:
$1,000
State:
$7,660
(% of AGI for various income ranges: 66.7% for AGIs $50k-75k)
Net capital gain/loss in AGI: +$1,325 (reported on 9.1% of returns)
Here:
+$1,325
State:
+$23,528
(% of AGI for various income ranges: 58.9% for AGIs $25k-50k)
Profit/loss from business: +$1,867 (reported on 13.6% of returns)
Here:
+$1,867
State:
+$9,534
(% of AGI for various income ranges: 156.4% for AGIs below $25k)
Taxable individual retirement arrangement distribution: $11,900 (reported on 9.1% of returns)
35651:
$11,900
Alabama:
$19,004
(% of AGI for various income ranges: 528.9% for AGIs $25k-50k)
Earned income credit: $2,756 (reported on 20.5% of returns)
Here:
$2,756
State:
$2,628
(% of AGI for various income ranges: 151.8% for AGIs below $25k, 90.0% for AGIs $25k-50k)
Percentage of individuals using paid preparers for their 2020 taxes: 97.7%
Here:
98%
State:
93%
(% for various income ranges: 100.0% for AGIs below $25k, 91.7% for AGIs $25k-50k, 100.0% for AGIs $50k-75k, 100.0% for AGIs $75k-100k, 100.0% for AGIs $100k-200k)
Averages for the 2012 tax year for zip code 35651, filed in 2013:
Average Adjusted Gross Income (AGI) in 2012: $41,758 (Individual Income Tax Returns)
Here:
$41,758
State:
$52,001
Salary/wage: $40,464 (reported on 83.7% of returns)
Here:
$40,464
State:
$43,822
(% of AGI for various income ranges: 71.2% for AGIs below $25k, 83.9% for AGIs $25k-50k, 85.5% for AGIs $50k-75k, 80.9% for AGIs $75k-100k, 80.0% for AGIs $100k-200k)
Taxable interest for individuals: $417 (reported on 27.9% of returns)
This zip code:
$417
Alabama:
$1,592
(% of AGI for various income ranges: 1.0% for AGIs below $25k, 0.3% for AGIs $25k-50k, 0.1% for AGIs $50k-75k, 0.2% for AGIs $75k-100k)
Ordinary dividends: $1,060 (reported on 11.6% of returns)
Here:
$1,060
State:
$5,697
(% of AGI for various income ranges: 0.7% for AGIs below $25k, 0.8% for AGIs $50k-75k)
Net capital gain/loss in AGI: +$1,300 (reported on 7.0% of returns)
Here:
+$1,300
State:
+$13,286
Profit/loss from business: +$3,643 (reported on 16.3% of returns)
Here:
+$3,643
State:
+$9,151
(% of AGI for various income ranges: 9.9% for AGIs below $25k, 0.4% for AGIs $25k-50k)
Taxable individual retirement arrangement distribution: $4,600 (reported on 4.7% of returns)
35651:
$4,600
Alabama:
$14,992
Total itemized deductions: $20,312 (27% of AGI, reported on 18.6% of returns)
Here:
$20,312
State:
$21,388
Here:
27.1% of AGI
State:
20.1% of AGI
(% of AGI for various income ranges: 17.6% for AGIs below $25k, 11.8% for AGIs $50k-75k, 18.7% for AGIs $75k-100k)
Charity contributions: $4,929 (reported on 16.3% of returns)
Here:
$4,929
State:
$5,925
(% of AGI for various income ranges: 3.8% for AGIs $25k-50k, 5.5% for AGIs $75k-100k)
Taxes paid: $3,325 (reported on 18.6% of returns)
35651:
$3,325
State:
$5,272
(% of AGI for various income ranges: 2.0% for AGIs below $25k, 1.3% for AGIs $50k-75k, 4.4% for AGIs $75k-100k)
Earned income credit: $2,433 (reported on 27.9% of returns)
Here:
$2,433
State:
$2,646
(% of AGI for various income ranges: 9.4% for AGIs below $25k, 1.7% for AGIs $25k-50k)
Percentage of individuals using paid preparers for their 2012 taxes: 81.4%
Here:
81%
State:
60%
(% for various income ranges: 78.9% for AGIs below $25k, 90.0% for AGIs $25k-50k, 85.7% for AGIs $50k-75k, 75.0% for AGIs $75k-100k, 66.7% for AGIs $100k-200k)
Averages for the 2004 tax year for zip code 35651, filed in 2005:
Average Adjusted Gross Income (AGI) in 2004: $33,806 (Individual Income Tax Returns)
Here:
$33,806
State:
$42,302
Salary/wage: $33,345 (reported on 84.1% of returns)
Here:
$33,345
State:
$36,626
(% of AGI for various income ranges: 71.5% for AGIs below $10k, 81.4% for AGIs $10k-25k, 88.5% for AGIs $25k-50k, 85.6% for AGIs $50k-75k, 85.9% for AGIs $75k-100k, 69.2% for AGIs over 100k)
Taxable interest for individuals: $717 (reported on 40.1% of returns)
This zip code:
$717
Alabama:
$1,827
(% of AGI for various income ranges: 7.4% for AGIs below $10k, 1.4% for AGIs $10k-25k, 0.5% for AGIs $25k-50k, 0.5% for AGIs $50k-75k, 0.9% for AGIs $75k-100k, 0.4% for AGIs over 100k)
Taxable dividends: $448 (reported on 14.6% of returns)
Here:
$448
State:
$4,206
(% of AGI for various income ranges: 4.4% for AGIs below $10k, 0.1% for AGIs $10k-25k, 0.0% for AGIs $25k-50k, 0.0% for AGIs $50k-75k, 0.2% for AGIs $75k-100k)
Net capital gain/loss: +$1,133 (reported on 9.8% of returns)
Here:
+$1,133
State:
+$13,031
Profit/loss from business: +$2,667 (reported on 13.1% of returns)
Here:
+$2,667
State:
+$8,302
(% of AGI for various income ranges: 8.9% for AGIs below $10k, 5.2% for AGIs $10k-25k, 0.5% for AGIs $25k-50k, -0.5% for AGIs $50k-75k)
Total itemized deductions: $15,620 (25% of AGI, reported on 20.0% of returns)
Here:
$15,620
State:
$17,623
Here:
25.1% of AGI
State:
20.8% of AGI
(% of AGI for various income ranges: 8.6% for AGIs $10k-25k, 7.2% for AGIs $25k-50k, 11.9% for AGIs $50k-75k, 18.3% for AGIs over 100k)
Charity contributions deductions: $3,582 (6% of AGI, reported on 17.2% of returns)
Here:
$3,582
State:
$4,768
Here:
5.8% of AGI
State:
5.4% of AGI
(% of AGI for various income ranges: 2.1% for AGIs below $10k, 1.7% for AGIs $25k-50k, 3.1% for AGIs $50k-75k, 3.0% for AGIs over 100k)
Total tax: $3,997 (reported on 68.4% of returns)
35651:
$3,997
State:
$6,905
(% of AGI for various income ranges: 2.5% for AGIs below $10k, 3.6% for AGIs $10k-25k, 6.1% for AGIs $25k-50k, 8.2% for AGIs $50k-75k, 12.5% for AGIs $75k-100k, 13.8% for AGIs over 100k)
Earned income credit: $1,900 (reported on 21.8% of returns)
Here:
$1,900
State:
$2,048
Percentage of individuals using paid preparers for their 2004 taxes: 83.9%
Here:
84%
State:
65%
(% for various income ranges: 82.1% for AGIs below $10k, 84.7% for AGIs $10k-25k, 89.6% for AGIs $25k-50k, 77.8% for AGIs $50k-75k, 81.8% for AGIs $75k-100k, 77.8% for AGIs over 100k)
Household received Food Stamps/SNAP in the past 12 months: 59 Household did not receive Food Stamps/SNAP in the past 12 months: 420
Women who had a birth in the past 12 months: 17 (19 now married, 0 unmarried) Women who did not have a birth in the past 12 months: 321 (208 now married, 112 unmarried)
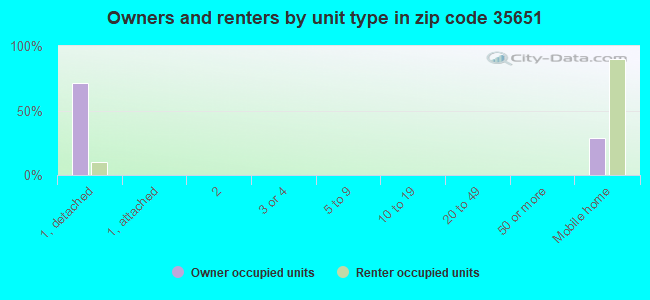
Housing units in zip code 35651 with a mortgage: 226 Houses without a mortgage: 8
Median monthly owner costs for units with a mortgage: $1,448 Median monthly owner costs for units without a mortgage: $334
Residents with income below the poverty level in 2022:
This zip code:
14.4%
Whole state:
16.2%
Residents with income below 50% of the poverty level in 2022:
This zip code:
3.2%
Whole state:
8.6%
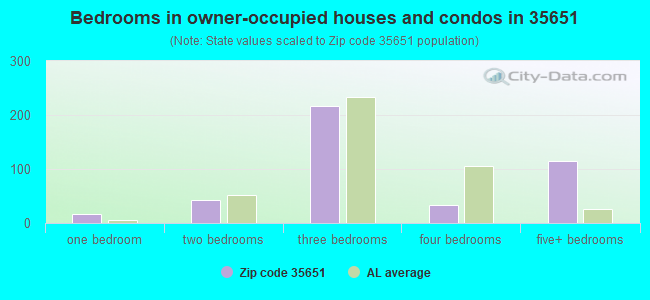
Median number of rooms in houses and condos:
Here:
6.9
State:
6.5
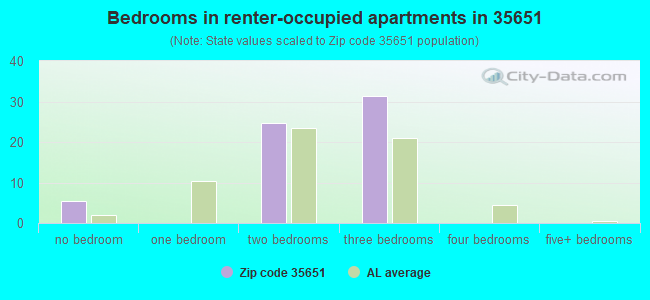
Median number of rooms in apartments:
Here:
4.7
State:
4.7
Notable locations in this zip code not listed on our city pages
Churches in zip code 35651 include: New Zion Church (A), Prairie Grove Church (B), Mount Hope Church (C), Rock Springs Church (D), Mount Hope Church of Christ (E), Harris Chapel (F). Display/hide their locations on the map
Streams, rivers, and creeks: Privet Branch (A), Pool Creek (B), Soap Hole Branch (C), Lick Branch (D), Milam Creek (E), Mud Creek (F), Robertson Creek (G), Rock Springs Branch (H), Rocky Branch (I). Display/hide their locations on the map
Size of family households: 144 2-persons, 131 3-persons, 91 4-persons
Size of nonfamily households: 106 1-person, 8 2-persons
315 married couples with children.
0 single-parent households ().
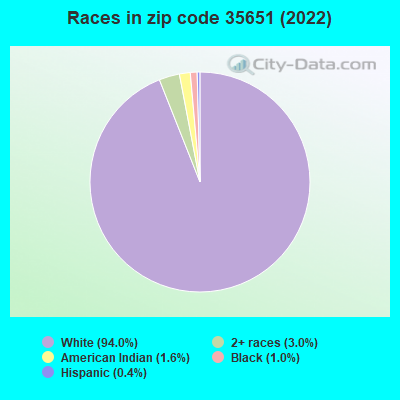
98.9% of residents of 35651 zip code speak English at home.
0.5% of residents speak Spanish at home (100% well).
Foreign born population: 0 (0.0%)
:
0.0%
Whole state:
3.8%
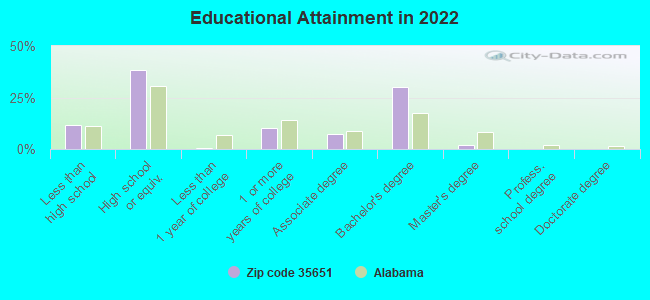
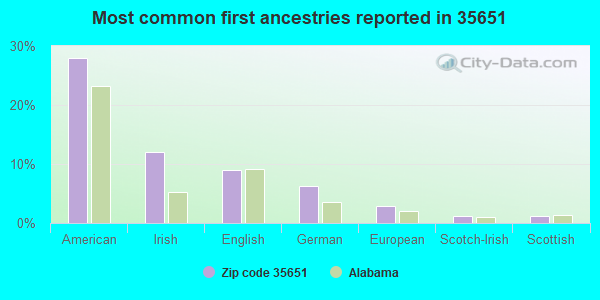
28%American
12%Irish
9%English
6%German
3%European
1%Scotch-Irish
1%Scottish
Public elementary/middle school in in zip code 35651 not listed on the city page:
MT HOPE HIGH SCH(Students: 189, Location: 8455 COUNTY ROAD 23, Grades: KG-6)
Facilities with environmental interests located in this zip code:
MOUNT HOPE HIGH SCHOOL (8455 COUNTY ROAD 23 in MT HOPE, AL)
(Geographic Names Information System) (National Center for Education Statistics) - STATE ID-0130 Conditionally Exempt Small Quantity Generators, less than 100 kg/month of hazardous waste (Resource Conservation and Recovery Act (tracking hazardous waste)) Organizations: LAWRENCE COUNTY (SCHOOL DISTRICT)
CAMPBELL FARMS (MATT CAMPBELL in MOUNT HOPE, AL)
National Pollutant Discharge Elimination System NON-MAJOR (Tracking pollutant discharge elimination systems) - permit Business SIC classification: NONCLASSIFIABLE ESTABLISHMENTS Alternative names: MATT CAMPBELL CAMPBELL FARMS
PHILLIP ROBERSON FARM (PHILLIP ROBERSON in MOUNT HOPE, AL)
National Pollutant Discharge Elimination System NON-MAJOR (Tracking pollutant discharge elimination systems) - permit Business SIC classification: NONCLASSIFIABLE ESTABLISHMENTS Alternative names: ROBERSON FARM POULTRY BROILER
KIMBROUGHS DAIRY (RENEE KIMBROUGH in MOUNT HOPE, AL)
National Pollutant Discharge Elimination System NON-MAJOR (Tracking pollutant discharge elimination systems) - permit Business SIC classification: NONCLASSIFIABLE ESTABLISHMENTS Alternative names: RENEE KIMBROUGHS DAIRY
M AND H FARM (LISA HEAPS MARTINEZ in MT HOPE, AL)
National Pollutant Discharge Elimination System NON-MAJOR (Tracking pollutant discharge elimination systems) - permit Business SIC classification: NONCLASSIFIABLE ESTABLISHMENTS
MT HOPE SCHOOL LAGOON (LAWRENCE CO BD OF EDUCATION in MOUNT HOPE, AL)
National Pollutant Discharge Elimination System NON-MAJOR (Tracking pollutant discharge elimination systems) - permit Business SIC classification: ELEMENTARY AND SECONDARY SCHOOLS Alternative names: LAWRENCE CO BOE MOUNT HOPE SCH, LAWRENCE CNTY BOARD OF ED
ADDITION OULTRY HOUSES (BRAD SUTTON in MOUNT HOPE, AL)
National Pollutant Discharge Elimination System NON-MAJOR (Tracking pollutant discharge elimination systems) - permit Business SIC classification: HEAVY CONSTRUCTION Alternative names: ADDITION POULTRY HOUSES, BRAD SUTTON POULTRY HOUSES ADD
KENNY GARRISON (KENNY GARRISON in MT HOPE, AL)
National Pollutant Discharge Elimination System NON-MAJOR (Tracking pollutant discharge elimination systems) - permit Business SIC classification: POULTRY AND EGGS
Housing units lacking complete plumbing facilities: 10.5% Housing units lacking complete kitchen facilities: 16.2%
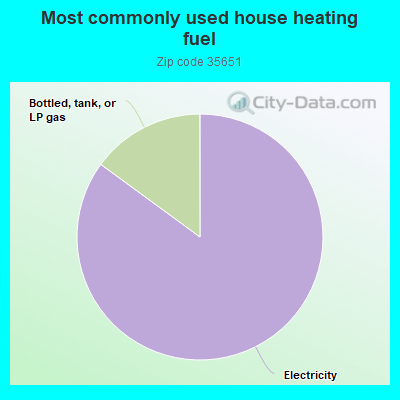
85.4%Electricity
15.0%Bottled, tank, or LP gas
Population in 1990: 1,821.
Place of birth for U.S.-born residents:
This state: 1,031
Northeast: 38
Midwest: 14
South: 301
West: 7
66% of the 35651 zip code residents lived in the same house 5 years ago. Out of people who lived in different houses, 54% lived in this county. Out of people who lived in different counties, 50% lived in Alabama.
99% of the 35651 zip code residents lived in the same house 1 year ago. Out of people who lived in different houses, 55% moved from this county. Out of people who lived in different houses, 64% moved from different county within same state.
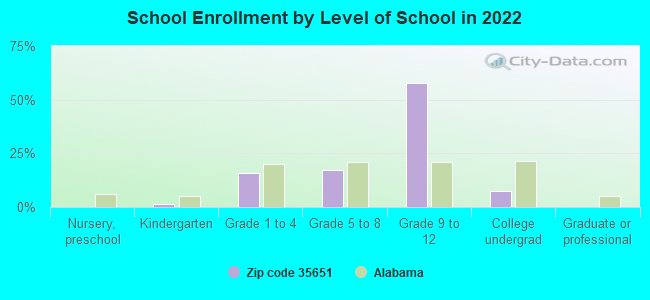
Private vs. public school enrollment:
Students in private schools in grades 1 to 8 (elementary and middle school): 8
Here:
9.6%
Alabama:
14.7%
Students in private schools in grades 9 to 12 (high school): 9
Here:
5.9%
Alabama:
16.3%
Students in private undergraduate colleges:
Here:
0.0%
Alabama:
14.6%
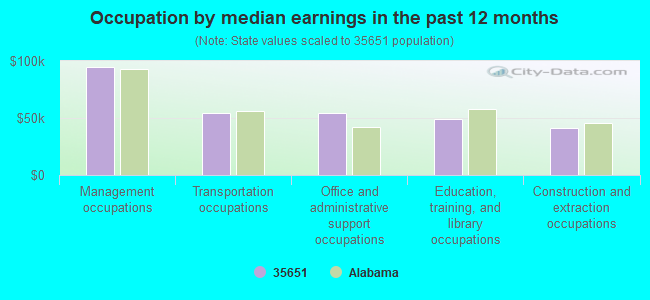
Occupation by median earnings in the past 12 months ($)
94,726Management occupations
54,762Transportation occupations
54,616Office and administrative support occupations
49,029Education, training, and library occupations
41,368Construction and extraction occupations
Top industries in this zip code by the number of employees in 2005:
Accommodation and Food Services: Limited-Service Restaurants (20-49 employees: 1 establishment)
Utilities: Water Supply and Irrigation Systems (10-19: 1)
Construction: Water and Sewer Line and Related Structures Construction (10-19: 1)
Health Care and Social Assistance: All Other Outpatient Care Centers (10-19: 1)
Mining: Crushed and Broken Limestone Mining and Quarrying (5-9: 1)
Administrative and Support and Waste Management and Remediation Services: Locksmiths (5-9: 1)
Other Services (except Public Administration): Religious Organizations (1-4: 1)
Construction: All Other Specialty Trade Contractors (1-4: 1)
Home Mortgage Disclosure Act Aggregated Statistics For Year 2009 (Based on 2 partial tracts)
A) FHA, FSA/RHS & VA Home Purchase Loans
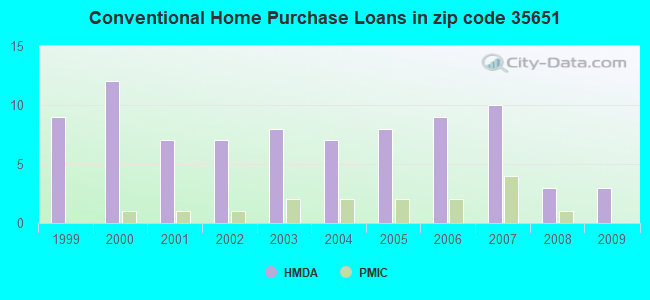
B) Conventional Home Purchase Loans
C) Refinancings
D) Home Improvement Loans
F) Non-occupant Loans on < 5 Family Dwellings (A B C & D)
G) Loans On Manufactured Home Dwelling (A B C & D)
Number
Average Value
Number
Average Value
Number
Average Value
Number
Average Value
Number
Average Value
Number
Average Value
LOANS ORIGINATED
2
$114,995
3
$59,520
16
$120,718
4
$19,335
2
$33,380
3
$26,520
APPLICATIONS APPROVED, NOT ACCEPTED
0
$0
1
$31,230
2
$92,340
0
$0
0
$0
1
$31,230
APPLICATIONS DENIED
1
$48,120
2
$62,105
7
$139,557
1
$35,010
0
$0
2
$30,755
APPLICATIONS WITHDRAWN
0
$0
0
$0
4
$111,660
0
$0
0
$0
1
$13,570
FILES CLOSED FOR INCOMPLETENESS
0
$0
1
$69,110
1
$103,460
0
$0
0
$0
0
$0
Aggregated Statistics For Year 2008 (Based on 2 partial tracts)
A) FHA, FSA/RHS & VA Home Purchase Loans
B) Conventional Home Purchase Loans
C) Refinancings
D) Home Improvement Loans
F) Non-occupant Loans on < 5 Family Dwellings (A B C & D)
G) Loans On Manufactured Home Dwelling (A B C & D)
Number
Average Value
Number
Average Value
Number
Average Value
Number
Average Value
Number
Average Value
Number
Average Value
LOANS ORIGINATED
3
$110,073
3
$60,310
12
$105,335
4
$22,185
2
$75,710
5
$37,130
APPLICATIONS APPROVED, NOT ACCEPTED
0
$0
1
$46,320
1
$128,510
0
$0
0
$0
1
$34,720
APPLICATIONS DENIED
1
$117,900
3
$62,997
7
$116,950
4
$30,978
1
$13,350
3
$36,827
APPLICATIONS WITHDRAWN
0
$0
0
$0
3
$112,043
1
$19,150
0
$0
0
$0
FILES CLOSED FOR INCOMPLETENESS
0
$0
0
$0
1
$97,280
0
$0
0
$0
0
$0
Aggregated Statistics For Year 2007 (Based on 2 partial tracts)
A) FHA, FSA/RHS & VA Home Purchase Loans
B) Conventional Home Purchase Loans
C) Refinancings
D) Home Improvement Loans
F) Non-occupant Loans on < 5 Family Dwellings (A B C & D)
G) Loans On Manufactured Home Dwelling (A B C & D)
Number
Average Value
Number
Average Value
Number
Average Value
Number
Average Value
Number
Average Value
Number
Average Value
LOANS ORIGINATED
2
$74,490
10
$74,300
16
$87,818
4
$20,645
3
$61,847
7
$27,660
APPLICATIONS APPROVED, NOT ACCEPTED
0
$0
1
$38,810
2
$151,845
1
$35,060
0
$0
1
$38,880
APPLICATIONS DENIED
1
$42,950
4
$74,275
9
$106,093
2
$61,365
1
$110,270
4
$50,200
APPLICATIONS WITHDRAWN
1
$63,320
1
$102,170
4
$126,688
0
$0
0
$0
0
$0
FILES CLOSED FOR INCOMPLETENESS
0
$0
0
$0
1
$117,500
0
$0
0
$0
0
$0
Aggregated Statistics For Year 2006 (Based on 2 partial tracts)
A) FHA, FSA/RHS & VA Home Purchase Loans
B) Conventional Home Purchase Loans
C) Refinancings
D) Home Improvement Loans
F) Non-occupant Loans on < 5 Family Dwellings (A B C & D)
G) Loans On Manufactured Home Dwelling (A B C & D)
Number
Average Value
Number
Average Value
Number
Average Value
Number
Average Value
Number
Average Value
Number
Average Value
LOANS ORIGINATED
1
$38,250
9
$75,912
14
$79,741
5
$33,382
1
$62,610
7
$39,017
APPLICATIONS APPROVED, NOT ACCEPTED
0
$0
2
$86,220
3
$102,157
1
$29,270
0
$0
1
$83,780
APPLICATIONS DENIED
0
$0
7
$51,121
9
$76,536
2
$51,750
1
$36,710
6
$41,313
APPLICATIONS WITHDRAWN
0
$0
1
$99,010
4
$106,242
1
$72,700
0
$0
0
$0
FILES CLOSED FOR INCOMPLETENESS
0
$0
0
$0
2
$107,630
0
$0
0
$0
0
$0
Aggregated Statistics For Year 2005 (Based on 2 partial tracts)
A) FHA, FSA/RHS & VA Home Purchase Loans
B) Conventional Home Purchase Loans
C) Refinancings
D) Home Improvement Loans
F) Non-occupant Loans on < 5 Family Dwellings (A B C & D)
G) Loans On Manufactured Home Dwelling (A B C & D)
Number
Average Value
Number
Average Value
Number
Average Value
Number
Average Value
Number
Average Value
Number
Average Value
LOANS ORIGINATED
1
$108,240
8
$82,668
14
$77,246
3
$17,677
2
$45,840
5
$29,226
APPLICATIONS APPROVED, NOT ACCEPTED
0
$0
2
$61,030
4
$59,895
0
$0
0
$0
2
$37,375
APPLICATIONS DENIED
0
$0
4
$54,768
14
$87,591
2
$63,190
0
$0
4
$35,780
APPLICATIONS WITHDRAWN
0
$0
1
$59,730
5
$90,722
1
$135,140
0
$0
0
$0
FILES CLOSED FOR INCOMPLETENESS
0
$0
0
$0
4
$87,152
0
$0
0
$0
0
$0
Aggregated Statistics For Year 2004 (Based on 2 partial tracts)
A) FHA, FSA/RHS & VA Home Purchase Loans
B) Conventional Home Purchase Loans
C) Refinancings
D) Home Improvement Loans
F) Non-occupant Loans on < 5 Family Dwellings (A B C & D)
G) Loans On Manufactured Home Dwelling (A B C & D)
Number
Average Value
Number
Average Value
Number
Average Value
Number
Average Value
Number
Average Value
Number
Average Value
LOANS ORIGINATED
1
$106,900
7
$69,310
14
$125,121
4
$16,062
1
$33,140
4
$74,330
APPLICATIONS APPROVED, NOT ACCEPTED
0
$0
3
$66,390
3
$85,987
0
$0
0
$0
1
$70,290
APPLICATIONS DENIED
0
$0
5
$53,416
15
$83,668
1
$36,930
1
$26,970
7
$40,880
APPLICATIONS WITHDRAWN
0
$0
2
$77,630
5
$75,672
0
$0
1
$64,840
1
$53,240
FILES CLOSED FOR INCOMPLETENESS
0
$0
1
$47,740
6
$85,362
0
$0
0
$0
1
$34,250
Aggregated Statistics For Year 2003 (Based on 2 partial tracts)
A) FHA, FSA/RHS & VA Home Purchase Loans
B) Conventional Home Purchase Loans
C) Refinancings
D) Home Improvement Loans
F) Non-occupant Loans on < 5 Family Dwellings (A B C & D)
Number
Average Value
Number
Average Value
Number
Average Value
Number
Average Value
Number
Average Value
LOANS ORIGINATED
1
$43,970
8
$58,754
25
$81,897
2
$11,325
1
$22,800
APPLICATIONS APPROVED, NOT ACCEPTED
0
$0
1
$19,010
5
$71,966
0
$0
0
$0
APPLICATIONS DENIED
0
$0
5
$32,034
17
$67,742
2
$24,600
0
$0
APPLICATIONS WITHDRAWN
0
$0
1
$82,230
8
$97,510
0
$0
1
$17,820
FILES CLOSED FOR INCOMPLETENESS
0
$0
0
$0
1
$147,560
0
$0
0
$0
Aggregated Statistics For Year 2002 (Based on 2 partial tracts)
A) FHA, FSA/RHS & VA Home Purchase Loans
B) Conventional Home Purchase Loans
C) Refinancings
D) Home Improvement Loans
F) Non-occupant Loans on < 5 Family Dwellings (A B C & D)
Number
Average Value
Number
Average Value
Number
Average Value
Number
Average Value
Number
Average Value
LOANS ORIGINATED
2
$74,850
7
$53,446
17
$80,466
3
$5,327
1
$35,870
APPLICATIONS APPROVED, NOT ACCEPTED
0
$0
1
$81,670
4
$60,225
0
$0
0
$0
APPLICATIONS DENIED
0
$0
6
$51,387
13
$65,574
2
$20,450
1
$41,440
APPLICATIONS WITHDRAWN
0
$0
1
$42,220
4
$71,720
0
$0
0
$0
FILES CLOSED FOR INCOMPLETENESS
0
$0
0
$0
2
$63,535
0
$0
0
$0
Aggregated Statistics For Year 2001 (Based on 2 partial tracts)
A) FHA, FSA/RHS & VA Home Purchase Loans
B) Conventional Home Purchase Loans
C) Refinancings
D) Home Improvement Loans
F) Non-occupant Loans on < 5 Family Dwellings (A B C & D)
Number
Average Value
Number
Average Value
Number
Average Value
Number
Average Value
Number
Average Value
LOANS ORIGINATED
1
$49,650
7
$37,536
17
$85,089
3
$10,320
1
$20,090
APPLICATIONS APPROVED, NOT ACCEPTED
0
$0
1
$61,160
1
$57,400
0
$0
0
$0
APPLICATIONS DENIED
0
$0
8
$36,381
7
$73,240
1
$7,230
1
$31,490
APPLICATIONS WITHDRAWN
0
$0
1
$42,290
2
$75,645
0
$0
0
$0
FILES CLOSED FOR INCOMPLETENESS
0
$0
0
$0
2
$80,565
0
$0
0
$0
Aggregated Statistics For Year 2000 (Based on 2 partial tracts)
A) FHA, FSA/RHS & VA Home Purchase Loans
B) Conventional Home Purchase Loans
C) Refinancings
D) Home Improvement Loans
F) Non-occupant Loans on < 5 Family Dwellings (A B C & D)
Number
Average Value
Number
Average Value
Number
Average Value
Number
Average Value
Number
Average Value
LOANS ORIGINATED
2
$59,160
12
$38,616
11
$58,097
3
$15,460
1
$12,790
APPLICATIONS APPROVED, NOT ACCEPTED
1
$30,750
5
$34,700
1
$49,190
0
$0
0
$0
APPLICATIONS DENIED
1
$27,590
21
$31,767
9
$47,397
1
$8,510
1
$25,570
APPLICATIONS WITHDRAWN
1
$27,840
0
$0
2
$80,060
0
$0
0
$0
FILES CLOSED FOR INCOMPLETENESS
0
$0
0
$0
2
$56,885
0
$0
0
$0
Aggregated Statistics For Year 1999 (Based on 2 partial tracts)
B) Conventional Home Purchase Loans
C) Refinancings
D) Home Improvement Loans
F) Non-occupant Loans on < 5 Family Dwellings (A B C & D)
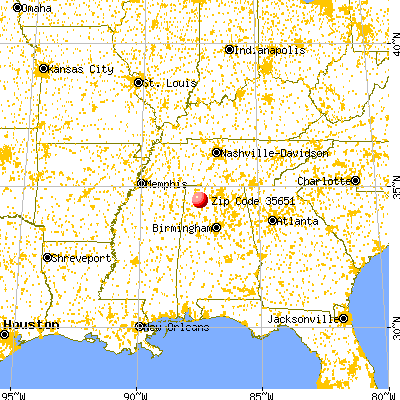


 Nearest zip codes: 35654, 35650, 35672, 35646, 35565, 35581.


 (Students: 189, Location: 8455 COUNTY ROAD 23, Grades: KG-6)