Estimated zip code population in 2022: 17,504
Zip code population in 2010: 17,444
Zip code population in 2000: 16,743
Houses and condos: 7,638
Renter-occupied apartments: 2,378
% of renters here:
34%State:
33%
March 2022 cost of living index in zip code 37813: 78.8
(low, U.S. average is 100)
Land area: 58.4
sq. mi.
Water area: 0.4
sq. mi.
Population density: 300 people per square mile (very low).
OSM Map
General Map
Google Map
MSN Map
OSM Map
General Map
Google Map
MSN Map
OSM Map
General Map
Google Map
MSN Map
OSM Map
General Map
Google Map
MSN Map
Please wait while loading the map...
Real estate property taxes paid for housing units in 2022:
This zip code:
0.4% ($739)Tennessee:
0.5% ($1,376)
Median real estate property taxes paid for housing units with mortgages in 2022: $774 (0.4%)
Median real estate property taxes paid for housing units with no mortgage in 2022: $708 (0.4%)
Profiles of local businesses
Business Search - 14 Million verified businesses
Males: 8,492 Females: 9,012
For population 25 years and over in 37813:
High school or higher: 81.6%Bachelor's degree or higher: 13.6%Graduate or professional degree: 4.1%Unemployed: 5.4%Mean travel time to work (commute): 21.7 minutes
For population 15 years and over in 37813:
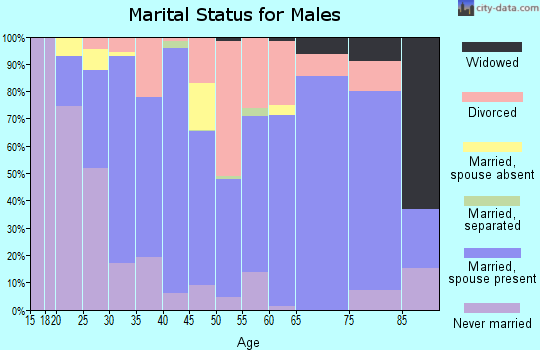
Never married: 26.9%Now married: 52.4%Separated: 1.9%Widowed: 5.4%Divorced: 13.3%
Zip code 37813 compared to state average:
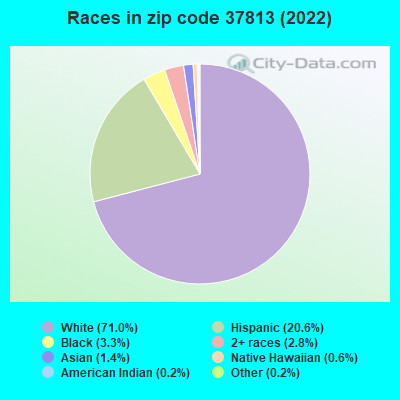
Median household income below state average. Median house value below state average. Black race population percentage significantly below state average. Hispanic race population percentage significantly above state average. Foreign-born population percentage above state average. Length of stay since moving in above state average. Number of college students below state average. Percentage of population with a bachelor's degree or higher significantly below state average. 12,425 71.0% White 3,603 20.6% Hispanic or Latino 580 3.3% Black 488 2.8% Two or more races 241 1.4% Asian 101 0.6% Native Hawaiian and Other 34 0.2% American Indian 28 0.2% Some other race
Data:
Median household income ($)
Median household income (% change since 2000)
Household income diversity
Ratio of average income to average house value (%)
Ratio of average income to average rent
Median household income ($) - White
Median household income ($) - Black or African American
Median household income ($) - Asian
Median household income ($) - Hispanic or Latino
Median household income ($) - American Indian and Alaska Native
Median household income ($) - Multirace
Median household income ($) - Other Race
Median household income for houses/condos with a mortgage ($)
Median household income for apartments without a mortgage ($)
Races - White alone (%)
Races - White alone (% change since 2000)
Races - Black alone (%)
Races - Black alone (% change since 2000)
Races - American Indian alone (%)
Races - American Indian alone (% change since 2000)
Races - Asian alone (%)
Races - Asian alone (% change since 2000)
Races - Hispanic (%)
Races - Hispanic (% change since 2000)
Races - Native Hawaiian and Other Pacific Islander alone (%)
Races - Native Hawaiian and Other Pacific Islander alone (% change since 2000)
Races - Two or more races (%)
Races - Two or more races (% change since 2000)
Races - Other race alone (%)
Races - Other race alone (% change since 2000)
Racial diversity
Unemployment (%)
Unemployment (% change since 2000)
Unemployment (%) - White
Unemployment (%) - Black or African American
Unemployment (%) - Asian
Unemployment (%) - Hispanic or Latino
Unemployment (%) - American Indian and Alaska Native
Unemployment (%) - Multirace
Unemployment (%) - Other Race
Population density (people per square mile)
Population - Males (%)
Population - Females (%)
Population - Males (%) - White
Population - Males (%) - Black or African American
Population - Males (%) - Asian
Population - Males (%) - Hispanic or Latino
Population - Males (%) - American Indian and Alaska Native
Population - Males (%) - Multirace
Population - Males (%) - Other Race
Population - Females (%) - White
Population - Females (%) - Black or African American
Population - Females (%) - Asian
Population - Females (%) - Hispanic or Latino
Population - Females (%) - American Indian and Alaska Native
Population - Females (%) - Multirace
Population - Females (%) - Other Race
Coronavirus confirmed cases (Apr 24, 2024)
Deaths caused by coronavirus (Apr 24, 2024)
Coronavirus confirmed cases (per 100k population) (Apr 24, 2024)
Deaths caused by coronavirus (per 100k population) (Apr 24, 2024)
Daily increase in number of cases (Apr 24, 2024)
Weekly increase in number of cases (Apr 24, 2024)
Cases doubled (in days) (Apr 24, 2024)
Hospitalized patients (Apr 18, 2022)
Negative test results (Apr 18, 2022)
Total test results (Apr 18, 2022)
COVID Vaccine doses distributed (per 100k population) (Sep 19, 2023)
COVID Vaccine doses administered (per 100k population) (Sep 19, 2023)
COVID Vaccine doses distributed (Sep 19, 2023)
COVID Vaccine doses administered (Sep 19, 2023)
Likely homosexual households (%)
Likely homosexual households (% change since 2000)
Likely homosexual households - Lesbian couples (%)
Likely homosexual households - Lesbian couples (% change since 2000)
Likely homosexual households - Gay men (%)
Likely homosexual households - Gay men (% change since 2000)
Cost of living index
Median gross rent ($)
Median contract rent ($)
Median monthly housing costs ($)
Median house or condo value ($)
Median house or condo value ($ change since 2000)
Mean house or condo value by units in structure - 1, detached ($)
Mean house or condo value by units in structure - 1, attached ($)
Mean house or condo value by units in structure - 2 ($)
Mean house or condo value by units in structure by units in structure - 3 or 4 ($)
Mean house or condo value by units in structure - 5 or more ($)
Mean house or condo value by units in structure - Boat, RV, van, etc. ($)
Mean house or condo value by units in structure - Mobile home ($)
Median house or condo value ($) - White
Median house or condo value ($) - Black or African American
Median house or condo value ($) - Asian
Median house or condo value ($) - Hispanic or Latino
Median house or condo value ($) - American Indian and Alaska Native
Median house or condo value ($) - Multirace
Median house or condo value ($) - Other Race
Median resident age
Resident age diversity
Median resident age - Males
Median resident age - Females
Median resident age - White
Median resident age - Black or African American
Median resident age - Asian
Median resident age - Hispanic or Latino
Median resident age - American Indian and Alaska Native
Median resident age - Multirace
Median resident age - Other Race
Median resident age - Males - White
Median resident age - Males - Black or African American
Median resident age - Males - Asian
Median resident age - Males - Hispanic or Latino
Median resident age - Males - American Indian and Alaska Native
Median resident age - Males - Multirace
Median resident age - Males - Other Race
Median resident age - Females - White
Median resident age - Females - Black or African American
Median resident age - Females - Asian
Median resident age - Females - Hispanic or Latino
Median resident age - Females - American Indian and Alaska Native
Median resident age - Females - Multirace
Median resident age - Females - Other Race
Commute - mean travel time to work (minutes)
Travel time to work - Less than 5 minutes (%)
Travel time to work - Less than 5 minutes (% change since 2000)
Travel time to work - 5 to 9 minutes (%)
Travel time to work - 5 to 9 minutes (% change since 2000)
Travel time to work - 10 to 19 minutes (%)
Travel time to work - 10 to 19 minutes (% change since 2000)
Travel time to work - 20 to 29 minutes (%)
Travel time to work - 20 to 29 minutes (% change since 2000)
Travel time to work - 30 to 39 minutes (%)
Travel time to work - 30 to 39 minutes (% change since 2000)
Travel time to work - 40 to 59 minutes (%)
Travel time to work - 40 to 59 minutes (% change since 2000)
Travel time to work - 60 to 89 minutes (%)
Travel time to work - 60 to 89 minutes (% change since 2000)
Travel time to work - 90 or more minutes (%)
Travel time to work - 90 or more minutes (% change since 2000)
Marital status - Never married (%)
Marital status - Now married (%)
Marital status - Separated (%)
Marital status - Widowed (%)
Marital status - Divorced (%)
Median family income ($)
Median family income (% change since 2000)
Median non-family income ($)
Median non-family income (% change since 2000)
Median per capita income ($)
Median per capita income (% change since 2000)
Median family income ($) - White
Median family income ($) - Black or African American
Median family income ($) - Asian
Median family income ($) - Hispanic or Latino
Median family income ($) - American Indian and Alaska Native
Median family income ($) - Multirace
Median family income ($) - Other Race
Median year house/condo built
Median year apartment built
Year house built - Built 2005 or later (%)
Year house built - Built 2000 to 2004 (%)
Year house built - Built 1990 to 1999 (%)
Year house built - Built 1980 to 1989 (%)
Year house built - Built 1970 to 1979 (%)
Year house built - Built 1960 to 1969 (%)
Year house built - Built 1950 to 1959 (%)
Year house built - Built 1940 to 1949 (%)
Year house built - Built 1939 or earlier (%)
Average household size
Household density (households per square mile)
Average household size - White
Average household size - Black or African American
Average household size - Asian
Average household size - Hispanic or Latino
Average household size - American Indian and Alaska Native
Average household size - Multirace
Average household size - Other Race
Occupied housing units (%)
Vacant housing units (%)
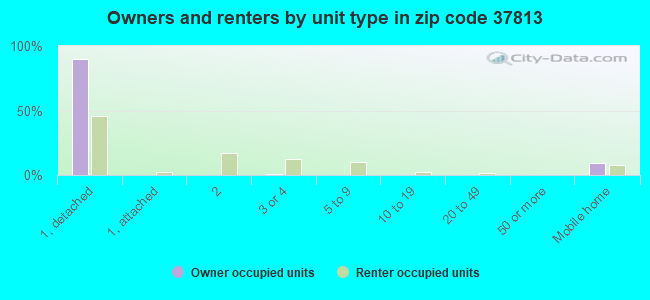
Owner occupied housing units (%)
Renter occupied housing units (%)
Vacancy status - For rent (%)
Vacancy status - For sale only (%)
Vacancy status - Rented or sold, not occupied (%)
Vacancy status - For seasonal, recreational, or occasional use (%)
Vacancy status - For migrant workers (%)
Vacancy status - Other vacant (%)
Residents with income below the poverty level (%)
Residents with income below 50% of the poverty level (%)
Children below poverty level (%)
Poor families by family type - Married-couple family (%)
Poor families by family type - Male, no wife present (%)
Poor families by family type - Female, no husband present (%)
Poverty status for native-born residents (%)
Poverty status for foreign-born residents (%)
Poverty among high school graduates not in families (%)
Poverty among people who did not graduate high school not in families (%)
Residents with income below the poverty level (%) - White
Residents with income below the poverty level (%) - Black or African American
Residents with income below the poverty level (%) - Asian
Residents with income below the poverty level (%) - Hispanic or Latino
Residents with income below the poverty level (%) - American Indian and Alaska Native
Residents with income below the poverty level (%) - Multirace
Residents with income below the poverty level (%) - Other Race
Air pollution - Air Quality Index (AQI)
Air pollution - CO
Air pollution - NO2
Air pollution - SO2
Air pollution - Ozone
Air pollution - PM10
Air pollution - PM25
Air pollution - Pb
Crime - Murders per 100,000 population
Crime - Rapes per 100,000 population
Crime - Robberies per 100,000 population
Crime - Assaults per 100,000 population
Crime - Burglaries per 100,000 population
Crime - Thefts per 100,000 population
Crime - Auto thefts per 100,000 population
Crime - Arson per 100,000 population
Crime - City-data.com crime index
Crime - Violent crime index
Crime - Property crime index
Crime - Murders per 100,000 population (5 year average)
Crime - Rapes per 100,000 population (5 year average)
Crime - Robberies per 100,000 population (5 year average)
Crime - Assaults per 100,000 population (5 year average)
Crime - Burglaries per 100,000 population (5 year average)
Crime - Thefts per 100,000 population (5 year average)
Crime - Auto thefts per 100,000 population (5 year average)
Crime - Arson per 100,000 population (5 year average)
Crime - City-data.com crime index (5 year average)
Crime - Violent crime index (5 year average)
Crime - Property crime index (5 year average)
1996 Presidential Elections Results (%) - Democratic Party (Clinton)
1996 Presidential Elections Results (%) - Republican Party (Dole)
1996 Presidential Elections Results (%) - Other
2000 Presidential Elections Results (%) - Democratic Party (Gore)
2000 Presidential Elections Results (%) - Republican Party (Bush)
2000 Presidential Elections Results (%) - Other
2004 Presidential Elections Results (%) - Democratic Party (Kerry)
2004 Presidential Elections Results (%) - Republican Party (Bush)
2004 Presidential Elections Results (%) - Other
2008 Presidential Elections Results (%) - Democratic Party (Obama)
2008 Presidential Elections Results (%) - Republican Party (McCain)
2008 Presidential Elections Results (%) - Other
2012 Presidential Elections Results (%) - Democratic Party (Obama)
2012 Presidential Elections Results (%) - Republican Party (Romney)
2012 Presidential Elections Results (%) - Other
2016 Presidential Elections Results (%) - Democratic Party (Clinton)
2016 Presidential Elections Results (%) - Republican Party (Trump)
2016 Presidential Elections Results (%) - Other
2020 Presidential Elections Results (%) - Democratic Party (Biden)
2020 Presidential Elections Results (%) - Republican Party (Trump)
2020 Presidential Elections Results (%) - Other
Ancestries Reported - Arab (%)
Ancestries Reported - Czech (%)
Ancestries Reported - Danish (%)
Ancestries Reported - Dutch (%)
Ancestries Reported - English (%)
Ancestries Reported - French (%)
Ancestries Reported - French Canadian (%)
Ancestries Reported - German (%)
Ancestries Reported - Greek (%)
Ancestries Reported - Hungarian (%)
Ancestries Reported - Irish (%)
Ancestries Reported - Italian (%)
Ancestries Reported - Lithuanian (%)
Ancestries Reported - Norwegian (%)
Ancestries Reported - Polish (%)
Ancestries Reported - Portuguese (%)
Ancestries Reported - Russian (%)
Ancestries Reported - Scotch-Irish (%)
Ancestries Reported - Scottish (%)
Ancestries Reported - Slovak (%)
Ancestries Reported - Subsaharan African (%)
Ancestries Reported - Swedish (%)
Ancestries Reported - Swiss (%)
Ancestries Reported - Ukrainian (%)
Ancestries Reported - United States (%)
Ancestries Reported - Welsh (%)
Ancestries Reported - West Indian (%)
Ancestries Reported - Other (%)
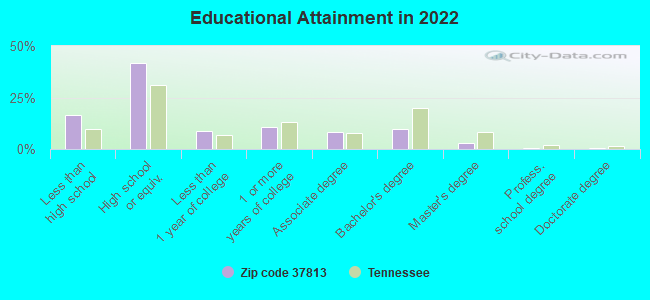
Educational Attainment - No schooling completed (%)
Educational Attainment - Less than high school (%)
Educational Attainment - High school or equivalent (%)
Educational Attainment - Less than 1 year of college (%)
Educational Attainment - 1 or more years of college (%)
Educational Attainment - Associate degree (%)
Educational Attainment - Bachelor's degree (%)
Educational Attainment - Master's degree (%)
Educational Attainment - Professional school degree (%)
Educational Attainment - Doctorate degree (%)
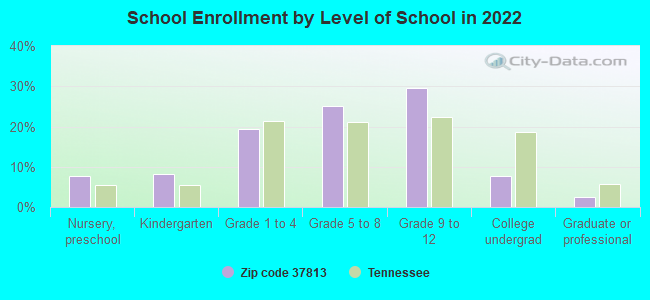
School Enrollment - Nursery, preschool (%)
School Enrollment - Kindergarten (%)
School Enrollment - Grade 1 to 4 (%)
School Enrollment - Grade 5 to 8 (%)
School Enrollment - Grade 9 to 12 (%)
School Enrollment - College undergrad (%)
School Enrollment - Graduate or professional (%)
School Enrollment - Not enrolled in school (%)
School enrollment - Public schools (%)
School enrollment - Private schools (%)
School enrollment - Not enrolled (%)
Median number of rooms in houses and condos
Median number of rooms in apartments
Housing units lacking complete plumbing facilities (%)
Housing units lacking complete kitchen facilities (%)
Density of houses
Urban houses (%)
Rural houses (%)
Households with people 60 years and over (%)
Households with people 65 years and over (%)
Households with people 75 years and over (%)
Households with one or more nonrelatives (%)
Households with no nonrelatives (%)
Population in households (%)
Family households (%)
Nonfamily households (%)
Population in families (%)
Family households with own children (%)
Median number of bedrooms in owner occupied houses
Mean number of bedrooms in owner occupied houses
Median number of bedrooms in renter occupied houses
Mean number of bedrooms in renter occupied houses
Median number of vehichles in owner occupied houses
Mean number of vehichles in owner occupied houses
Median number of vehichles in renter occupied houses
Mean number of vehichles in renter occupied houses
Mortgage status - with mortgage (%)
Mortgage status - with second mortgage (%)
Mortgage status - with home equity loan (%)
Mortgage status - with both second mortgage and home equity loan (%)
Mortgage status - without a mortgage (%)
Average family size
Average family size - White
Average family size - Black or African American
Average family size - Asian
Average family size - Hispanic or Latino
Average family size - American Indian and Alaska Native
Average family size - Multirace
Average family size - Other Race
Geographical mobility - Same house 1 year ago (%)
Geographical mobility - Moved within same county (%)
Geographical mobility - Moved from different county within same state (%)
Geographical mobility - Moved from different state (%)
Geographical mobility - Moved from abroad (%)
Place of birth - Born in state of residence (%)
Place of birth - Born in other state (%)
Place of birth - Native, outside of US (%)
Place of birth - Foreign born (%)
Housing units in structures - 1, detached (%)
Housing units in structures - 1, attached (%)
Housing units in structures - 2 (%)
Housing units in structures - 3 or 4 (%)
Housing units in structures - 5 to 9 (%)
Housing units in structures - 10 to 19 (%)
Housing units in structures - 20 to 49 (%)
Housing units in structures - 50 or more (%)
Housing units in structures - Mobile home (%)
Housing units in structures - Boat, RV, van, etc. (%)
House/condo owner moved in on average (years ago)
Renter moved in on average (years ago)
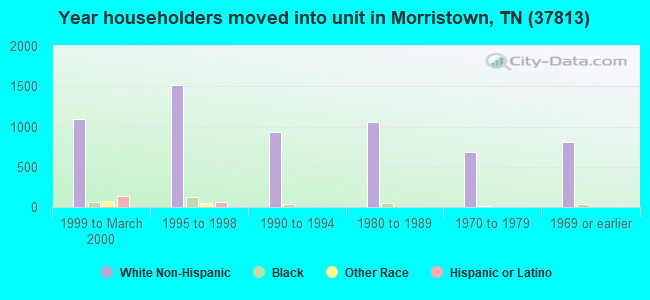
Year householder moved into unit - Moved in 1999 to March 2000 (%)
Year householder moved into unit - Moved in 1995 to 1998 (%)
Year householder moved into unit - Moved in 1990 to 1994 (%)
Year householder moved into unit - Moved in 1980 to 1989 (%)
Year householder moved into unit - Moved in 1970 to 1979 (%)
Year householder moved into unit - Moved in 1969 or earlier (%)
Means of transportation to work - Drove car alone (%)
Means of transportation to work - Carpooled (%)
Means of transportation to work - Public transportation (%)
Means of transportation to work - Bus or trolley bus (%)
Means of transportation to work - Streetcar or trolley car (%)
Means of transportation to work - Subway or elevated (%)
Means of transportation to work - Railroad (%)
Means of transportation to work - Ferryboat (%)
Means of transportation to work - Taxicab (%)
Means of transportation to work - Motorcycle (%)
Means of transportation to work - Bicycle (%)
Means of transportation to work - Walked (%)
Means of transportation to work - Other means (%)
Working at home (%)
Industry diversity
Most Common Industries - Agriculture, forestry, fishing and hunting, and mining (%)
Most Common Industries - Agriculture, forestry, fishing and hunting (%)
Most Common Industries - Mining, quarrying, and oil and gas extraction (%)
Most Common Industries - Construction (%)
Most Common Industries - Manufacturing (%)
Most Common Industries - Wholesale trade (%)
Most Common Industries - Retail trade (%)
Most Common Industries - Transportation and warehousing, and utilities (%)
Most Common Industries - Transportation and warehousing (%)
Most Common Industries - Utilities (%)
Most Common Industries - Information (%)
Most Common Industries - Finance and insurance, and real estate and rental and leasing (%)
Most Common Industries - Finance and insurance (%)
Most Common Industries - Real estate and rental and leasing (%)
Most Common Industries - Professional, scientific, and management, and administrative and waste management services (%)
Most Common Industries - Professional, scientific, and technical services (%)
Most Common Industries - Management of companies and enterprises (%)
Most Common Industries - Administrative and support and waste management services (%)
Most Common Industries - Educational services, and health care and social assistance (%)
Most Common Industries - Educational services (%)
Most Common Industries - Health care and social assistance (%)
Most Common Industries - Arts, entertainment, and recreation, and accommodation and food services (%)
Most Common Industries - Arts, entertainment, and recreation (%)
Most Common Industries - Accommodation and food services (%)
Most Common Industries - Other services, except public administration (%)
Most Common Industries - Public administration (%)
Occupation diversity
Most Common Occupations - Management, business, science, and arts occupations (%)
Most Common Occupations - Management, business, and financial occupations (%)
Most Common Occupations - Management occupations (%)
Most Common Occupations - Business and financial operations occupations (%)
Most Common Occupations - Computer, engineering, and science occupations (%)
Most Common Occupations - Computer and mathematical occupations (%)
Most Common Occupations - Architecture and engineering occupations (%)
Most Common Occupations - Life, physical, and social science occupations (%)
Most Common Occupations - Education, legal, community service, arts, and media occupations (%)
Most Common Occupations - Community and social service occupations (%)
Most Common Occupations - Legal occupations (%)
Most Common Occupations - Education, training, and library occupations (%)
Most Common Occupations - Arts, design, entertainment, sports, and media occupations (%)
Most Common Occupations - Healthcare practitioners and technical occupations (%)
Most Common Occupations - Health diagnosing and treating practitioners and other technical occupations (%)
Most Common Occupations - Health technologists and technicians (%)
Most Common Occupations - Service occupations (%)
Most Common Occupations - Healthcare support occupations (%)
Most Common Occupations - Protective service occupations (%)
Most Common Occupations - Fire fighting and prevention, and other protective service workers including supervisors (%)
Most Common Occupations - Law enforcement workers including supervisors (%)
Most Common Occupations - Food preparation and serving related occupations (%)
Most Common Occupations - Building and grounds cleaning and maintenance occupations (%)
Most Common Occupations - Personal care and service occupations (%)
Most Common Occupations - Sales and office occupations (%)
Most Common Occupations - Sales and related occupations (%)
Most Common Occupations - Office and administrative support occupations (%)
Most Common Occupations - Natural resources, construction, and maintenance occupations (%)
Most Common Occupations - Farming, fishing, and forestry occupations (%)
Most Common Occupations - Construction and extraction occupations (%)
Most Common Occupations - Installation, maintenance, and repair occupations (%)
Most Common Occupations - Production, transportation, and material moving occupations (%)
Most Common Occupations - Production occupations (%)
Most Common Occupations - Transportation occupations (%)
Most Common Occupations - Material moving occupations (%)
People in Group quarters - Institutionalized population (%)
People in Group quarters - Correctional institutions (%)
People in Group quarters - Federal prisons and detention centers (%)
People in Group quarters - Halfway houses (%)
People in Group quarters - Local jails and other confinement facilities (including police lockups) (%)
People in Group quarters - Military disciplinary barracks (%)
People in Group quarters - State prisons (%)
People in Group quarters - Other types of correctional institutions (%)
People in Group quarters - Nursing homes (%)
People in Group quarters - Hospitals/wards, hospices, and schools for the handicapped (%)
People in Group quarters - Hospitals/wards and hospices for chronically ill (%)
People in Group quarters - Hospices or homes for chronically ill (%)
People in Group quarters - Military hospitals or wards for chronically ill (%)
People in Group quarters - Other hospitals or wards for chronically ill (%)
People in Group quarters - Hospitals or wards for drug/alcohol abuse (%)
People in Group quarters - Mental (Psychiatric) hospitals or wards (%)
People in Group quarters - Schools, hospitals, or wards for the mentally retarded (%)
People in Group quarters - Schools, hospitals, or wards for the physically handicapped (%)
People in Group quarters - Institutions for the deaf (%)
People in Group quarters - Institutions for the blind (%)
People in Group quarters - Orthopedic wards and institutions for the physically handicapped (%)
People in Group quarters - Wards in general hospitals for patients who have no usual home elsewhere (%)
People in Group quarters - Wards in military hospitals for patients who have no usual home elsewhere (%)
People in Group quarters - Juvenile institutions (%)
People in Group quarters - Long-term care (%)
People in Group quarters - Homes for abused, dependent, and neglected children (%)
People in Group quarters - Residential treatment centers for emotionally disturbed children (%)
People in Group quarters - Training schools for juvenile delinquents (%)
People in Group quarters - Short-term care, detention or diagnostic centers for delinquent children (%)
People in Group quarters - Type of juvenile institution unknown (%)
People in Group quarters - Noninstitutionalized population (%)
People in Group quarters - College dormitories (includes college quarters off campus) (%)
People in Group quarters - Military quarters (%)
People in Group quarters - On base (%)
People in Group quarters - Barracks, unaccompanied personnel housing (UPH), (Enlisted/Officer), ;and similar group living quarters for military personnel (%)
People in Group quarters - Transient quarters for temporary residents (%)
People in Group quarters - Military ships (%)
People in Group quarters - Group homes (%)
People in Group quarters - Homes or halfway houses for drug/alcohol abuse (%)
People in Group quarters - Homes for the mentally ill (%)
People in Group quarters - Homes for the mentally retarded (%)
People in Group quarters - Homes for the physically handicapped (%)
People in Group quarters - Other group homes (%)
People in Group quarters - Religious group quarters (%)
People in Group quarters - Dormitories (%)
People in Group quarters - Agriculture workers' dormitories on farms (%)
People in Group quarters - Job Corps and vocational training facilities (%)
People in Group quarters - Other workers' dormitories (%)
People in Group quarters - Crews of maritime vessels (%)
People in Group quarters - Other nonhousehold living situations (%)
People in Group quarters - Other noninstitutional group quarters (%)
Residents speaking English at home (%)
Residents speaking English at home - Born in the United States (%)
Residents speaking English at home - Native, born elsewhere (%)
Residents speaking English at home - Foreign born (%)
Residents speaking Spanish at home (%)
Residents speaking Spanish at home - Born in the United States (%)
Residents speaking Spanish at home - Native, born elsewhere (%)
Residents speaking Spanish at home - Foreign born (%)
Residents speaking other language at home (%)
Residents speaking other language at home - Born in the United States (%)
Residents speaking other language at home - Native, born elsewhere (%)
Residents speaking other language at home - Foreign born (%)
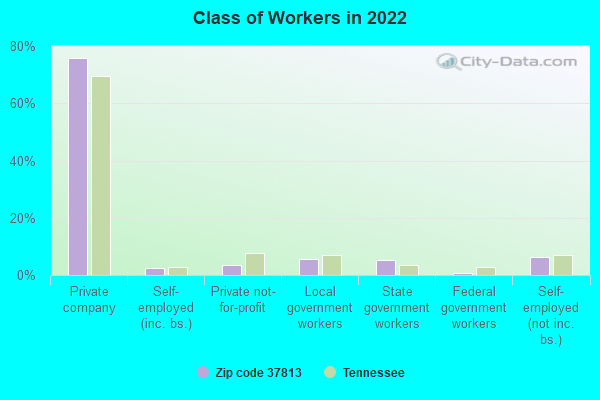
Class of Workers - Employee of private company (%)
Class of Workers - Self-employed in own incorporated business (%)
Class of Workers - Private not-for-profit wage and salary workers (%)
Class of Workers - Local government workers (%)
Class of Workers - State government workers (%)
Class of Workers - Federal government workers (%)
Class of Workers - Self-employed workers in own not incorporated business and Unpaid family workers (%)
House heating fuel used in houses and condos - Utility gas (%)
House heating fuel used in houses and condos - Bottled, tank, or LP gas (%)
House heating fuel used in houses and condos - Electricity (%)
House heating fuel used in houses and condos - Fuel oil, kerosene, etc. (%)
House heating fuel used in houses and condos - Coal or coke (%)
House heating fuel used in houses and condos - Wood (%)
House heating fuel used in houses and condos - Solar energy (%)
House heating fuel used in houses and condos - Other fuel (%)
House heating fuel used in houses and condos - No fuel used (%)
House heating fuel used in apartments - Utility gas (%)
House heating fuel used in apartments - Bottled, tank, or LP gas (%)
House heating fuel used in apartments - Electricity (%)
House heating fuel used in apartments - Fuel oil, kerosene, etc. (%)
House heating fuel used in apartments - Coal or coke (%)
House heating fuel used in apartments - Wood (%)
House heating fuel used in apartments - Solar energy (%)
House heating fuel used in apartments - Other fuel (%)
House heating fuel used in apartments - No fuel used (%)
Armed forces status - In Armed Forces (%)
Armed forces status - Civilian (%)
Armed forces status - Civilian - Veteran (%)
Armed forces status - Civilian - Nonveteran (%)
Fatal accidents locations in years 2005-2021
Fatal accidents locations in 2005
Fatal accidents locations in 2006
Fatal accidents locations in 2007
Fatal accidents locations in 2008
Fatal accidents locations in 2009
Fatal accidents locations in 2010
Fatal accidents locations in 2011
Fatal accidents locations in 2012
Fatal accidents locations in 2013
Fatal accidents locations in 2014
Fatal accidents locations in 2015
Fatal accidents locations in 2016
Fatal accidents locations in 2017
Fatal accidents locations in 2018
Fatal accidents locations in 2019
Fatal accidents locations in 2020
Fatal accidents locations in 2021
Alcohol use - People drinking some alcohol every month (%)
Alcohol use - People not drinking at all (%)
Alcohol use - Average days/month drinking alcohol
Alcohol use - Average drinks/week
Alcohol use - Average days/year people drink much
Audiometry - Average condition of hearing (%)
Audiometry - People that can hear a whisper from across a quiet room (%)
Audiometry - People that can hear normal voice from across a quiet room (%)
Audiometry - Ears ringing, roaring, buzzing (%)
Audiometry - Had a job exposure to loud noise (%)
Audiometry - Had off-work exposure to loud noise (%)
Blood Pressure & Cholesterol - Has high blood pressure (%)
Blood Pressure & Cholesterol - Checking blood pressure at home (%)
Blood Pressure & Cholesterol - Frequently checking blood cholesterol (%)
Blood Pressure & Cholesterol - Has high cholesterol level (%)
Consumer Behavior - Money monthly spent on food at supermarket/grocery store
Consumer Behavior - Money monthly spent on food at other stores
Consumer Behavior - Money monthly spent on eating out
Consumer Behavior - Money monthly spent on carryout/delivered foods
Consumer Behavior - Income spent on food at supermarket/grocery store (%)
Consumer Behavior - Income spent on food at other stores (%)
Consumer Behavior - Income spent on eating out (%)
Consumer Behavior - Income spent on carryout/delivered foods (%)
Current Health Status - General health condition (%)
Current Health Status - Blood donors (%)
Current Health Status - Has blood ever tested for HIV virus (%)
Current Health Status - Left-handed people (%)
Dermatology - People using sunscreen (%)
Diabetes - Diabetics (%)
Diabetes - Had a blood test for high blood sugar (%)
Diabetes - People taking insulin (%)
Diet Behavior & Nutrition - Diet health (%)
Diet Behavior & Nutrition - Milk product consumption (# of products/month)
Diet Behavior & Nutrition - Meals not home prepared (#/week)
Diet Behavior & Nutrition - Meals from fast food or pizza place (#/week)
Diet Behavior & Nutrition - Ready-to-eat foods (#/month)
Diet Behavior & Nutrition - Frozen meals/pizza (#/month)
Drug Use - People that ever used marijuana or hashish (%)
Drug Use - Ever used hard drugs (%)
Drug Use - Ever used any form of cocaine (%)
Drug Use - Ever used heroin (%)
Drug Use - Ever used methamphetamine (%)
Health Insurance - People covered by health insurance (%)
Kidney Conditions-Urology - Avg. # of times urinating at night
Medical Conditions - People with asthma (%)
Medical Conditions - People with anemia (%)
Medical Conditions - People with psoriasis (%)
Medical Conditions - People with overweight (%)
Medical Conditions - Elderly people having difficulties in thinking or remembering (%)
Medical Conditions - People who ever received blood transfusion (%)
Medical Conditions - People having trouble seeing even with glass/contacts (%)
Medical Conditions - People with arthritis (%)
Medical Conditions - People with gout (%)
Medical Conditions - People with congestive heart failure (%)
Medical Conditions - People with coronary heart disease (%)
Medical Conditions - People with angina pectoris (%)
Medical Conditions - People who ever had heart attack (%)
Medical Conditions - People who ever had stroke (%)
Medical Conditions - People with emphysema (%)
Medical Conditions - People with thyroid problem (%)
Medical Conditions - People with chronic bronchitis (%)
Medical Conditions - People with any liver condition (%)
Medical Conditions - People who ever had cancer or malignancy (%)
Mental Health - People who have little interest in doing things (%)
Mental Health - People feeling down, depressed, or hopeless (%)
Mental Health - People who have trouble sleeping or sleeping too much (%)
Mental Health - People feeling tired or having little energy (%)
Mental Health - People with poor appetite or overeating (%)
Mental Health - People feeling bad about themself (%)
Mental Health - People who have trouble concentrating on things (%)
Mental Health - People moving or speaking slowly or too fast (%)
Mental Health - People having thoughts they would be better off dead (%)
Oral Health - Average years since last visit a dentist
Oral Health - People embarrassed because of mouth (%)
Oral Health - People with gum disease (%)
Oral Health - General health of teeth and gums (%)
Oral Health - Average days a week using dental floss/device
Oral Health - Average days a week using mouthwash for dental problem
Oral Health - Average number of teeth
Pesticide Use - Households using pesticides to control insects (%)
Pesticide Use - Households using pesticides to kill weeds (%)
Physical Activity - People doing vigorous-intensity work activities (%)
Physical Activity - People doing moderate-intensity work activities (%)
Physical Activity - People walking or bicycling (%)
Physical Activity - People doing vigorous-intensity recreational activities (%)
Physical Activity - People doing moderate-intensity recreational activities (%)
Physical Activity - Average hours a day doing sedentary activities
Physical Activity - Average hours a day watching TV or videos
Physical Activity - Average hours a day using computer
Physical Functioning - People having limitations keeping them from working (%)
Physical Functioning - People limited in amount of work they can do (%)
Physical Functioning - People that need special equipment to walk (%)
Physical Functioning - People experiencing confusion/memory problems (%)
Physical Functioning - People requiring special healthcare equipment (%)
Prescription Medications - Average number of prescription medicines taking
Preventive Aspirin Use - Adults 40+ taking low-dose aspirin (%)
Reproductive Health - Vaginal deliveries (%)
Reproductive Health - Cesarean deliveries (%)
Reproductive Health - Deliveries resulted in a live birth (%)
Reproductive Health - Pregnancies resulted in a delivery (%)
Reproductive Health - Women breastfeeding newborns (%)
Reproductive Health - Women that had a hysterectomy (%)
Reproductive Health - Women that had both ovaries removed (%)
Reproductive Health - Women that have ever taken birth control pills (%)
Reproductive Health - Women taking birth control pills (%)
Reproductive Health - Women that have ever used Depo-Provera or injectables (%)
Reproductive Health - Women that have ever used female hormones (%)
Sexual Behavior - People 18+ that ever had sex (vaginal, anal, or oral) (%)
Sexual Behavior - Males 18+ that ever had vaginal sex with a woman (%)
Sexual Behavior - Males 18+ that ever performed oral sex on a woman (%)
Sexual Behavior - Males 18+ that ever had anal sex with a woman (%)
Sexual Behavior - Males 18+ that ever had any sex with a man (%)
Sexual Behavior - Females 18+ that ever had vaginal sex with a man (%)
Sexual Behavior - Females 18+ that ever performed oral sex on a man (%)
Sexual Behavior - Females 18+ that ever had anal sex with a man (%)
Sexual Behavior - Females 18+ that ever had any kind of sex with a woman (%)
Sexual Behavior - Average age people first had sex
Sexual Behavior - Average number of female sex partners in lifetime (males 18+)
Sexual Behavior - Average number of female vaginal sex partners in lifetime (males 18+)
Sexual Behavior - Average age people first performed oral sex on a woman (18+)
Sexual Behavior - Average number of woman performed oral sex on in lifetime (18+)
Sexual Behavior - Average number of male sex partners in lifetime (males 18+)
Sexual Behavior - Average number of male anal sex partners in lifetime (males 18+)
Sexual Behavior - Average age people first performed oral sex on a man (18+)
Sexual Behavior - Average number of male oral sex partners in lifetime (18+)
Sexual Behavior - People using protection when performing oral sex (%)
Sexual Behavior - Average number of times people have vaginal or anal sex a year
Sexual Behavior - People having sex without condom (%)
Sexual Behavior - Average number of male sex partners in lifetime (females 18+)
Sexual Behavior - Average number of male vaginal sex partners in lifetime (females 18+)
Sexual Behavior - Average number of female sex partners in lifetime (females 18+)
Sexual Behavior - Circumcised males 18+ (%)
Sleep Disorders - Average hours sleeping at night
Sleep Disorders - People that has trouble sleeping (%)
Smoking-Cigarette Use - People smoking cigarettes (%)
Taste & Smell - People 40+ having problems with smell (%)
Taste & Smell - People 40+ having problems with taste (%)
Taste & Smell - People 40+ that ever had wisdom teeth removed (%)
Taste & Smell - People 40+ that ever had tonsils teeth removed (%)
Taste & Smell - People 40+ that ever had a loss of consciousness because of a head injury (%)
Taste & Smell - People 40+ that ever had a broken nose or other serious injury to face or skull (%)
Taste & Smell - People 40+ that ever had two or more sinus infections (%)
Weight - Average height (inches)
Weight - Average weight (pounds)
Weight - Average BMI
Weight - People that are obese (%)
Weight - People that ever were obese (%)
Weight - People trying to lose weight (%)
Urban population: 10,602
Rural population: 6,901
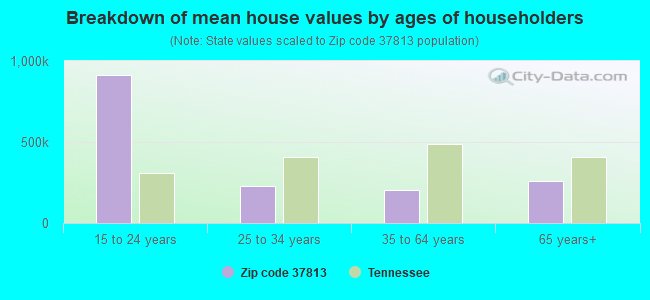
Estimated median house/condo value in 2022: $170,438
37813:
$170,438Tennessee:
$284,800
According to our research of Tennessee and other state lists, there were 29 registered sex offenders living in 37813 zip code as of April 24, 2024 . The ratio of all residents to sex offenders in zip code 37813 is 588 to 1.The ratio of registered sex offenders to all residents in this zip code is lower than the state average.
Median resident age: This zip code:
40.2 yearsTennessee median age:
39.2 years
Average household size: This zip code:
2.5 peopleTennessee:
2.4 people
Averages for the 2020 tax year for zip code 37813, filed in 2021:
Average Adjusted Gross Income (AGI) in 2020: $42,009 (Individual Income Tax Returns) Here:
$42,009State:
$69,014
Salary/wage: $37,597 (reported on 84.8% of returns )Here:
$37,597State:
$55,872
(% of AGI for various income ranges: 1106.5% for AGIs below $25k , 3591.3% for AGIs $25k-50k , 6078.5% for AGIs $50k-75k , 8901.8% for AGIs $75k-100k , 15754.8% for AGIs $100k-200k , 56720.0% for AGIs over 200k ) Taxable interest for individuals: $1,595 (reported on 19.2% of returns )This zip code:
$1,595Tennessee:
$1,945
(% of AGI for various income ranges: 11.1% for AGIs below $25k , 14.7% for AGIs $25k-50k , 28.7% for AGIs $50k-75k , 44.5% for AGIs $75k-100k , 167.6% for AGIs $100k-200k , 2850.0% for AGIs over 200k ) Ordinary dividends: $3,543 (reported on 6.8% of returns )(% of AGI for various income ranges: 6.7% for AGIs below $25k , 11.8% for AGIs $25k-50k , 18.7% for AGIs $50k-75k , 26.8% for AGIs $75k-100k , 181.0% for AGIs $100k-200k , 2133.3% for AGIs over 200k ) Net capital gain/loss in AGI: +$10,504 (reported on 7.3% of returns )Here:
+$10,504State:
+$33,664
(% of AGI for various income ranges: 4.7% for AGIs below $25k , 14.2% for AGIs $25k-50k , 54.9% for AGIs $50k-75k , 107.4% for AGIs $75k-100k , 482.4% for AGIs $100k-200k , 10523.3% for AGIs over 200k ) Profit/loss from business: +$13,971 (reported on 12.6% of returns )Here:
+$13,971State:
+$18,991
(% of AGI for various income ranges: 129.3% for AGIs below $25k , 119.3% for AGIs $25k-50k , 164.9% for AGIs $50k-75k , 241.3% for AGIs $75k-100k , 622.4% for AGIs $100k-200k , 11713.3% for AGIs over 200k ) Taxable individual retirement arrangement distribution: $12,786 (reported on 4.9% of returns )37813:
$12,786Tennessee:
$20,036
(% of AGI for various income ranges: 29.1% for AGIs below $25k , 49.6% for AGIs $25k-50k , 94.7% for AGIs $50k-75k , 196.3% for AGIs $75k-100k , 541.0% for AGIs $100k-200k ) Total itemized deductions: $36,755 (reported on 1.5% of returns )Here:
$36,755State:
$40,136
(% of AGI for various income ranges: 23.3% for AGIs below $25k , 102.2% for AGIs $50k-75k , 260.7% for AGIs $100k-200k , 6230.0% for AGIs over 200k ) Charity contributions: $19,757 (reported on 0.9% of returns )Here:
$19,757State:
$19,852
(% of AGI for various income ranges: 133.7% for AGIs $75k-100k , 2916.7% for AGIs over 200k ) Taxes paid: $4,880 (reported on 1.3% of returns )(% of AGI for various income ranges: 1.7% for AGIs below $25k , 9.5% for AGIs $50k-75k , 45.2% for AGIs $100k-200k , 796.7% for AGIs over 200k ) Earned income credit: $2,472 (reported on 25.5% of returns )(% of AGI for various income ranges: 120.8% for AGIs below $25k , 82.3% for AGIs $25k-50k , 1.4% for AGIs $50k-75k ) Percentage of individuals using paid preparers for their 2020 taxes: 95.5%(% for various income ranges: 94.8% for AGIs below $25k , 95.9% for AGIs $25k-50k , 95.9% for AGIs $50k-75k , 98.0% for AGIs $75k-100k , 93.8% for AGIs $100k-200k , 100.0% for AGIs over 200k )
Averages for the 2012 tax year for zip code 37813, filed in 2013:
Average Adjusted Gross Income (AGI) in 2012: $33,856 (Individual Income Tax Returns) Here:
$33,856State:
$53,767
Salary/wage: $30,950 (reported on 87.0% of returns )Here:
$30,950State:
$45,421
(% of AGI for various income ranges: 80.3% for AGIs below $25k , 84.4% for AGIs $25k-50k , 81.8% for AGIs $50k-75k , 79.9% for AGIs $75k-100k , 72.5% for AGIs $100k-200k , 66.9% for AGIs over 200k ) Taxable interest for individuals: $1,111 (reported on 19.9% of returns )This zip code:
$1,111Tennessee:
$1,732
(% of AGI for various income ranges: 0.7% for AGIs below $25k , 0.4% for AGIs $25k-50k , 0.4% for AGIs $50k-75k , 0.5% for AGIs $75k-100k , 0.8% for AGIs $100k-200k , 2.0% for AGIs over 200k ) Ordinary dividends: $2,223 (reported on 7.4% of returns )(% of AGI for various income ranges: 0.5% for AGIs below $25k , 0.4% for AGIs $25k-50k , 0.4% for AGIs $50k-75k , 0.2% for AGIs $75k-100k , 1.0% for AGIs $100k-200k , 0.6% for AGIs over 200k ) Net capital gain/loss in AGI: +$4,721 (reported on 5.9% of returns )Here:
+$4,721State:
+$19,082
(% of AGI for various income ranges: 0.5% for AGIs $75k-100k , 2.0% for AGIs $100k-200k , 5.9% for AGIs over 200k ) Profit/loss from business: +$11,962 (reported on 12.9% of returns )Here:
+$11,962State:
+$15,240
(% of AGI for various income ranges: 7.1% for AGIs below $25k , 3.0% for AGIs $25k-50k , 2.0% for AGIs $50k-75k , 2.3% for AGIs $75k-100k , 4.9% for AGIs $100k-200k , 12.0% for AGIs over 200k ) Taxable individual retirement arrangement distribution: $8,736 (reported on 5.9% of returns )37813:
$8,736Tennessee:
$15,505
(% of AGI for various income ranges: 1.7% for AGIs below $25k , 1.4% for AGIs $25k-50k , 1.0% for AGIs $50k-75k , 1.8% for AGIs $75k-100k , 2.7% for AGIs $100k-200k ) Total itemized deductions: $17,999 (23% of AGI, reported on 10.9% of returns )Here:
$17,999State:
$21,976
Here:
23.1% of AGIState:
17.8% of AGI
(% of AGI for various income ranges: 4.1% for AGIs below $25k , 4.5% for AGIs $25k-50k , 5.7% for AGIs $50k-75k , 7.4% for AGIs $75k-100k , 9.0% for AGIs $100k-200k , 6.9% for AGIs over 200k ) Charity contributions: $5,576 (reported on 7.7% of returns )(% of AGI for various income ranges: 0.4% for AGIs below $25k , 0.7% for AGIs $25k-50k , 0.9% for AGIs $50k-75k , 1.8% for AGIs $75k-100k , 3.0% for AGIs $100k-200k , 2.5% for AGIs over 200k ) Taxes paid: $3,167 (reported on 10.6% of returns )(% of AGI for various income ranges: 0.6% for AGIs below $25k , 0.7% for AGIs $25k-50k , 0.9% for AGIs $50k-75k , 1.2% for AGIs $75k-100k , 1.7% for AGIs $100k-200k , 1.7% for AGIs over 200k ) Earned income credit: $2,333 (reported on 29.4% of returns )(% of AGI for various income ranges: 8.3% for AGIs below $25k , 1.2% for AGIs $25k-50k ) Percentage of individuals using paid preparers for their 2012 taxes: 63.5%(% for various income ranges: 61.9% for AGIs below $25k , 65.8% for AGIs $25k-50k , 64.1% for AGIs $50k-75k , 61.8% for AGIs $75k-100k , 68.0% for AGIs $100k-200k , 83.3% for AGIs over 200k )
Averages for the 2004 tax year for zip code 37813, filed in 2005:
Average Adjusted Gross Income (AGI) in 2004: $30,328 (Individual Income Tax Returns) Here:
$30,328State:
$44,088
Salary/wage: $28,628 (reported on 87.8% of returns )Here:
$28,628State:
$38,825
(% of AGI for various income ranges: 92.3% for AGIs below $10k , 83.8% for AGIs $10k-25k , 87.2% for AGIs $25k-50k , 88.9% for AGIs $50k-75k , 84.2% for AGIs $75k-100k , 58.7% for AGIs over 100k ) Taxable interest for individuals: $1,382 (reported on 28.5% of returns )This zip code:
$1,382Tennessee:
$1,802
(% of AGI for various income ranges: 3.3% for AGIs below $10k , 1.4% for AGIs $10k-25k , 1.0% for AGIs $25k-50k , 0.9% for AGIs $50k-75k , 0.9% for AGIs $75k-100k , 2.2% for AGIs over 100k ) Taxable dividends: $1,359 (reported on 10.3% of returns )(% of AGI for various income ranges: 0.6% for AGIs below $10k , 0.3% for AGIs $10k-25k , 0.3% for AGIs $25k-50k , 0.4% for AGIs $50k-75k , 0.4% for AGIs $75k-100k , 1.1% for AGIs over 100k ) Net capital gain/loss: +$7,808 (reported on 8.0% of returns )Here:
+$7,808State:
+$15,776
(% of AGI for various income ranges: -0.3% for AGIs below $10k , 0.3% for AGIs $10k-25k , 0.4% for AGIs $25k-50k , 0.5% for AGIs $50k-75k , 0.5% for AGIs $75k-100k , 12.6% for AGIs over 100k ) Profit/loss from business: +$6,853 (reported on 14.1% of returns )Here:
+$6,853State:
+$12,882
(% of AGI for various income ranges: 7.1% for AGIs below $10k , 4.4% for AGIs $10k-25k , 2.1% for AGIs $25k-50k , 1.0% for AGIs $50k-75k , 3.4% for AGIs $75k-100k , 6.5% for AGIs over 100k ) IRA payment deduction: $2,378 (reported on 2.0% of returns )37813:
$2,378Tennessee:
$2,934
(% of AGI for various income ranges: 0.1% for AGIs $10k-25k , 0.1% for AGIs $25k-50k , 0.1% for AGIs $50k-75k , 0.2% for AGIs $75k-100k , 0.2% for AGIs over 100k ) Self-employed pension: $8,400 (reported on 0.2% of returns )Here:
$8,400Tennessee:
$16,857
Total itemized deductions: $15,874 (24% of AGI, reported on 12.3% of returns )Here:
$15,874State:
$18,035
Here:
24.4% of AGIState:
19.9% of AGI
(% of AGI for various income ranges: 2.7% for AGIs below $10k , 3.5% for AGIs $10k-25k , 5.5% for AGIs $25k-50k , 6.7% for AGIs $50k-75k , 9.1% for AGIs $75k-100k , 10.7% for AGIs over 100k ) Charity contributions deductions: $5,096 (7% of AGI, reported on 10.0% of returns )Here:
7.3% of AGIState:
5.3% of AGI
(% of AGI for various income ranges: 0.4% for AGIs $10k-25k , 1.1% for AGIs $25k-50k , 1.2% for AGIs $50k-75k , 2.2% for AGIs $75k-100k , 5.4% for AGIs over 100k ) Total tax: $3,716 (reported on 66.8% of returns )(% of AGI for various income ranges: 2.8% for AGIs below $10k , 3.4% for AGIs $10k-25k , 6.2% for AGIs $25k-50k , 8.6% for AGIs $50k-75k , 10.9% for AGIs $75k-100k , 17.3% for AGIs over 100k ) Earned income credit: $1,820 (reported on 26.9% of returns )Percentage of individuals using paid preparers for their 2004 taxes: 65.3%(% for various income ranges: 58.6% for AGIs below $10k , 68.5% for AGIs $10k-25k , 66.5% for AGIs $25k-50k , 65.2% for AGIs $50k-75k , 66.8% for AGIs $75k-100k , 73.3% for AGIs over 100k )
Estimated median household income in 2022: This zip code:
$42,382Tennessee:
$65,254
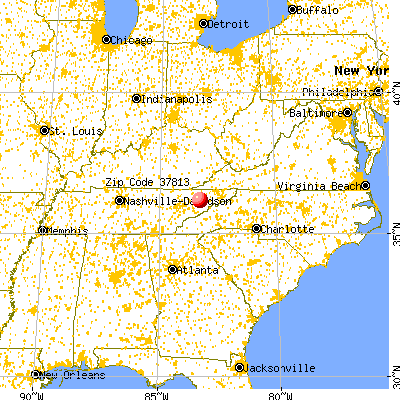
Nearest zip codes: 37890 ,
37814 ,
37860 ,
37810 ,
37877 ,
37713 .
White Pine Zip Code Map
Percentage of family households: This zip code:
49.4%Tennessee:
46.2%
Percentage of households with unmarried partners: This zip code:
4.2%Tennessee:
47.1%
No gay or lesbian households reported
Household received Food Stamps/SNAP in the past 12 months: 1,593Household did not receive Food Stamps/SNAP in the past 12 months: 5,335
Women who had a birth in the past 12 months: 190 (134 now married , 56 unmarried) Women who did not have a birth in the past 12 months: 3,418 (1,491 now married , 1,927 unmarried)
Housing units in zip code 37813 with a mortgage: 2,212 (153
second mortgage , 81
both second mortgage and home equity loan )
Houses without a mortgage: 11
Median monthly owner costs for units with a mortgage: $1,005
Median monthly owner costs for units without a mortgage: $378
Residents with income below the poverty level in 2022:
This zip code:
26.8%Whole state:
13.3%
Residents with income below 50% of the poverty level in 2022:
This zip code:
13.1%Whole state:
7.1%
Median number of rooms in houses and condos: Median number of rooms in apartments: Notable locations in this zip code not listed on our city pages
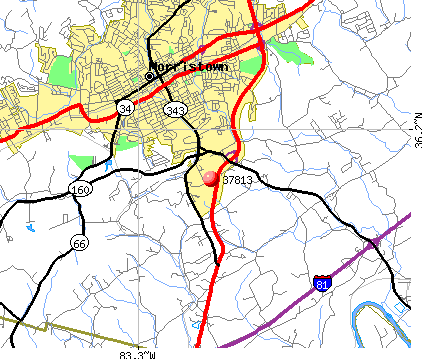
Click to draw/clear zip code borders Notable locations in zip code 37813: (A) , Morristown Golf and Country Club (B) , New Line (C) , Lowland (D) , South Hamblen County Volunteer Fire Department (E) , Morristown Fire Department Station 6 (F) , Morristown Fire Department (G) . Display/hide their locations on the map
Shopping Centers: (1) , Northfield Court Shopping Center (2) , Downtown Mall Shopping Center (3) , Cumberland Shopping Center (4) . Display/hide their locations on the map
Churches in zip code 37813 include: (A) , Witt Baptist Church (B) , Mount Carmel Church (C) , Statem Gap Church (D) , Solid Rock Church (E) , Fry Church (F) , Calvary Baptist Church (G) , Cherokee Hills Baptist Church (H) , Fernwood Church (I) . Display/hide their locations on the map
Cemeteries: (1) , Weaver Cemetery (2) , McFarland Cemetery (3) , Carter Cemetery (4) , Cedar Grove Cemetery (5) , Moser Cemetery (6) , Thomas Jarnagin Cemetery (7) . Display/hide their locations on the map
Lakes and reservoirs: (A) , Cluck Ponds (B) , Masengill Lake (C) , Barrett Pond (D) , Mayes Lake (E) . Display/hide their locations on the map
Streams, rivers, and creeks: (A) , Flat Creek (B) , Robinson Creek (C) , Dry Branch (D) , Bailey Branch (E) , Williams Branch (F) , West Fork Creek (G) , Turkey Creek (H) , Thompson Creek (I) . Display/hide their locations on the map
Parks in zip code 37813 include: (1) , Frank Lorino Park (2) . Display/hide their locations on the map
Year house built (houses)
12 2020 or later234 2010 to 2019609 2000 to 2009994 1990 to 19991,177 1980 to 19891,235 1970 to 19791,204 1960 to 1969964 1950 to 1959647 1940 to 1949191 1939 or earlier
Zip code 37813 household income distribution in 2022 766 Less than $10,000374 $10,000 to $14,999296 $15,000 to $19,999553 $20,000 to $24,999383 $25,000 to $29,999500 $30,000 to $34,999365 $35,000 to $39,999291 $40,000 to $44,999351 $45,000 to $49,999447 $50,000 to $59,999659 $60,000 to $74,999941 $75,000 to $99,999421 $100,000 to $124,999231 $125,000 to $149,999219 $150,000 to $199,999106 $200,000 or moreEstimate of home value of owner-occupied houses/condos in 2022 in zip code 37813 25 Less than $10,00031 $10,000 to $14,99936 $15,000 to $19,99961 $30,000 to $34,9998 $35,000 to $39,99983 $40,000 to $49,99959 $50,000 to $59,99981 $60,000 to $69,999107 $70,000 to $79,999137 $80,000 to $89,999202 $90,000 to $99,999719 $100,000 to $124,999268 $125,000 to $149,999411 $150,000 to $174,999138 $175,000 to $199,999615 $200,000 to $249,999261 $250,000 to $299,999258 $300,000 to $399,99961 $400,000 to $499,999184 $500,000 to $749,99911 $750,000 to $999,99963 $1,000,000 to $1,499,999Rent paid by renters in 2022 in zip code 37813 109 Less than $100120 $100 to $149143 $150 to $199149 $200 to $24914 $250 to $29947 $300 to $349132 $400 to $449151 $450 to $499146 $500 to $549167 $550 to $599248 $600 to $649164 $650 to $699116 $700 to $74930 $750 to $799231 $800 to $89920 $900 to $99951 $1,000 to $1,24930 $1,250 to $1,49986 No cash rent
Median gross rent in 2022: $784.
Median price asked for vacant for-sale houses and condos in 2022: $154,909.
Estimated median house (or condo) value in 2022 for: White Non-Hispanic householders: $175,936Black or African American householders: $140,796American Indian or Alaska Native householders: $187,171Asian householders: $203,187Some other race householders: $956,175Two or more races householders: $149,402Hispanic or Latino householders: $101,593Estimated median house or condo value in 2022: $170,438
37813:
$170,438Tennessee:
$284,800
Lower value quartile - upper value quartile: $121,856 - $260,630
Mean price in 2022: Detached houses: $263,596Here:
$263,596State:
$374,382
Townhouses or other attached units: $1,025,023Here:
$1,025,023State:
$354,101
In 2-unit structures: $171,265Here:
$171,265State:
$247,693
In 3-to-4-unit structures: $309,627Here:
$309,627State:
$239,060
In 5-or-more-unit structures: $1,205,975Here:
$1,205,975State:
$317,434
Mobile homes: $62,754Here:
$62,754State:
$101,421
Housing units in structures:
One, detached: 5,575One, attached: 59Two: 4353 or 4: 2985 to 9: 29310 to 19: 13120 to 49: 4050 or more: 8Mobile homes: 716Unemployment : 5.4%
Means of transportation to work in zip code 37813 78.0% 5,088 Drove a car alone7.6% 495 Carpooled0.6% 37 Bus or trolley bus0.2% 15 Bicycle1.3% 84 Walked4.3% 278 Other means6.5% 427 Worked at homeTravel time to work (commute) in zip code 37813 284 Less than 5 minutes1,094 5 to 9 minutes1,283 10 to 14 minutes998 15 to 19 minutes716 20 to 24 minutes168 25 to 29 minutes437 30 to 34 minutes128 35 to 39 minutes51 40 to 44 minutes176 45 to 59 minutes523 60 to 89 minutes96 90 or more minutes
Percentage of zip code residents living and working in this county: 74.2%
Household type by relationship:
Households: 17,504
Male householders: 3,752 (837 living alone ), Female householders: 3,215 (1,041 living alone )3,381 spouses (3,376 opposite-sex spouses ), 403 unmarried partners , (403 opposite-sex unmarried partners ), 5,161 children (4,970 natural , 103 adopted , 96 stepchildren ), 542 grandchildren , 260 brothers or sisters , 132 parents , 7 foster children , 257 other relatives , 385 non-relatives In group quarters: 6 (-1 institutionalized population )
Size of family households: 2,033 2-persons , 1,322 3-persons , 835 4-persons , 400 5-persons , 54 6-persons , 94 7-or-more-persons
Size of nonfamily households: 1,879 1-person , 226 2-persons , 28 3-persons , 53 4-persons , 53 6-persons
1,990 married couples with children. single-parent households (607 men , 1,110 women ).
82.5% of residents of 37813 zip code speak English at home. of residents speak Spanish at home (49% very well, 15% well, 25% not well, 11% not at all ).of residents speak other Indo-European language at home (42% very well, 58% well ).of residents speak Asian or Pacific Island language at home (80% very well, 2% well, 19% not well ).of residents speak other language at home (100% very well ).
Foreign born population: 1,800 (10.3%)
(13.9%
of them are naturalized citizens )
This zip code:
10.3%Whole state:
5.6%
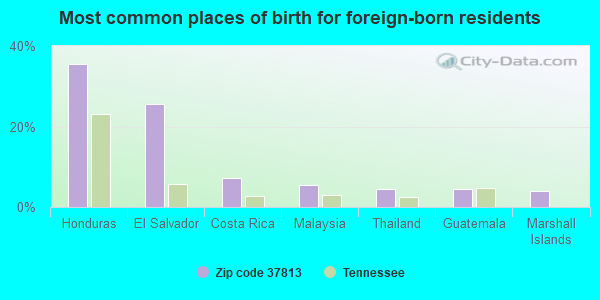
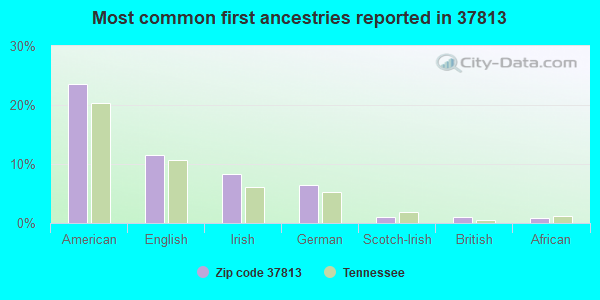
35% Honduras 26% El Salvador 7% Costa Rica 5% Malaysia 4% Thailand 4% Guatemala 4% Marshall Islands 24% American 12% English 8% Irish 6% German 1% Scotch-Irish 1% British 1% African
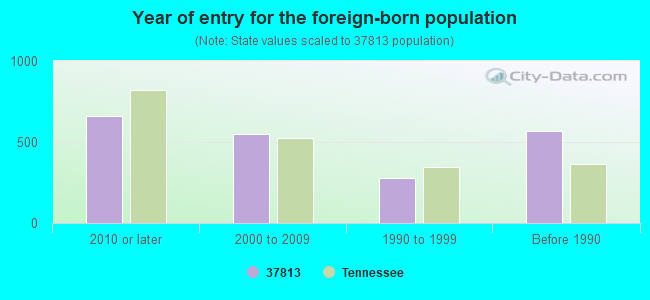
Year of entry for the foreign-born population
661 2010 or later 550 2000 to 2009 279 1990 to 1999 565 Before 1990
There are
123 Medical Specialists in Zip Code 37813 .
Facilities with environmental interests located in this zip code:
ANCHOR ADVANCED PRODUCTS INC (209 DESOTO AVENUE in MORRISTOWN, TN)
AIR MINOR (AIRS/AFS) Conditionally Exempt Small Quantity Generators, less than 100 kg/month of hazardous waste (Resource Conservation and Recovery Act (tracking hazardous waste)) - notification Business SIC classification: PLASTICS PRODUCTSBusiness NAICS classification: ALL OTHER PLASTICS PRODUCT MANUFACTURING.Organizations: RHONDA STINES (CONTACT/OPERATOR)
, MOLL INDUSTRIES INC (CONTACT/OWNER)
Alternative names: ANCHOR BRUSH COMPANY PLANT C
AUTO SUPPLY & PARTS INC (1012 SOUTH CUMBERLAND ST in MORRISTOWN, TN)
Conditionally Exempt Small Quantity Generators, less than 100 kg/month of hazardous waste (Resource Conservation and Recovery Act (tracking hazardous waste)) - notification Business NAICS classification: OTHER ENGINE EQUIPMENT MANUFACTURING.Organizations: HENRY HART (CONTACT/OPERATOR)
Housing units lacking complete plumbing facilities: 2.1%
Housing units lacking complete kitchen facilities: 3.5%
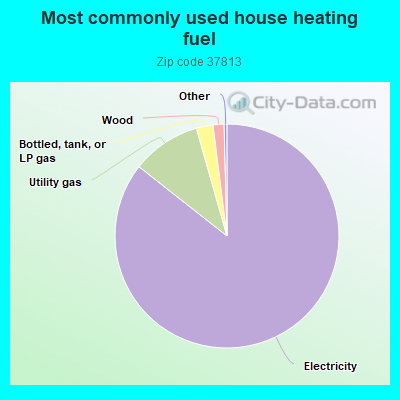
85.7% Electricity 10.0% Utility gas 2.4% Bottled, tank, or LP gas 1.6% Wood
Population in 1990: 15,333. Population change in the 1990s: +1,410 (+9.2%).
Place of birth for U.S.-born residents:
This state: 11,314Northeast: 544Midwest: 800South: 2,316West: 374
57% of the 37813 zip code residents lived in the same house 5 years ago.
Out of people who lived in different houses, 62% lived in this county.
Out of people who lived in different counties, 50% lived in Tennessee.
95% of the 37813 zip code residents lived in the same house 1 year ago.
Out of people who lived in different houses, 31% moved from this county.
Out of people who lived in different houses, 45% moved from different county within same state.
Out of people who lived in different houses, 25% moved from different state.
Out of people who lived in different houses, 11% moved from abroad.
Private vs. public school enrollment:
Students in private schools in grades 1 to 8 (elementary and middle school): 73
Students in private schools in grades 9 to 12 (high school): 137
Here:
12.1%Tennessee:
16.2%
Students in private undergraduate colleges: 8
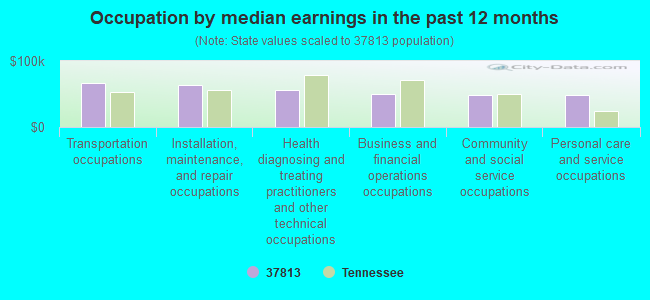
Occupation by median earnings in the past 12 months ($)
66,738 Transportation occupations 63,391 Installation, maintenance, and repair occupations 55,516 Health diagnosing and treating practitioners and other technical occupations 50,227 Business and financial operations occupations 49,154 Community and social service occupations 48,876 Personal care and service occupations
Top industries in this zip code by the number of employees in 2005:
Health Care and Social Assistance: Offices of Physicians (except Mental Health Specialists) (250-499 employees: 1 establishment, 10-19 employees: 1 establishment, 5-9 employees: 3 establishments, 1-4 employees: 6 establishments)Health Care and Social Assistance: Residential Mental Retardation Facilities (250-499: 1)Accommodation and Food Services: Limited-Service Restaurants (20-49: 7, 10-19: 4, 5-9: 1)Administrative and Support and Waste Management and Remediation Services: Temporary Help Services (100-249: 1, 50-99: 1, 1-4: 1)Wholesale Trade: Industrial and Personal Service Paper Merchant Wholesalers (100-249: 1, 50-99: 1)
People in group quarters in 2000:
151 people in nursing homes
7 people in homes for the mentally retarded
2 people in other noninstitutional group quarters
Fatal accident statistics in 2014:
Fatal accident count: 2Vehicles involved in fatal accidents: 3Fatal accidents caused by drunken drivers: 1Fatalities: 2Persons involved in fatal accidents: 4Pedestrians involved in fatal accidents: 0
Fatal accident statistics in 2013:
Fatal accident count: 3Vehicles involved in fatal accidents: 5Fatal accidents caused by drunken drivers: 0Fatalities: 4Persons involved in fatal accidents: 8Pedestrians involved in fatal accidents: 1
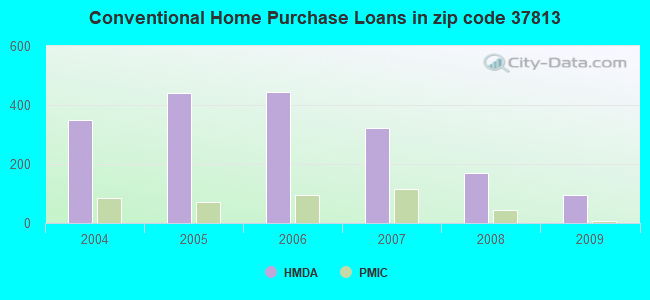
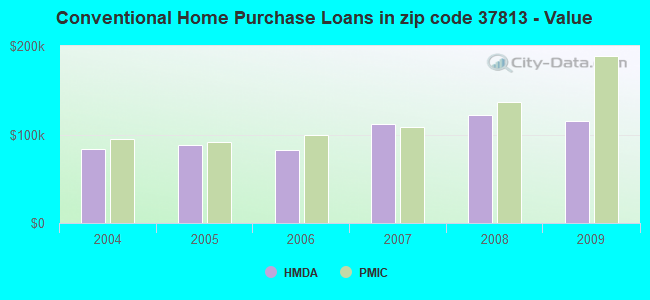
Home Mortgage Disclosure Act Aggregated Statistics For Year 2009(Based on 2 full and 8 partial tracts) A) FHA, FSA/RHS & VA B) Conventional C) Refinancings D) Home Improvement Loans E) Loans on Dwellings For 5+ Families F) Non-occupant Loans on G) Loans On Manufactured Number Average Value Number Average Value Number Average Value Number Average Value Number Average Value Number Average Value Number Average Value
LOANS ORIGINATED 127 $107,181 94 $115,294 471 $113,489 49 $38,390 2 $38,245 70 $69,096 15 $52,543 APPLICATIONS APPROVED, NOT ACCEPTED 14 $98,548 11 $98,722 38 $90,059 9 $13,124 0 $0 2 $63,225 6 $58,362 APPLICATIONS DENIED 10 $118,870 27 $102,686 196 $102,095 38 $37,421 0 $0 19 $54,199 16 $53,257 APPLICATIONS WITHDRAWN 22 $97,189 22 $121,370 104 $124,931 10 $65,863 0 $0 14 $69,882 7 $101,806 FILES CLOSED FOR INCOMPLETENESS 1 $88,020 2 $199,505 40 $156,823 4 $40,040 0 $0 0 $0 3 $97,573
Aggregated Statistics For Year 2008(Based on 2 full and 8 partial tracts) A) FHA, FSA/RHS & VA B) Conventional C) Refinancings D) Home Improvement Loans E) Loans on Dwellings For 5+ Families F) Non-occupant Loans on G) Loans On Manufactured Number Average Value Number Average Value Number Average Value Number Average Value Number Average Value Number Average Value Number Average Value
LOANS ORIGINATED 125 $103,917 171 $122,050 445 $109,936 51 $37,635 7 $306,309 92 $118,533 52 $76,080 APPLICATIONS APPROVED, NOT ACCEPTED 15 $82,578 10 $88,779 57 $77,835 8 $25,359 0 $0 14 $62,105 14 $59,244 APPLICATIONS DENIED 19 $94,768 41 $105,054 275 $107,244 69 $46,770 0 $0 11 $74,816 33 $64,214 APPLICATIONS WITHDRAWN 12 $98,422 12 $148,504 138 $123,410 10 $84,382 0 $0 8 $179,102 7 $89,939 FILES CLOSED FOR INCOMPLETENESS 4 $107,855 6 $105,743 28 $133,230 2 $58,900 0 $0 2 $99,440 2 $55,870
Aggregated Statistics For Year 2007(Based on 2 full and 8 partial tracts) A) FHA, FSA/RHS & VA B) Conventional C) Refinancings D) Home Improvement Loans E) Loans on Dwellings For 5+ Families F) Non-occupant Loans on G) Loans On Manufactured Number Average Value Number Average Value Number Average Value Number Average Value Number Average Value Number Average Value Number Average Value
LOANS ORIGINATED 70 $102,268 322 $112,052 429 $93,104 79 $43,939 12 $707,747 109 $90,962 44 $60,120 APPLICATIONS APPROVED, NOT ACCEPTED 11 $76,760 38 $97,817 74 $83,773 10 $13,889 0 $0 4 $81,300 6 $110,148 APPLICATIONS DENIED 11 $91,495 77 $88,209 505 $97,572 66 $66,780 0 $0 35 $92,385 25 $55,720 APPLICATIONS WITHDRAWN 5 $74,504 29 $96,101 173 $102,077 19 $84,704 2 $307,665 5 $79,200 10 $64,737 FILES CLOSED FOR INCOMPLETENESS 2 $52,695 13 $70,747 71 $108,669 2 $31,445 0 $0 0 $0 2 $61,650
Aggregated Statistics For Year 2006(Based on 2 full and 8 partial tracts) A) FHA, FSA/RHS & VA B) Conventional C) Refinancings D) Home Improvement Loans E) Loans on Dwellings For 5+ Families F) Non-occupant Loans on G) Loans On Manufactured Number Average Value Number Average Value Number Average Value Number Average Value Number Average Value Number Average Value Number Average Value
LOANS ORIGINATED 88 $86,219 443 $82,205 453 $87,358 61 $37,909 4 $312,382 127 $73,274 72 $52,556 APPLICATIONS APPROVED, NOT ACCEPTED 4 $105,355 76 $67,791 75 $95,023 9 $80,449 0 $0 25 $42,509 39 $42,003 APPLICATIONS DENIED 7 $82,496 177 $64,575 437 $94,568 97 $45,388 0 $0 80 $51,983 107 $49,753 APPLICATIONS WITHDRAWN 9 $73,569 45 $79,422 265 $101,438 14 $82,712 0 $0 17 $74,797 10 $34,239 FILES CLOSED FOR INCOMPLETENESS 2 $77,065 16 $66,722 58 $106,496 0 $0 0 $0 1 $101,920 2 $77,065
Aggregated Statistics For Year 2005(Based on 2 full and 8 partial tracts) A) FHA, FSA/RHS & VA B) Conventional C) Refinancings D) Home Improvement Loans E) Loans on Dwellings For 5+ Families F) Non-occupant Loans on G) Loans On Manufactured Number Average Value Number Average Value Number Average Value Number Average Value Number Average Value Number Average Value Number Average Value
LOANS ORIGINATED 76 $86,025 441 $87,750 554 $85,292 53 $30,842 9 $616,683 167 $78,149 50 $53,210 APPLICATIONS APPROVED, NOT ACCEPTED 9 $68,068 61 $71,984 104 $71,289 14 $43,551 2 $76,945 6 $59,040 29 $56,127 APPLICATIONS DENIED 16 $97,408 173 $63,028 506 $86,261 90 $36,895 0 $0 27 $134,158 125 $49,779 APPLICATIONS WITHDRAWN 9 $102,474 51 $84,223 327 $100,411 32 $63,124 0 $0 23 $99,471 15 $63,487 FILES CLOSED FOR INCOMPLETENESS 0 $0 12 $83,632 54 $107,345 4 $65,425 0 $0 5 $64,744 0 $0
Aggregated Statistics For Year 2004(Based on 2 full and 8 partial tracts) A) FHA, FSA/RHS & VA B) Conventional C) Refinancings D) Home Improvement Loans E) Loans on Dwellings For 5+ Families F) Non-occupant Loans on G) Loans On Manufactured Number Average Value Number Average Value Number Average Value Number Average Value Number Average Value Number Average Value Number Average Value
LOANS ORIGINATED 97 $80,794 349 $83,610 574 $85,542 58 $32,092 2 $121,970 145 $79,041 64 $56,482 APPLICATIONS APPROVED, NOT ACCEPTED 5 $64,848 65 $60,381 150 $78,014 12 $51,574 0 $0 9 $55,783 40 $49,154 APPLICATIONS DENIED 21 $68,576 198 $59,373 413 $82,240 72 $28,013 0 $0 16 $61,992 137 $47,465 APPLICATIONS WITHDRAWN 9 $61,461 35 $67,138 314 $101,208 9 $47,512 0 $0 15 $76,925 10 $78,863 FILES CLOSED FOR INCOMPLETENESS 0 $0 3 $90,687 23 $183,592 0 $0 0 $0 0 $0 0 $0
Private Mortgage Insurance Companies Aggregated Statistics For Year 2009(Based on 2 full and 4 partial tracts) A) Conventional B) Refinancings C) Non-occupant Loans on Number Average Value Number Average Value Number Average Value
LOANS ORIGINATED 7 $188,410 13 $155,805 1 $166,770 APPLICATIONS APPROVED, NOT ACCEPTED 7 $239,340 5 $149,012 0 $0 APPLICATIONS DENIED 0 $0 0 $0 0 $0 APPLICATIONS WITHDRAWN 6 $111,563 1 $150,890 0 $0 FILES CLOSED FOR INCOMPLETENESS 2 $91,475 1 $187,290 0 $0
Aggregated Statistics For Year 2008(Based on 2 full and 8 partial tracts) A) Conventional B) Refinancings C) Non-occupant Loans on D) Loans On Manufactured Number Average Value Number Average Value Number Average Value Number Average Value
LOANS ORIGINATED 43 $136,907 20 $104,784 7 $128,917 2 $59,240 APPLICATIONS APPROVED, NOT ACCEPTED 7 $103,720 11 $124,320 2 $59,460 0 $0 APPLICATIONS DENIED 5 $66,496 4 $120,095 6 $76,148 2 $59,240 APPLICATIONS WITHDRAWN 3 $72,020 1 $82,060 0 $0 0 $0 FILES CLOSED FOR INCOMPLETENESS 2 $91,515 2 $111,885 2 $111,885 2 $91,515
Aggregated Statistics For Year 2007(Based on 2 full and 8 partial tracts) A) Conventional B) Refinancings C) Non-occupant Loans on Number Average Value Number Average Value Number Average Value
LOANS ORIGINATED 115 $108,216 38 $141,693 16 $83,901 APPLICATIONS APPROVED, NOT ACCEPTED 2 $110,485 8 $78,684 0 $0 APPLICATIONS DENIED 2 $89,240 2 $127,195 2 $127,195 APPLICATIONS WITHDRAWN 0 $0 2 $203,860 0 $0 FILES CLOSED FOR INCOMPLETENESS 0 $0 0 $0 0 $0
Aggregated Statistics For Year 2006(Based on 2 full and 8 partial tracts) A) Conventional B) Refinancings C) Non-occupant Loans on Number Average Value Number Average Value Number Average Value
LOANS ORIGINATED 96 $98,982 28 $123,819 16 $104,304 APPLICATIONS APPROVED, NOT ACCEPTED 6 $125,757 11 $141,298 0 $0 APPLICATIONS DENIED 0 $0 0 $0 0 $0 APPLICATIONS WITHDRAWN 0 $0 2 $85,380 0 $0 FILES CLOSED FOR INCOMPLETENESS 0 $0 0 $0 0 $0
Aggregated Statistics For Year 2005(Based on 2 full and 8 partial tracts) A) Conventional B) Refinancings C) Non-occupant Loans on D) Loans On Manufactured Number Average Value Number Average Value Number Average Value Number Average Value
LOANS ORIGINATED 70 $91,769 53 $120,771 17 $79,772 2 $56,630 APPLICATIONS APPROVED, NOT ACCEPTED 3 $85,053 3 $103,373 0 $0 2 $91,515 APPLICATIONS DENIED 1 $1,257,420 0 $0 1 $628,710 0 $0 APPLICATIONS WITHDRAWN 2 $194,570 4 $110,780 0 $0 0 $0 FILES CLOSED FOR INCOMPLETENESS 0 $0 0 $0 0 $0 0 $0
Aggregated Statistics For Year 2004(Based on 2 full and 8 partial tracts) A) Conventional B) Refinancings C) Non-occupant Loans on D) Loans On Manufactured Number Average Value Number Average Value Number Average Value Number Average Value
LOANS ORIGINATED 85 $94,576 55 $109,580 10 $58,200 2 $63,580 APPLICATIONS APPROVED, NOT ACCEPTED 9 $65,787 22 $91,091 2 $56,945 0 $0 APPLICATIONS DENIED 0 $0 3 $96,637 0 $0 0 $0 APPLICATIONS WITHDRAWN 5 $103,144 1 $73,460 0 $0 0 $0 FILES CLOSED FOR INCOMPLETENESS 0 $0 1 $84,050 0 $0 0 $0
2002 - 2018 National Fire Incident Reporting System (NFIRS) incidents See full 2006 National Fire Incident Reporting System statistics for zip code 37813, Tennessee
Most common first names in zip code 37813 among deceased individuals Name Count Lived (average)
James 90 71.1 years Mary 72 76.8 years William 64 75.2 years Robert 52 70.8 years John 46 72.6 years Charles 39 69.7 years George 31 75.8 years Margaret 30 77.9 years Roy 28 72.0 years Helen 22 77.0 years
Most common last names in zip code 37813 among deceased individuals Last name Count Lived (average)
Smith 33 74.2 years Long 31 71.3 years Collins 29 75.9 years Johnson 29 71.6 years Moore 25 68.5 years Williams 24 78.1 years Davis 23 70.5 years Greene 21 73.3 years Trent 20 77.9 years Jones 19 69.6 years
Businesses in zip code 37813
Name Count Name Count
AT&T 1 Long John Silver's 1 Advance Auto Parts 1 Maurices 1 Aeropostale 1 McDonald's 2 American Eagle Outfitters 1 Nike 6 Arby's 1 OfficeMax 1 AutoZone 1 Penske 1 Bath & Body Works 1 Pier 1 Imports 1 Cracker Barrel 1 RadioShack 1 Dairy Queen 1 Rite Aid 1 Dunkin Donuts 1 Ruby Tuesday 1 FedEx 3 Rue21 1 Ford 1 Ryan's Grill 1 GNC 1 Sears 2 GameStop 1 Subway 1 H&R Block 2 Super 8 1 Hardee's 2 T-Mobile 1 Hobby Lobby 1 U-Haul 2 Holiday Inn 2 UPS 2 IHOP 1 Vans 1 JCPenney 1 Verizon Wireless 1 Jones New York 1 Waffle House 1 Journeys 1 Walgreens 1 KFC 1 Walmart 1 Little Caesars Pizza 1 Wendy's 1


 Nearest zip codes: 37890, 37814, 37860, 37810, 37877, 37713.
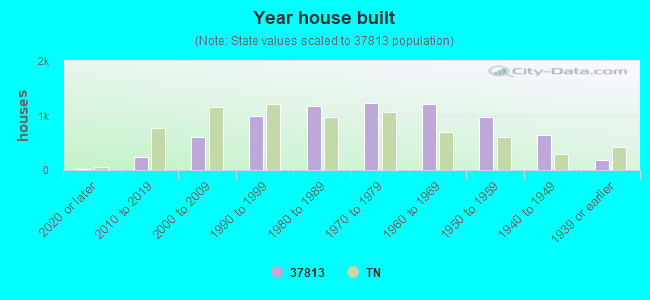


 Based on the data from the years 2002 - 2018 the average number of fires per year is 147. The highest number of fires - 292 took place in 2007, and the least - 76 in 2009. The data has a declining trend.
 When looking into fire subcategories, the most reports belonged to: Outside Fires (40.6%), and Structure Fires (31.8%).