Estimated zip code population in 2022: 3,461 Zip code population in 2010: 2,757 Zip code population in 2000: 2,623
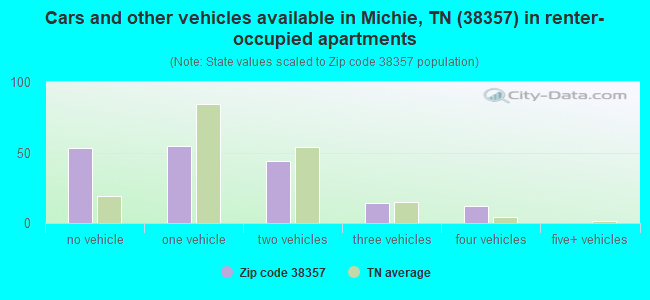
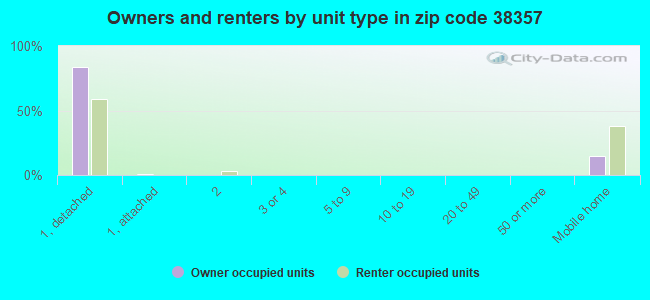
Houses and condos: 1,560 Renter-occupied apartments: 180
% of renters here:
14%
State:
33%
March 2022 cost of living index in zip code 38357: 79.6 (low, U.S. average is 100)
Land area: 61.6 sq. mi. Water area: 0.0 sq. mi.
Population density: 56 people per square mile
(very low).
OSM Map
General Map
Google Map
MSN Map
OSM Map
General Map
Google Map
MSN Map
OSM Map
General Map
Google Map
MSN Map
OSM Map
General Map
Google Map
MSN Map
Please wait while loading the map...
Real estate property taxes paid for housing units in 2022:
This zip code:
0.4% ($738)
Tennessee:
0.5% ($1,376)
Median real estate property taxes paid for housing units with mortgages in 2022: $817 (0.4%) Median real estate property taxes paid for housing units with no mortgage in 2022: $715 (0.4%)
Business Search- 14 Million verified businesses
Males: 1,669
(48.2%)
Females: 1,791
(51.8%)
For population 25 years and over in 38357:
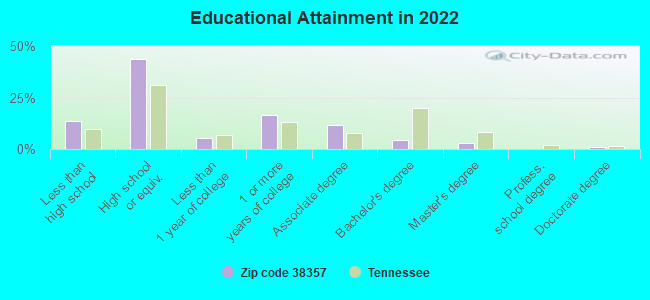
High school or higher: 84.4%
Bachelor's degree or higher: 8.5%
Graduate or professional degree: 4.0%
Unemployed: 5.2%
Mean travel time to work (commute): 31.3 minutes
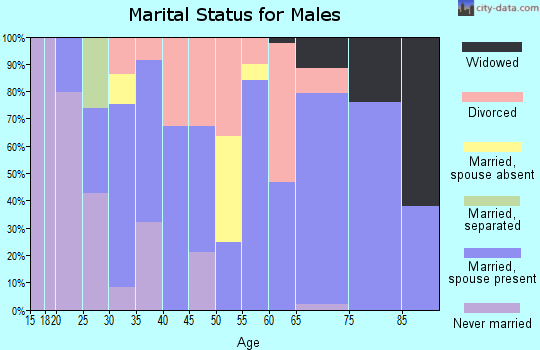
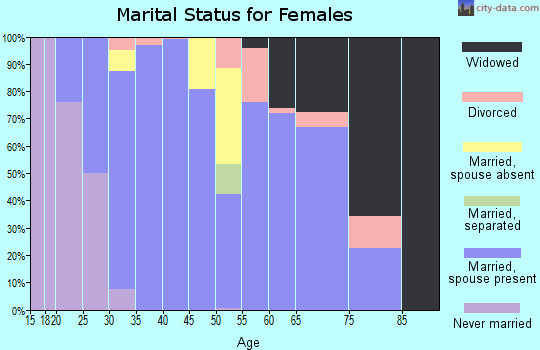
For population 15 years and over in 38357:
Never married: 21.1%
Now married: 59.2%
Separated: 0.4%
Widowed: 5.2%
Divorced: 14.1%
Zip code 38357 compared to state average:
Median house value below state average.
Black race population percentage significantly below state average.
Hispanic race population percentage below state average.
Foreign-born population percentage significantly below state average.
Renting percentage significantly below state average.
Length of stay since moving in significantly above state average.
Number of college students below state average.
Percentage of population with a bachelor's degree or higher significantly below state average.
Averages for the 2020 tax year for zip code 38357, filed in 2021:
Average Adjusted Gross Income (AGI) in 2020: $51,089 (Individual Income Tax Returns)
Here:
$51,089
State:
$69,014
Salary/wage: $46,850 (reported on 79.3% of returns)
Here:
$46,850
State:
$55,872
(% of AGI for various income ranges: 1071.9% for AGIs below $25k, 3357.4% for AGIs $25k-50k, 6018.5% for AGIs $50k-75k, 10126.7% for AGIs $75k-100k, 18682.2% for AGIs $100k-200k)
Taxable interest for individuals: $816 (reported on 21.6% of returns)
This zip code:
$816
Tennessee:
$1,945
(% of AGI for various income ranges: 15.8% for AGIs below $25k, 18.5% for AGIs $25k-50k, 33.8% for AGIs $50k-75k, 23.3% for AGIs $75k-100k, 52.2% for AGIs $100k-200k)
Ordinary dividends: $1,000 (reported on 7.8% of returns)
Here:
$1,000
State:
$8,105
(% of AGI for various income ranges: 3.5% for AGIs below $25k, 6.7% for AGIs $25k-50k, 26.2% for AGIs $50k-75k, 30.0% for AGIs $100k-200k)
Net capital gain/loss in AGI: +$6,620 (reported on 8.6% of returns)
Here:
+$6,620
State:
+$33,664
(% of AGI for various income ranges: 47.4% for AGIs $25k-50k, 53.8% for AGIs $50k-75k, 516.7% for AGIs $100k-200k)
Profit/loss from business: +$17,450 (reported on 15.5% of returns)
Here:
+$17,450
State:
+$18,991
(% of AGI for various income ranges: 203.2% for AGIs below $25k, 235.2% for AGIs $25k-50k, 368.5% for AGIs $50k-75k, 1552.2% for AGIs $100k-200k)
Taxable individual retirement arrangement distribution: $12,318 (reported on 9.5% of returns)
38357:
$12,318
Tennessee:
$20,036
(% of AGI for various income ranges: 54.5% for AGIs below $25k, 199.6% for AGIs $25k-50k, 1078.3% for AGIs $75k-100k)
Earned income credit: $2,592 (reported on 21.6% of returns)
Here:
$2,592
State:
$2,391
(% of AGI for various income ranges: 128.7% for AGIs below $25k, 92.2% for AGIs $25k-50k)
Percentage of individuals using paid preparers for their 2020 taxes: 94.8%
Here:
95%
State:
93%
(% for various income ranges: 95.1% for AGIs below $25k, 97.0% for AGIs $25k-50k, 100.0% for AGIs $50k-75k, 90.0% for AGIs $75k-100k, 85.7% for AGIs $100k-200k, 100.0% for AGIs over 200k)
Averages for the 2012 tax year for zip code 38357, filed in 2013:
Average Adjusted Gross Income (AGI) in 2012: $38,584 (Individual Income Tax Returns)
Here:
$38,584
State:
$53,767
Salary/wage: $34,995 (reported on 81.2% of returns)
Here:
$34,995
State:
$45,421
(% of AGI for various income ranges: 70.3% for AGIs below $25k, 79.6% for AGIs $25k-50k, 77.0% for AGIs $50k-75k, 86.0% for AGIs $75k-100k, 59.8% for AGIs $100k-200k)
Taxable interest for individuals: $870 (reported on 24.1% of returns)
This zip code:
$870
Tennessee:
$1,732
(% of AGI for various income ranges: 1.1% for AGIs below $25k, 0.6% for AGIs $25k-50k, 0.6% for AGIs $50k-75k, 0.1% for AGIs $75k-100k, 0.3% for AGIs $100k-200k)
Ordinary dividends: $775 (reported on 7.1% of returns)
Here:
$775
State:
$6,739
(% of AGI for various income ranges: 0.1% for AGIs below $25k, 0.3% for AGIs $25k-50k, 0.2% for AGIs $50k-75k)
Net capital gain/loss in AGI: +$1,600 (reported on 6.2% of returns)
Here:
+$1,600
State:
+$19,082
Profit/loss from business: +$10,229 (reported on 18.8% of returns)
Here:
+$10,229
State:
+$15,240
(% of AGI for various income ranges: 13.1% for AGIs below $25k, 3.5% for AGIs $25k-50k, 2.9% for AGIs $50k-75k, 9.3% for AGIs $75k-100k)
Taxable individual retirement arrangement distribution: $7,862 (reported on 7.1% of returns)
38357:
$7,862
Tennessee:
$15,505
(% of AGI for various income ranges: 2.4% for AGIs below $25k, 2.7% for AGIs $25k-50k, 2.1% for AGIs $50k-75k)
Total itemized deductions: $18,328 (24% of AGI, reported on 16.1% of returns)
Here:
$18,328
State:
$21,976
Here:
24.5% of AGI
State:
17.8% of AGI
(% of AGI for various income ranges: 8.8% for AGIs $25k-50k, 8.6% for AGIs $50k-75k, 10.3% for AGIs $75k-100k, 9.2% for AGIs $100k-200k)
Charity contributions: $4,746 (reported on 11.6% of returns)
Here:
$4,746
State:
$6,709
(% of AGI for various income ranges: 1.0% for AGIs $25k-50k, 1.5% for AGIs $50k-75k, 2.1% for AGIs $75k-100k, 2.3% for AGIs $100k-200k)
Taxes paid: $3,044 (reported on 16.1% of returns)
38357:
$3,044
State:
$4,829
(% of AGI for various income ranges: 1.2% for AGIs $25k-50k, 1.5% for AGIs $50k-75k, 1.7% for AGIs $75k-100k, 1.7% for AGIs $100k-200k)
Earned income credit: $2,488 (reported on 29.5% of returns)
Here:
$2,488
State:
$2,404
(% of AGI for various income ranges: 9.5% for AGIs below $25k, 1.4% for AGIs $25k-50k)
Percentage of individuals using paid preparers for their 2012 taxes: 69.6%
Here:
70%
State:
52%
(% for various income ranges: 69.1% for AGIs below $25k, 67.9% for AGIs $25k-50k, 73.3% for AGIs $50k-75k, 75.0% for AGIs $75k-100k, 66.7% for AGIs $100k-200k)
Averages for the 2004 tax year for zip code 38357, filed in 2005:
Average Adjusted Gross Income (AGI) in 2004: $31,953 (Individual Income Tax Returns)
Here:
$31,953
State:
$44,088
Salary/wage: $30,492 (reported on 86.1% of returns)
Here:
$30,492
State:
$38,825
(% of AGI for various income ranges: 85.3% for AGIs below $10k, 80.4% for AGIs $10k-25k, 86.4% for AGIs $25k-50k, 88.4% for AGIs $50k-75k, 82.0% for AGIs $75k-100k, 58.9% for AGIs over 100k)
Taxable interest for individuals: $944 (reported on 29.6% of returns)
This zip code:
$944
Tennessee:
$1,802
(% of AGI for various income ranges: 2.9% for AGIs below $10k, 1.7% for AGIs $10k-25k, 1.1% for AGIs $25k-50k, 0.5% for AGIs $50k-75k, 0.2% for AGIs $75k-100k, 0.2% for AGIs over 100k)
Taxable dividends: $912 (reported on 10.5% of returns)
Here:
$912
State:
$3,727
(% of AGI for various income ranges: 1.0% for AGIs below $10k, 0.2% for AGIs $10k-25k, 0.1% for AGIs $25k-50k, 0.2% for AGIs $50k-75k, 1.3% for AGIs over 100k)
Net capital gain/loss: +$4,430 (reported on 9.2% of returns)
Here:
+$4,430
State:
+$15,776
(% of AGI for various income ranges: 0.1% for AGIs $10k-25k, 0.3% for AGIs $25k-50k, 1.5% for AGIs $50k-75k, 6.1% for AGIs over 100k)
Profit/loss from business: +$7,785 (reported on 17.7% of returns)
Here:
+$7,785
State:
+$12,882
(% of AGI for various income ranges: 19.3% for AGIs below $10k, 5.8% for AGIs $10k-25k, 2.3% for AGIs $25k-50k, 2.0% for AGIs $50k-75k, 12.9% for AGIs over 100k)
IRA payment deduction: $4,067 (reported on 1.4% of returns)
38357:
$4,067
Tennessee:
$2,934
Total itemized deductions: $15,897 (26% of AGI, reported on 13.4% of returns)
Here:
$15,897
State:
$18,035
Here:
26.1% of AGI
State:
19.9% of AGI
(% of AGI for various income ranges: 3.1% for AGIs $10k-25k, 5.6% for AGIs $25k-50k, 6.7% for AGIs $50k-75k, 12.3% for AGIs $75k-100k, 11.3% for AGIs over 100k)
Charity contributions deductions: $4,009 (6% of AGI, reported on 9.9% of returns)
Here:
$4,009
State:
$5,167
Here:
6.0% of AGI
State:
5.3% of AGI
(% of AGI for various income ranges: 0.6% for AGIs $10k-25k, 0.9% for AGIs $25k-50k, 1.1% for AGIs $50k-75k, 3.4% for AGIs $75k-100k, 2.1% for AGIs over 100k)
Total tax: $3,638 (reported on 70.7% of returns)
38357:
$3,638
State:
$7,482
(% of AGI for various income ranges: 4.4% for AGIs below $10k, 3.7% for AGIs $10k-25k, 5.7% for AGIs $25k-50k, 8.8% for AGIs $50k-75k, 11.0% for AGIs $75k-100k, 16.6% for AGIs over 100k)
Earned income credit: $1,931 (reported on 26.6% of returns)
Here:
$1,931
State:
$1,826
Percentage of individuals using paid preparers for their 2004 taxes: 76.2%
Here:
76%
State:
60%
(% for various income ranges: 74.9% for AGIs below $10k, 76.8% for AGIs $10k-25k, 78.7% for AGIs $25k-50k, 72.5% for AGIs $50k-75k, 75.6% for AGIs $75k-100k, 74.2% for AGIs over 100k)
Household received Food Stamps/SNAP in the past 12 months: 109 Household did not receive Food Stamps/SNAP in the past 12 months: 1,138
Women who had a birth in the past 12 months: 38 (37 now married, 1 unmarried) Women who did not have a birth in the past 12 months: 737 (382 now married, 354 unmarried)
Housing units in zip code 38357 with a mortgage: 500 (9 second mortgage, 9 both second mortgage and home equity loan) Median monthly owner costs for units with a mortgage: $1,080 Median monthly owner costs for units without a mortgage: $392
Residents with income below the poverty level in 2022:
This zip code:
17.2%
Whole state:
13.3%
Residents with income below 50% of the poverty level in 2022:
This zip code:
12.3%
Whole state:
7.1%
Median number of rooms in houses and condos:
Here:
5.9
State:
6.5
Median number of rooms in apartments:
Here:
5.5
State:
4.4
Notable locations in this zip code not listed on our city pages
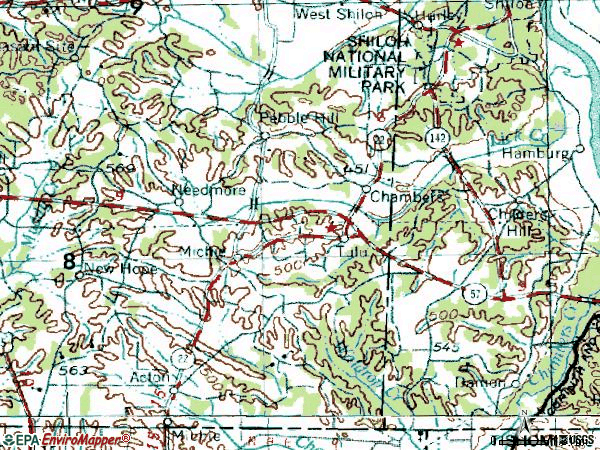
Churches in zip code 38357 include: Michie First Baptist Church (A), Lebanon Church (B), Pebble Hill Church (C), New Hope Church (D), Liberty Church (E), Church of God of Prophecy (F), Acton Church of Christ (G). Display/hide their locations on the map
Cemeteries: Salem Cemetery (1), Sanders Cemetery (2), Carter Cemetery (3), Chambers Cemetery (4), Mount Olive Cemetery (5), Chambers Cemetery (6), Pebble Hill Cemetery (7). Display/hide their locations on the map
Streams, rivers, and creeks: Littlejohn Branch (A), Little Lick Creek (B), Liberty Branch (C), Kelley Branch (D), Donald Springs Branch (E), Burks Branch (F), Brown Branch (G), Singleton Creek (H), Sharp Branch (I). Display/hide their locations on the map
Size of family households: 389 2-persons, 165 3-persons, 233 4-persons, 56 5-persons, 14 6-persons, 10 7-or-more-persons
Size of nonfamily households: 285 1-person, 90 2-persons, 1 4-persons
571 married couples with children.
71 single-parent households (48 men, 23 women).
99.0% of residents of 38357 zip code speak English at home.
0.9% of residents speak Spanish at home (93% very well, 7% well).
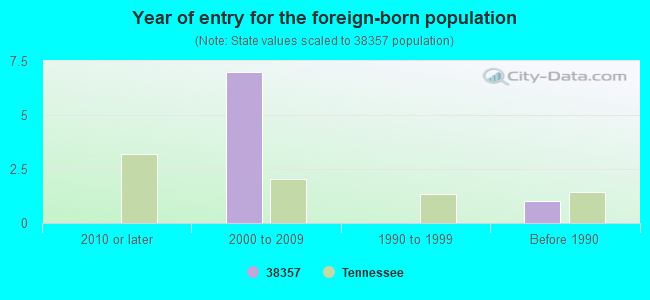
Foreign born population: 7 (0.2%) (0.0% of them are naturalized citizens)
:
0.2%
Whole state:
5.6%
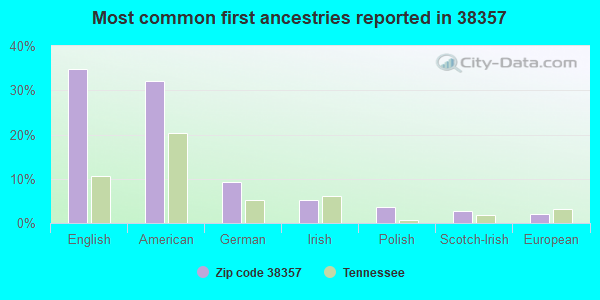
86%Malaysia
35%English
32%American
9%German
5%Irish
4%Polish
3%Scotch-Irish
2%European
Year of entry for the foreign-born population
02010 or later
72000 to 2009
01990 to 1999
1Before 1990
Housing units lacking complete plumbing facilities: 1.2% Housing units lacking complete kitchen facilities: 1.3%
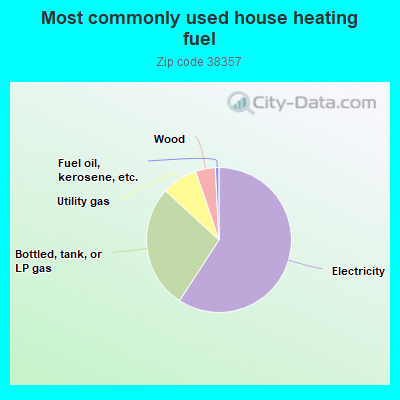
59.3%Electricity
27.7%Bottled, tank, or LP gas
8.0%Utility gas
4.4%Wood
0.8%Fuel oil, kerosene, etc.
Population in 1990: 2,297. Population change in the 1990s: +326 (+14.2%).
Place of birth for U.S.-born residents:
This state: 1,789
Northeast: 29
Midwest: 292
South: 1,219
West: 116
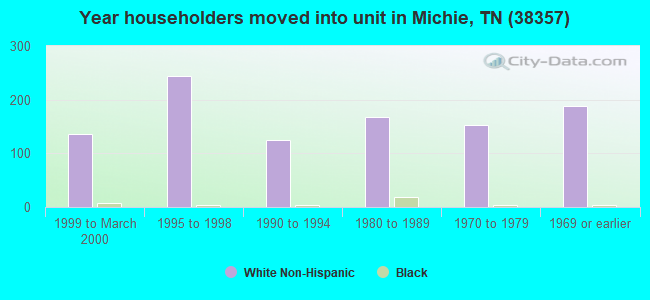
68% of the 38357 zip code residents lived in the same house 5 years ago. Out of people who lived in different houses, 47% lived in this county. Out of people who lived in different counties, 50% lived in Tennessee.
97% of the 38357 zip code residents lived in the same house 1 year ago. Out of people who lived in different houses, 44% moved from this county. Out of people who lived in different houses, 27% moved from different county within same state. Out of people who lived in different houses, 50% moved from different state.
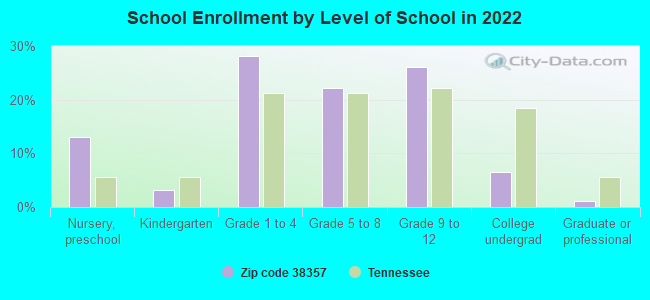
Private vs. public school enrollment:
Students in private schools in grades 1 to 8 (elementary and middle school): 25
Here:
8.4%
Tennessee:
15.0%
Students in private schools in grades 9 to 12 (high school): 8
Here:
5.2%
Tennessee:
16.2%
Students in private undergraduate colleges: 7
Here:
19.8%
Tennessee:
23.5%
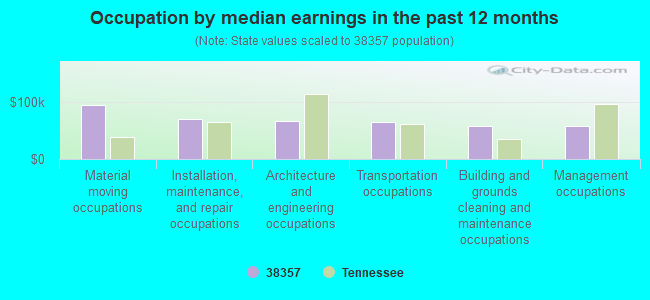
Occupation by median earnings in the past 12 months ($)
94,493Material moving occupations
70,123Installation, maintenance, and repair occupations
67,293Architecture and engineering occupations
66,155Transportation occupations
58,962Building and grounds cleaning and maintenance occupations
58,457Management occupations
Companies with federal contracts located in this zip code:
AMERICAN JOHNNY (4840 HWY 22 in MICHIE, TN; small business) : $10,655 in 3 contractsfrom 2005 to 2006
$7,730 with Air Force for Lease or Rental of Equipment -- Miscellaneous. Taking place in MS. Signed on 2006-02-27. Completion date: 2006-04-10.
$1,950 with Army for Lease or Rental of Equipment -- Miscellaneous. Signed on 2005-05-04. Completion date: 2005-06-23.
$975, same as above.Signed on 2005-06-07. Completion date: 2005-06-23.
Top industries in this zip code by the number of employees in 2005:
Construction: New Single-Family Housing Construction (except Operative Builders) (5-9 employees: 1 establishment, 1-4 employees: 1 establishment)
Health Care and Social Assistance: Offices of Physicians, Mental Health Specialists (5-9: 1)
Other Services (except Public Administration): Religious Organizations (1-4: 1)
Health Care and Social Assistance: Offices of Physicians (except Mental Health Specialists) (1-4: 1)
Finance and Insurance: Commercial Banking (1-4: 1)
Accommodation and Food Services: Limited-Service Restaurants (1-4: 1)
Fatal accident statistics in 2014:
Fatal accident count: 1
Vehicles involved in fatal accidents: 1
Fatal accidents caused by drunken drivers: 0
Fatalities: 1
Persons involved in fatal accidents: 1
Pedestrians involved in fatal accidents: 0
Fatal accident statistics in 2012:
Fatal accident count: 1
Vehicles involved in fatal accidents: 2
Fatal accidents caused by drunken drivers: 0
Fatalities: 2
Persons involved in fatal accidents: 4
Pedestrians involved in fatal accidents: 0
2003 - 2018 National Fire Incident Reporting System (NFIRS) incidents
According to the data from the years 2003 - 2018 the average number of fire incidents per year is 26. The highest number of reported fires - 68 took place in 2007, and the least - 4 in 2003. The data has a rising trend.
When looking into fire subcategories, the most reports belonged to: Outside Fires (52.0%), and Structure Fires (36.7%).
Fire incident types reported to NFIRS in Zip Code 38357

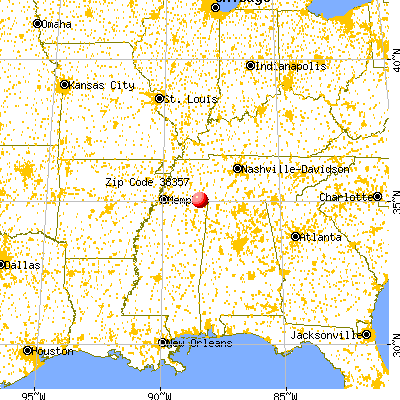


 Nearest zip codes: 38376, 38339, 38379, 38326, 38833, 38365.


 : $10,655 in 3 contracts from 2005 to 2006


 According to the data from the years 2003 - 2018 the average number of fire incidents per year is 26. The highest number of reported fires - 68 took place in 2007, and the least - 4 in 2003. The data has a rising trend.
 When looking into fire subcategories, the most reports belonged to: Outside Fires (52.0%), and Structure Fires (36.7%).