Estimated zip code population in 2022: 1,880 Zip code population in 2010: 1,389 Zip code population in 2000: 1,493
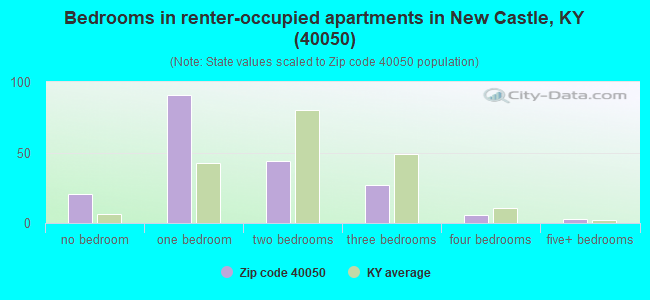
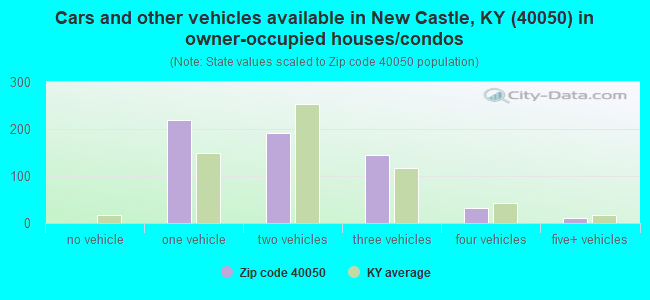
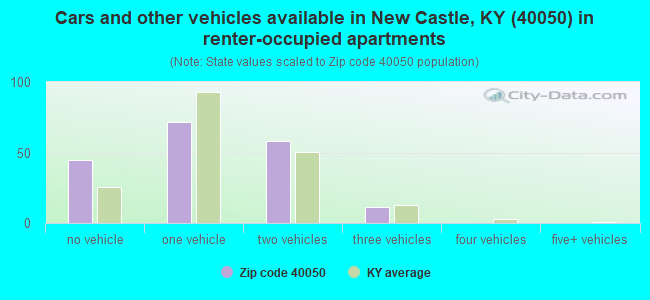
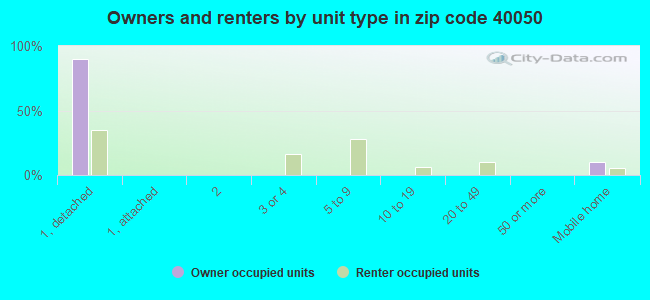
Houses and condos: 863 Renter-occupied apartments: 187
% of renters here:
24%
State:
31%
March 2022 cost of living index in zip code 40050: 82.0 (low, U.S. average is 100)
Land area: 9.7 sq. mi. Water area: 0.1 sq. mi.
Population density: 194 people per square mile
(very low).
OSM Map
General Map
Google Map
MSN Map
OSM Map
General Map
Google Map
MSN Map
OSM Map
General Map
Google Map
MSN Map
OSM Map
General Map
Google Map
MSN Map
Please wait while loading the map...
Real estate property taxes paid for housing units in 2022:
This zip code:
0.8% ($1,180)
Kentucky:
0.7% ($1,456)
Median real estate property taxes paid for housing units with mortgages in 2022: $1,483 (0.7%) Median real estate property taxes paid for housing units with no mortgage in 2022: $753 (0.8%)
Business Search- 14 Million verified businesses
Males: 827
(44.0%)
Females: 1,053
(56.0%)
For population 25 years and over in 40050:
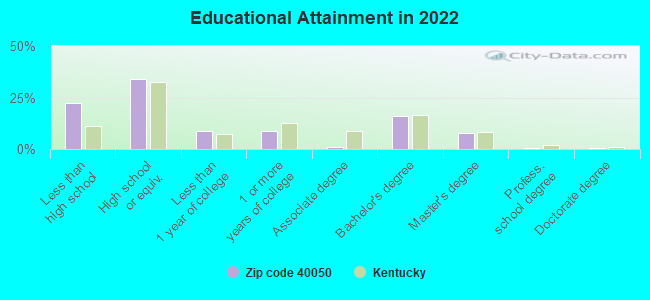
High school or higher: 76.7%
Bachelor's degree or higher: 24.6%
Graduate or professional degree: 8.7%
Unemployed: 2.7%
Mean travel time to work (commute): 26.7 minutes
For population 15 years and over in 40050:
Never married: 26.1%
Now married: 46.0%
Separated: 1.7%
Widowed: 15.5%
Divorced: 10.7%
Zip code 40050 compared to state average:
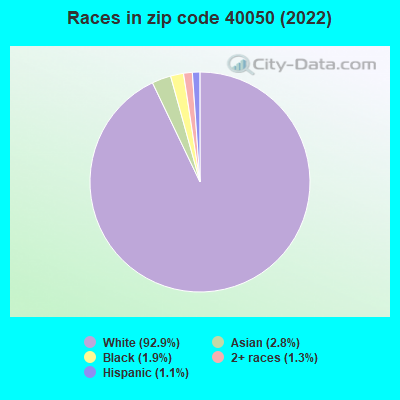
Black race population percentage significantly below state average.
Hispanic race population percentage significantly below state average.
Foreign-born population percentage significantly below state average.
Length of stay since moving in significantly above state average.
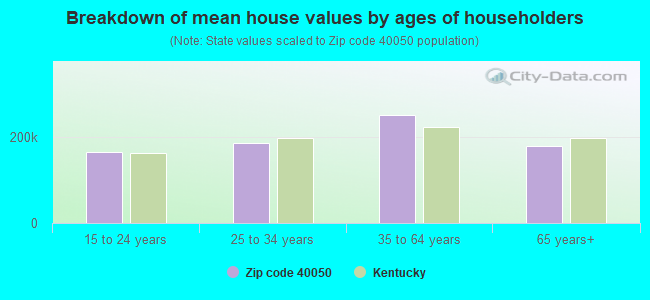
Estimated median house/condo value in 2022: $143,510
40050:
$143,510
Kentucky:
$196,300
According to our research of Kentucky and other state lists, there were 2 registered sex offenders living in 40050 zip code as of April 24, 2024. The ratio of all residents to sex offenders in zip code 40050 is 901 to 1. The ratio of registered sex offenders to all residents in this zip code is lower than the state average.
Median resident age:
This zip code:
42.3 years
Kentucky median age:
39.4 years
Average household size:
This zip code:
2.3 people
Kentucky:
2.4 people
Averages for the 2020 tax year for zip code 40050, filed in 2021:
Average Adjusted Gross Income (AGI) in 2020: $51,536 (Individual Income Tax Returns)
Here:
$51,536
State:
$61,342
Salary/wage: $43,317 (reported on 82.9% of returns)
Here:
$43,317
State:
$50,827
(% of AGI for various income ranges: 1071.1% for AGIs below $25k, 3493.2% for AGIs $25k-50k, 6626.7% for AGIs $50k-75k, 8422.0% for AGIs $75k-100k, 21107.5% for AGIs $100k-200k)
Taxable interest for individuals: $839 (reported on 23.7% of returns)
This zip code:
$839
Kentucky:
$1,441
(% of AGI for various income ranges: 3.7% for AGIs below $25k, 25.8% for AGIs $25k-50k, 43.3% for AGIs $50k-75k, 56.0% for AGIs $75k-100k, 70.0% for AGIs $100k-200k)
Ordinary dividends: $4,488 (reported on 10.5% of returns)
Here:
$4,488
State:
$7,388
(% of AGI for various income ranges: 18.9% for AGIs below $25k, 113.3% for AGIs $50k-75k, 552.5% for AGIs $100k-200k)
Net capital gain/loss in AGI: +$10,133 (reported on 7.9% of returns)
Here:
+$10,133
State:
+$19,475
(% of AGI for various income ranges: 56.7% for AGIs $50k-75k, 1392.5% for AGIs $100k-200k)
Profit/loss from business: +$9,755 (reported on 14.5% of returns)
Here:
+$9,755
State:
+$11,386
(% of AGI for various income ranges: 117.4% for AGIs below $25k, 63.7% for AGIs $25k-50k, 1458.0% for AGIs $75k-100k)
Taxable individual retirement arrangement distribution: $6,100 (reported on 5.3% of returns)
40050:
$6,100
Kentucky:
$18,941
(% of AGI for various income ranges: 58.4% for AGIs below $25k, 147.8% for AGIs $50k-75k)
Total itemized deductions: $30,250 (reported on 2.6% of returns)
Here:
$30,250
State:
$32,473
(% of AGI for various income ranges: 1210.0% for AGIs $75k-100k)
Taxes paid: $8,000 (reported on 2.6% of returns)
40050:
$8,000
State:
$7,830
(% of AGI for various income ranges: 320.0% for AGIs $75k-100k)
Earned income credit: $2,379 (reported on 18.4% of returns)
Here:
$2,379
State:
$2,336
(% of AGI for various income ranges: 109.5% for AGIs below $25k, 65.8% for AGIs $25k-50k)
Percentage of individuals using paid preparers for their 2020 taxes: 94.7%
Here:
95%
State:
94%
(% for various income ranges: 92.0% for AGIs below $25k, 95.7% for AGIs $25k-50k, 92.3% for AGIs $50k-75k, 100.0% for AGIs $75k-100k, 100.0% for AGIs $100k-200k)
Averages for the 2012 tax year for zip code 40050, filed in 2013:
Average Adjusted Gross Income (AGI) in 2012: $40,916 (Individual Income Tax Returns)
Here:
$40,916
State:
$50,814
Salary/wage: $33,733 (reported on 82.9% of returns)
Here:
$33,733
State:
$42,723
(% of AGI for various income ranges: 74.1% for AGIs below $25k, 75.7% for AGIs $25k-50k, 73.4% for AGIs $50k-75k, 68.3% for AGIs $75k-100k, 54.6% for AGIs $100k-200k)
Taxable interest for individuals: $1,562 (reported on 30.0% of returns)
This zip code:
$1,562
Kentucky:
$1,381
(% of AGI for various income ranges: 1.6% for AGIs below $25k, 1.4% for AGIs $25k-50k, 1.7% for AGIs $50k-75k, 0.8% for AGIs $100k-200k)
Ordinary dividends: $4,470 (reported on 14.3% of returns)
Here:
$4,470
State:
$6,239
(% of AGI for various income ranges: 1.4% for AGIs $25k-50k, 2.2% for AGIs $50k-75k, 2.8% for AGIs $100k-200k)
Net capital gain/loss in AGI: +$6,850 (reported on 14.3% of returns)
Here:
+$6,850
State:
+$11,336
(% of AGI for various income ranges: 0.8% for AGIs below $25k, 0.6% for AGIs $25k-50k, 1.2% for AGIs $50k-75k, 7.0% for AGIs $100k-200k)
Profit/loss from business: +$11,582 (reported on 15.7% of returns)
Here:
+$11,582
State:
+$10,862
(% of AGI for various income ranges: 9.6% for AGIs below $25k, 6.1% for AGIs $25k-50k, 12.0% for AGIs $75k-100k)
Taxable individual retirement arrangement distribution: $9,820 (reported on 7.1% of returns)
40050:
$9,820
Kentucky:
$14,296
Total itemized deductions: $18,814 (23% of AGI, reported on 20.0% of returns)
Here:
$18,814
State:
$21,160
Here:
23.5% of AGI
State:
20.0% of AGI
(% of AGI for various income ranges: 7.0% for AGIs below $25k, 4.6% for AGIs $25k-50k, 8.9% for AGIs $50k-75k, 10.6% for AGIs $75k-100k, 14.0% for AGIs $100k-200k)
Charity contributions: $4,500 (reported on 17.1% of returns)
Here:
$4,500
State:
$4,303
(% of AGI for various income ranges: 1.1% for AGIs $25k-50k, 1.5% for AGIs $50k-75k, 2.9% for AGIs $75k-100k, 3.4% for AGIs $100k-200k)
Taxes paid: $6,264 (reported on 20.0% of returns)
40050:
$6,264
State:
$8,496
(% of AGI for various income ranges: 0.9% for AGIs below $25k, 1.2% for AGIs $25k-50k, 2.2% for AGIs $50k-75k, 3.3% for AGIs $75k-100k, 6.4% for AGIs $100k-200k)
Earned income credit: $2,231 (reported on 22.9% of returns)
Here:
$2,231
State:
$2,273
(% of AGI for various income ranges: 7.4% for AGIs below $25k, 0.9% for AGIs $25k-50k)
Percentage of individuals using paid preparers for their 2012 taxes: 72.9%
Here:
73%
State:
60%
(% for various income ranges: 71.0% for AGIs below $25k, 68.4% for AGIs $25k-50k, 70.0% for AGIs $50k-75k, 80.0% for AGIs $75k-100k, 100.0% for AGIs $100k-200k)
Averages for the 2004 tax year for zip code 40050, filed in 2005:
Average Adjusted Gross Income (AGI) in 2004: $37,270 (Individual Income Tax Returns)
Here:
$37,270
State:
$41,540
Salary/wage: $31,428 (reported on 83.8% of returns)
Here:
$31,428
State:
$36,432
(% of AGI for various income ranges: 77.6% for AGIs below $10k, 72.9% for AGIs $10k-25k, 81.1% for AGIs $25k-50k, 75.3% for AGIs $50k-75k, 71.1% for AGIs $75k-100k, 49.7% for AGIs over 100k)
Taxable interest for individuals: $2,299 (reported on 39.3% of returns)
This zip code:
$2,299
Kentucky:
$1,571
(% of AGI for various income ranges: 8.4% for AGIs below $10k, 3.9% for AGIs $10k-25k, 1.6% for AGIs $25k-50k, 2.1% for AGIs $50k-75k, 2.1% for AGIs $75k-100k, 2.4% for AGIs over 100k)
Taxable dividends: $2,104 (reported on 13.3% of returns)
Here:
$2,104
State:
$3,453
(% of AGI for various income ranges: 0.8% for AGIs $10k-25k, 0.1% for AGIs $25k-50k, 1.3% for AGIs $50k-75k, 1.4% for AGIs $75k-100k, 0.5% for AGIs over 100k)
Net capital gain/loss: +$4,189 (reported on 12.5% of returns)
Here:
+$4,189
State:
+$9,663
(% of AGI for various income ranges: 1.9% for AGIs below $10k, 0.3% for AGIs $25k-50k, 0.8% for AGIs $50k-75k, 4.9% for AGIs $75k-100k, 1.7% for AGIs over 100k)
Profit/loss from business: +$7,294 (reported on 19.8% of returns)
Here:
+$7,294
State:
+$9,233
(% of AGI for various income ranges: 12.5% for AGIs below $10k, 4.1% for AGIs $10k-25k, 2.1% for AGIs $25k-50k, 1.4% for AGIs $50k-75k, 10.7% for AGIs over 100k)
Total itemized deductions: $15,023 (21% of AGI, reported on 23.8% of returns)
Here:
$15,023
State:
$17,474
Here:
21.4% of AGI
State:
21.0% of AGI
(% of AGI for various income ranges: 9.6% for AGIs $10k-25k, 6.0% for AGIs $25k-50k, 9.8% for AGIs $50k-75k, 13.1% for AGIs $75k-100k, 12.5% for AGIs over 100k)
Charity contributions deductions: $3,373 (4% of AGI, reported on 19.7% of returns)
Here:
$3,373
State:
$3,494
Here:
4.4% of AGI
State:
4.0% of AGI
(% of AGI for various income ranges: 0.6% for AGIs $10k-25k, 0.9% for AGIs $25k-50k, 1.8% for AGIs $50k-75k, 3.3% for AGIs $75k-100k, 2.5% for AGIs over 100k)
Total tax: $4,904 (reported on 72.4% of returns)
40050:
$4,904
State:
$6,162
(% of AGI for various income ranges: 2.5% for AGIs below $10k, 3.1% for AGIs $10k-25k, 7.1% for AGIs $25k-50k, 8.8% for AGIs $50k-75k, 10.7% for AGIs $75k-100k, 17.2% for AGIs over 100k)
Earned income credit: $1,691 (reported on 22.9% of returns)
Here:
$1,691
State:
$1,723
Percentage of individuals using paid preparers for their 2004 taxes: 78.4%
Here:
78%
State:
66%
(% for various income ranges: 70.3% for AGIs below $10k, 84.3% for AGIs $10k-25k, 77.0% for AGIs $25k-50k, 80.2% for AGIs $50k-75k, 68.8% for AGIs $75k-100k, 94.6% for AGIs over 100k)
Household received Food Stamps/SNAP in the past 12 months: 129 Household did not receive Food Stamps/SNAP in the past 12 months: 650
Women who had a birth in the past 12 months: 3 (3 now married, 0 unmarried) Women who did not have a birth in the past 12 months: 360 (222 now married, 139 unmarried)
Housing units in zip code 40050 with a mortgage: 326 (13 second mortgage, 8 both second mortgage and home equity loan) Median monthly owner costs for units with a mortgage: $1,059 Median monthly owner costs for units without a mortgage: $339
Residents with income below the poverty level in 2022:
This zip code:
16.5%
Whole state:
16.5%
Residents with income below 50% of the poverty level in 2022:
This zip code:
7.7%
Whole state:
9.0%
Median number of rooms in houses and condos:
Here:
6.7
State:
6.4
Median number of rooms in apartments:
Here:
3.3
State:
4.4
Notable locations in this zip code not listed on our city pages
In group quarters: 84 (-1 institutionalized population)
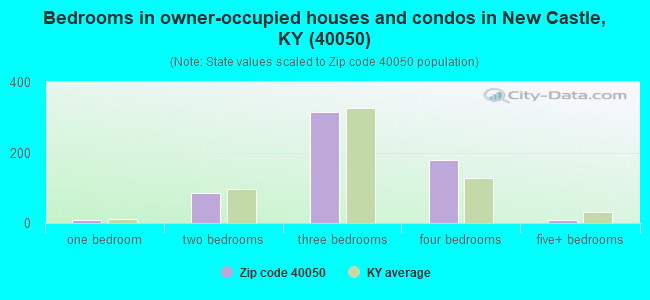
Size of family households: 131 2-persons, 171 3-persons, 100 4-persons, 25 5-persons, 3 6-persons, 5 7-or-more-persons
Size of nonfamily households: 327 1-person, 18 2-persons
210 married couples with children.
178 single-parent households (178 women).
96.3% of residents of 40050 zip code speak English at home.
1.1% of residents speak Spanish at home (32% very well, 5% well, 26% not well, 37% not at all).
0.4% of residents speak other Indo-European language at home (86% very well, 14% well).
2.4% of residents speak Asian or Pacific Island language at home (100% very well).
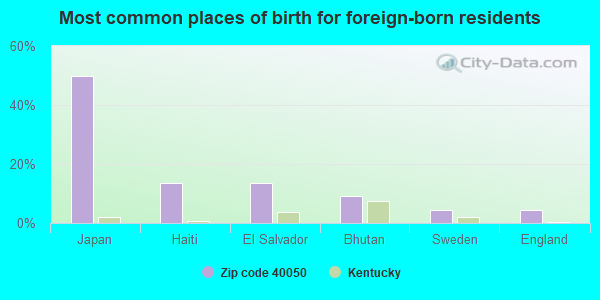
Foreign born population: 21 (1.1%) (33.7% of them are naturalized citizens)
This zip code:
1.1%
Whole state:
4.0%
50%Japan
14%Haiti
14%El Salvador
9%Bhutan
5%Sweden
5%England
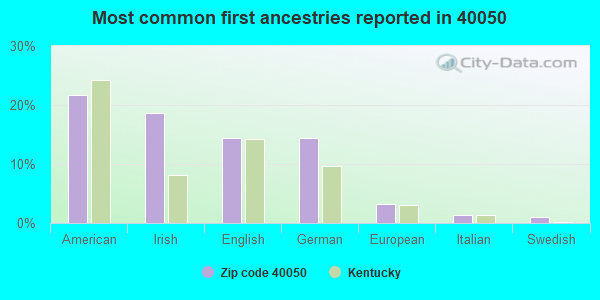
22%American
19%Irish
14%English
14%German
3%European
1%Italian
1%Swedish
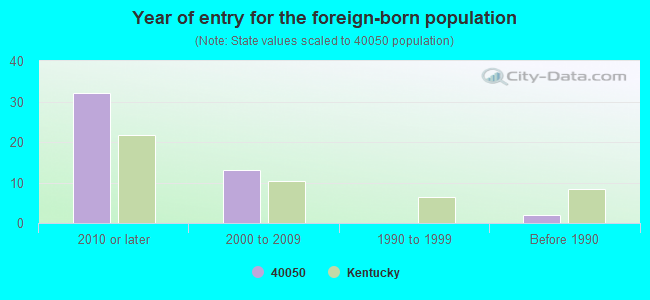
Year of entry for the foreign-born population
322010 or later
132000 to 2009
01990 to 1999
2Before 1990
Facilities with environmental interests located in this zip code:
NEW CASTLE ELEMENTARY SCHOOL (182 S PROPERTY RD in NEW CASTLE, KY)
(National Center for Education Statistics) - STATE ID-052255040 Organizations: HENRY COUNTY (SCHOOL DISTRICT)
NEW CASTLE STP (899 RESERVOIR RD in NEW CASTLE, KY)
National Pollutant Discharge Elimination System NON-MAJOR (Tracking pollutant discharge elimination systems) - permit Business SIC classification: SEWERAGE SYSTEMS
KTC HENRY CO MAINT GARAGE (KY 193 in NEW CASTLE, KY)
National Pollutant Discharge Elimination System NON-MAJOR (Tracking pollutant discharge elimination systems) - permit Business SIC classification: TERMINAL AND SERVICE FACILITIES FOR MOTOR VEHICLE PASSENGER TRANSPORTATION
Housing units lacking complete plumbing facilities: 0.6% Housing units lacking complete kitchen facilities: 4.1%
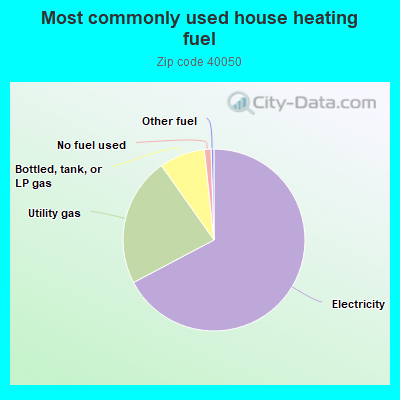
67.4%Electricity
23.0%Utility gas
8.1%Bottled, tank, or LP gas
1.2%No fuel used
0.5%Other fuel
Population in 1990: 2,017.
Place of birth for U.S.-born residents:
This state: 1,459
Northeast: 16
Midwest: 190
South: 130
West: 27
64% of the 40050 zip code residents lived in the same house 5 years ago. Out of people who lived in different houses, 50% lived in this county. Out of people who lived in different counties, 50% lived in Kentucky.
91% of the 40050 zip code residents lived in the same house 1 year ago. Out of people who lived in different houses, 45% moved from this county. Out of people who lived in different houses, 46% moved from different county within same state. Out of people who lived in different houses, 3% moved from different state. Out of people who lived in different houses, 4% moved from abroad.
Private vs. public school enrollment:
Students in private schools in grades 1 to 8 (elementary and middle school): 13
Here:
7.5%
Kentucky:
17.2%
Students in private schools in grades 9 to 12 (high school): 7
Here:
4.3%
Kentucky:
15.2%
Students in private undergraduate colleges:
Here:
0.0%
Kentucky:
19.6%
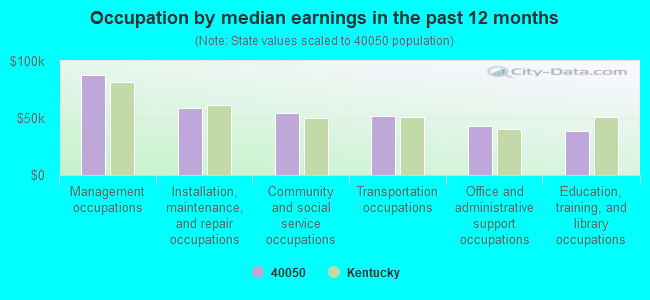
Occupation by median earnings in the past 12 months ($)
87,635Management occupations
58,747Installation, maintenance, and repair occupations
54,441Community and social service occupations
51,831Transportation occupations
42,862Office and administrative support occupations
38,833Education, training, and library occupations
Top industries in this zip code by the number of employees in 2005:
Health Care and Social Assistance: Nursing Care Facilities (50-99 employees: 1 establishment)
Other Services (except Public Administration): Religious Organizations (10-19: 1, 5-9: 1, 1-4: 2)
Professional, Scientific, and Technical Services: Offices of Lawyers (5-9: 2, 1-4: 5)
Professional, Scientific, and Technical Services: Veterinary Services (10-19: 1)
Other Services (except Public Administration): Funeral Homes and Funeral Services (10-19: 1)
Health Care and Social Assistance: Child Day Care Services (5-9: 1, 1-4: 1)
Construction: Masonry Contractors (5-9: 1)
Information: Newspaper Publishers (5-9: 1)
People in group quarters in 2010:
77 people in nursing facilities/skilled-nursing facilities
People in group quarters in 2000:
58 people in nursing homes
Fatal accident statistics in 2014:
Fatal accident count: 1
Vehicles involved in fatal accidents: 1
Fatal accidents caused by drunken drivers: 0
Fatalities: 1
Persons involved in fatal accidents: 1
Pedestrians involved in fatal accidents: 0
2002 - 2018 National Fire Incident Reporting System (NFIRS) incidents
According to the data from the years 2002 - 2018 the average number of fire incidents per year is 10. The highest number of reported fires - 34 took place in 2011, and the least - 0 in 2006. The data has a rising trend.
When looking into fire subcategories, the most reports belonged to: Structure Fires (33.3%), and Outside Fires (26.2%).
Fire incident types reported to NFIRS in Zip Code 40050

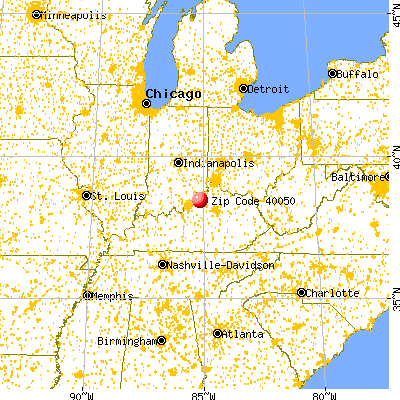


 Nearest zip codes: 40058, 40070, 40019, 40011, 40068, 40075.
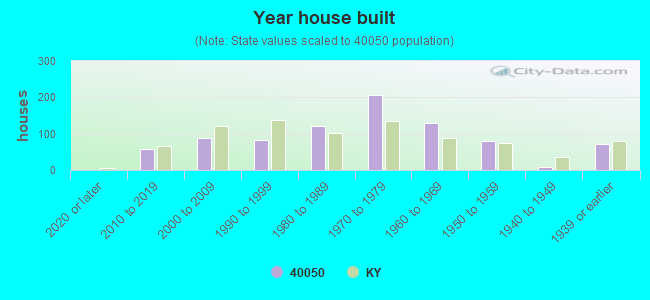


 According to the data from the years 2002 - 2018 the average number of fire incidents per year is 10. The highest number of reported fires - 34 took place in 2011, and the least - 0 in 2006. The data has a rising trend.
 When looking into fire subcategories, the most reports belonged to: Structure Fires (33.3%), and Outside Fires (26.2%).