Estimated zip code population in 2022: 6,929 Zip code population in 2010: 6,199 Zip code population in 2000: 5,420
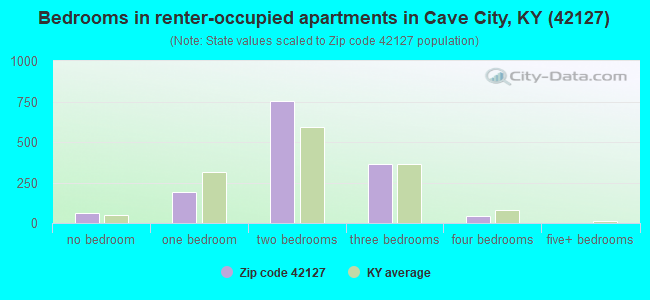
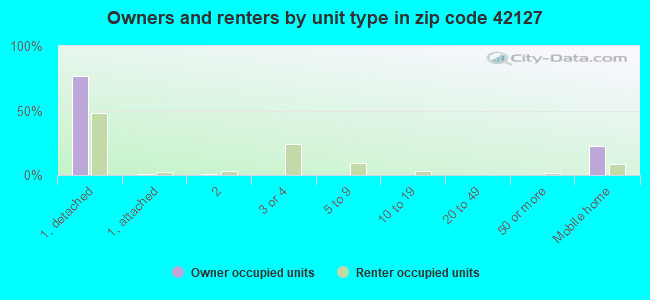
Houses and condos: 3,218 Renter-occupied apartments: 1,422
% of renters here:
47%
State:
31%
March 2022 cost of living index in zip code 42127: 82.6 (low, U.S. average is 100)
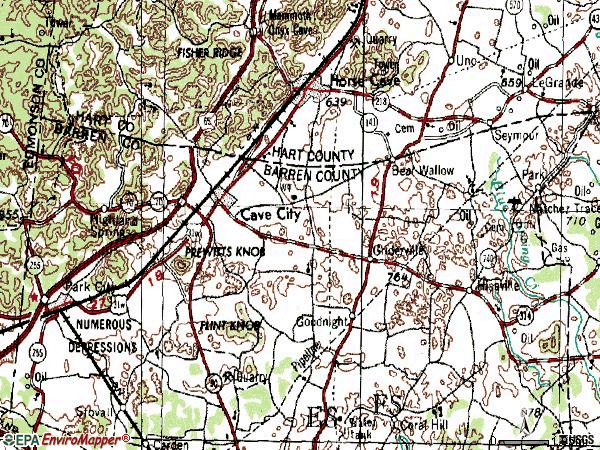
Land area: 88.5 sq. mi. Water area: 0.8 sq. mi.
Population density: 78 people per square mile
(very low).
OSM Map
General Map
Google Map
MSN Map
OSM Map
General Map
Google Map
MSN Map
OSM Map
General Map
Google Map
MSN Map
OSM Map
General Map
Google Map
MSN Map
Please wait while loading the map...
Real estate property taxes paid for housing units in 2022:
This zip code:
0.6% ($1,030)
Kentucky:
0.7% ($1,456)
Median real estate property taxes paid for housing units with mortgages in 2022: $1,170 (0.6%) Median real estate property taxes paid for housing units with no mortgage in 2022: $738 (0.6%)
Business Search- 14 Million verified businesses
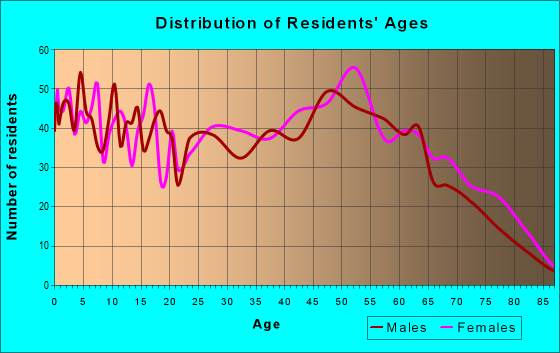
Males: 3,465
(50.0%)
Females: 3,463
(50.0%)
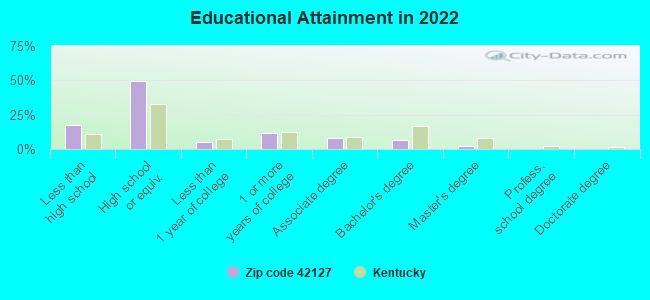
For population 25 years and over in 42127:
High school or higher: 81.2%
Bachelor's degree or higher: 8.5%
Graduate or professional degree: 2.3%
Unemployed: 7.0%
Mean travel time to work (commute): 26.6 minutes
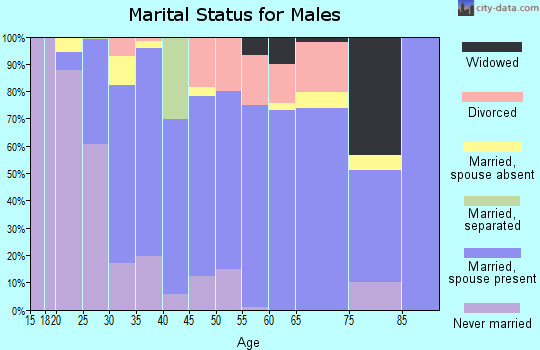
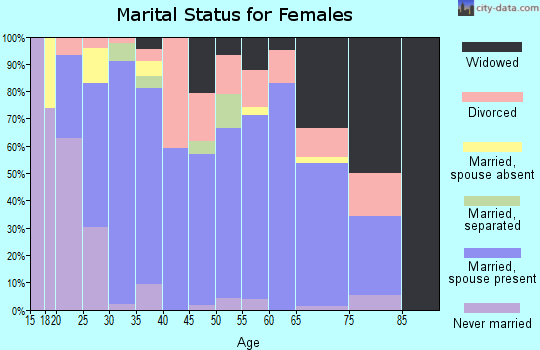
For population 15 years and over in 42127:
Never married: 20.5%
Now married: 49.7%
Separated: 3.2%
Widowed: 11.2%
Divorced: 15.4%
Zip code 42127 compared to state average:
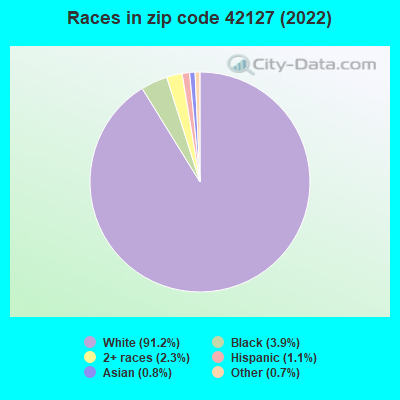
Black race population percentage below state average.
Hispanic race population percentage significantly below state average.
Median age above state average.
Foreign-born population percentage significantly below state average.
Renting percentage above state average.
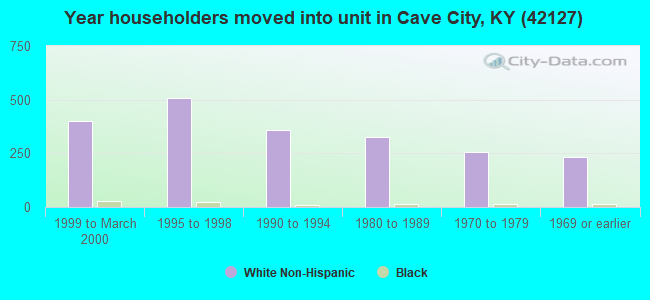
Length of stay since moving in above state average.
Number of college students below state average.
Percentage of population with a bachelor's degree or higher significantly below state average.
Averages for the 2020 tax year for zip code 42127, filed in 2021:
Average Adjusted Gross Income (AGI) in 2020: $42,029 (Individual Income Tax Returns)
Here:
$42,029
State:
$61,342
Salary/wage: $36,294 (reported on 81.6% of returns)
Here:
$36,294
State:
$50,827
(% of AGI for various income ranges: 1150.8% for AGIs below $25k, 3519.8% for AGIs $25k-50k, 6456.4% for AGIs $50k-75k, 8670.0% for AGIs $75k-100k, 14353.0% for AGIs $100k-200k)
Taxable interest for individuals: $1,078 (reported on 20.2% of returns)
This zip code:
$1,078
Kentucky:
$1,441
(% of AGI for various income ranges: 14.4% for AGIs below $25k, 15.7% for AGIs $25k-50k, 32.5% for AGIs $50k-75k, 59.3% for AGIs $75k-100k, 94.0% for AGIs $100k-200k)
Ordinary dividends: $9,095 (reported on 7.7% of returns)
Here:
$9,095
State:
$7,388
(% of AGI for various income ranges: 17.4% for AGIs below $25k, 12.0% for AGIs $25k-50k, 55.7% for AGIs $50k-75k, 138.0% for AGIs $75k-100k, 1323.0% for AGIs $100k-200k)
Net capital gain/loss in AGI: +$12,762 (reported on 8.8% of returns)
Here:
+$12,762
State:
+$19,475
(% of AGI for various income ranges: 14.6% for AGIs below $25k, 8.0% for AGIs $25k-50k, 37.1% for AGIs $50k-75k, 202.7% for AGIs $75k-100k, 2479.0% for AGIs $100k-200k)
Profit/loss from business: +$9,107 (reported on 15.4% of returns)
Here:
+$9,107
State:
+$11,386
(% of AGI for various income ranges: 111.4% for AGIs below $25k, 148.7% for AGIs $25k-50k, 46.4% for AGIs $50k-75k, 234.0% for AGIs $75k-100k, 1468.0% for AGIs $100k-200k)
Taxable individual retirement arrangement distribution: $15,263 (reported on 7.0% of returns)
42127:
$15,263
Kentucky:
$18,941
(% of AGI for various income ranges: 55.3% for AGIs below $25k, 71.8% for AGIs $25k-50k, 150.7% for AGIs $50k-75k, 370.0% for AGIs $75k-100k, 1004.0% for AGIs $100k-200k)
Total itemized deductions: $27,833 (reported on 2.2% of returns)
Here:
$27,833
State:
$32,473
(% of AGI for various income ranges: 86.7% for AGIs below $25k, 916.0% for AGIs $100k-200k)
Charity contributions: $9,225 (reported on 1.5% of returns)
Here:
$9,225
State:
$13,472
(% of AGI for various income ranges: 369.0% for AGIs $100k-200k)
Taxes paid: $5,867 (reported on 2.2% of returns)
42127:
$5,867
State:
$7,830
(% of AGI for various income ranges: 10.7% for AGIs below $25k, 259.0% for AGIs $100k-200k)
Earned income credit: $2,421 (reported on 24.3% of returns)
Here:
$2,421
State:
$2,336
(% of AGI for various income ranges: 122.8% for AGIs below $25k, 86.9% for AGIs $25k-50k)
Percentage of individuals using paid preparers for their 2020 taxes: 94.9%
Here:
95%
State:
94%
(% for various income ranges: 94.9% for AGIs below $25k, 94.7% for AGIs $25k-50k, 94.7% for AGIs $50k-75k, 95.2% for AGIs $75k-100k, 94.1% for AGIs $100k-200k, 100.0% for AGIs over 200k)
Averages for the 2012 tax year for zip code 42127, filed in 2013:
Average Adjusted Gross Income (AGI) in 2012: $36,147 (Individual Income Tax Returns)
Here:
$36,147
State:
$50,814
Salary/wage: $30,769 (reported on 83.4% of returns)
Here:
$30,769
State:
$42,723
(% of AGI for various income ranges: 76.1% for AGIs below $25k, 82.1% for AGIs $25k-50k, 77.4% for AGIs $50k-75k, 74.9% for AGIs $75k-100k, 67.1% for AGIs $100k-200k, 24.9% for AGIs over 200k)
Taxable interest for individuals: $1,659 (reported on 23.6% of returns)
This zip code:
$1,659
Kentucky:
$1,381
(% of AGI for various income ranges: 1.3% for AGIs below $25k, 0.6% for AGIs $25k-50k, 1.1% for AGIs $50k-75k, 1.6% for AGIs $75k-100k, 0.4% for AGIs $100k-200k, 1.8% for AGIs over 200k)
Ordinary dividends: $4,138 (reported on 10.0% of returns)
Here:
$4,138
State:
$6,239
(% of AGI for various income ranges: 0.9% for AGIs below $25k, 0.9% for AGIs $25k-50k, 0.7% for AGIs $50k-75k, 1.3% for AGIs $75k-100k, 3.7% for AGIs $100k-200k)
Net capital gain/loss in AGI: +$5,223 (reported on 12.0% of returns)
Here:
+$5,223
State:
+$11,336
(% of AGI for various income ranges: 1.2% for AGIs below $25k, 0.7% for AGIs $25k-50k, 0.9% for AGIs $50k-75k, 1.9% for AGIs $75k-100k, 7.5% for AGIs $100k-200k)
Profit/loss from business: +$6,751 (reported on 17.4% of returns)
Here:
+$6,751
State:
+$10,862
(% of AGI for various income ranges: 8.1% for AGIs below $25k, 1.7% for AGIs $25k-50k, 1.4% for AGIs $50k-75k, 2.7% for AGIs $75k-100k, 6.4% for AGIs $100k-200k)
Taxable individual retirement arrangement distribution: $13,794 (reported on 6.9% of returns)
42127:
$13,794
Kentucky:
$14,296
(% of AGI for various income ranges: 2.3% for AGIs below $25k, 1.7% for AGIs $25k-50k, 3.7% for AGIs $50k-75k, 8.2% for AGIs $100k-200k)
Total itemized deductions: $19,675 (23% of AGI, reported on 15.4% of returns)
Here:
$19,675
State:
$21,160
Here:
22.7% of AGI
State:
20.0% of AGI
(% of AGI for various income ranges: 5.3% for AGIs below $25k, 5.6% for AGIs $25k-50k, 8.5% for AGIs $50k-75k, 8.5% for AGIs $75k-100k, 13.9% for AGIs $100k-200k, 13.4% for AGIs over 200k)
Charity contributions: $4,668 (reported on 12.0% of returns)
Here:
$4,668
State:
$4,303
(% of AGI for various income ranges: 0.5% for AGIs below $25k, 0.8% for AGIs $25k-50k, 1.1% for AGIs $50k-75k, 1.7% for AGIs $75k-100k, 3.3% for AGIs $100k-200k, 3.5% for AGIs over 200k)
Taxes paid: $6,438 (reported on 15.4% of returns)
42127:
$6,438
State:
$8,496
(% of AGI for various income ranges: 0.5% for AGIs below $25k, 1.2% for AGIs $25k-50k, 2.3% for AGIs $50k-75k, 3.0% for AGIs $75k-100k, 5.7% for AGIs $100k-200k, 7.0% for AGIs over 200k)
Earned income credit: $2,284 (reported on 29.0% of returns)
Here:
$2,284
State:
$2,273
(% of AGI for various income ranges: 8.7% for AGIs below $25k, 1.3% for AGIs $25k-50k)
Percentage of individuals using paid preparers for their 2012 taxes: 76.1%
Here:
76%
State:
60%
(% for various income ranges: 72.7% for AGIs below $25k, 77.9% for AGIs $25k-50k, 84.8% for AGIs $50k-75k, 78.6% for AGIs $75k-100k, 77.8% for AGIs $100k-200k, 66.7% for AGIs over 200k)
Averages for the 2004 tax year for zip code 42127, filed in 2005:
Average Adjusted Gross Income (AGI) in 2004: $31,324 (Individual Income Tax Returns)
Here:
$31,324
State:
$41,540
Salary/wage: $29,395 (reported on 84.1% of returns)
Here:
$29,395
State:
$36,432
(% of AGI for various income ranges: 96.0% for AGIs below $10k, 79.5% for AGIs $10k-25k, 84.2% for AGIs $25k-50k, 83.4% for AGIs $50k-75k, 86.5% for AGIs $75k-100k, 52.6% for AGIs over 100k)
Taxable interest for individuals: $1,748 (reported on 34.8% of returns)
This zip code:
$1,748
Kentucky:
$1,571
(% of AGI for various income ranges: 8.8% for AGIs below $10k, 2.8% for AGIs $10k-25k, 1.5% for AGIs $25k-50k, 2.1% for AGIs $50k-75k, 0.8% for AGIs $75k-100k, 1.2% for AGIs over 100k)
Taxable dividends: $1,357 (reported on 14.5% of returns)
Here:
$1,357
State:
$3,453
(% of AGI for various income ranges: 1.7% for AGIs below $10k, 0.5% for AGIs $10k-25k, 0.4% for AGIs $25k-50k, 0.9% for AGIs $50k-75k, 0.3% for AGIs $75k-100k, 0.7% for AGIs over 100k)
Net capital gain/loss: +$4,952 (reported on 13.2% of returns)
Here:
+$4,952
State:
+$9,663
(% of AGI for various income ranges: 1.4% for AGIs below $10k, 1.6% for AGIs $10k-25k, 2.6% for AGIs $25k-50k, 2.2% for AGIs $50k-75k, 2.5% for AGIs $75k-100k, 1.4% for AGIs over 100k)
Profit/loss from business: +$5,049 (reported on 18.2% of returns)
Here:
+$5,049
State:
+$9,233
(% of AGI for various income ranges: 9.1% for AGIs below $10k, 6.2% for AGIs $10k-25k, 1.9% for AGIs $25k-50k, 0.9% for AGIs $50k-75k, -0.6% for AGIs $75k-100k, 6.2% for AGIs over 100k)
IRA payment deduction: $3,597 (reported on 2.6% of returns)
42127:
$3,597
Kentucky:
$2,955
(% of AGI for various income ranges: 0.3% for AGIs $10k-25k, 0.5% for AGIs $25k-50k, 0.2% for AGIs $50k-75k, 0.6% for AGIs $75k-100k)
Total itemized deductions: $14,867 (23% of AGI, reported on 20.6% of returns)
Here:
$14,867
State:
$17,474
Here:
23.2% of AGI
State:
21.0% of AGI
(% of AGI for various income ranges: 20.5% for AGIs below $10k, 6.1% for AGIs $10k-25k, 7.7% for AGIs $25k-50k, 10.2% for AGIs $50k-75k, 12.7% for AGIs $75k-100k, 12.1% for AGIs over 100k)
Charity contributions deductions: $3,179 (5% of AGI, reported on 17.4% of returns)
Here:
$3,179
State:
$3,494
Here:
4.7% of AGI
State:
4.0% of AGI
(% of AGI for various income ranges: 0.9% for AGIs below $10k, 0.9% for AGIs $10k-25k, 0.8% for AGIs $25k-50k, 1.7% for AGIs $50k-75k, 2.1% for AGIs $75k-100k, 4.3% for AGIs over 100k)
Total tax: $4,094 (reported on 68.3% of returns)
42127:
$4,094
State:
$6,162
(% of AGI for various income ranges: 4.4% for AGIs below $10k, 3.4% for AGIs $10k-25k, 5.9% for AGIs $25k-50k, 8.2% for AGIs $50k-75k, 10.3% for AGIs $75k-100k, 20.6% for AGIs over 100k)
Earned income credit: $1,726 (reported on 24.7% of returns)
Here:
$1,726
State:
$1,723
Percentage of individuals using paid preparers for their 2004 taxes: 81.8%
Here:
82%
State:
66%
(% for various income ranges: 78.7% for AGIs below $10k, 83.5% for AGIs $10k-25k, 83.3% for AGIs $25k-50k, 82.9% for AGIs $50k-75k, 76.6% for AGIs $75k-100k, 83.6% for AGIs over 100k)
Household received Food Stamps/SNAP in the past 12 months: 558 Household did not receive Food Stamps/SNAP in the past 12 months: 2,457
Women who had a birth in the past 12 months: 70 (17 now married, 55 unmarried) Women who did not have a birth in the past 12 months: 1,499 (892 now married, 611 unmarried)
Housing units in zip code 42127 with a mortgage: 934 (60 second mortgage, 54 both second mortgage and home equity loan) Houses without a mortgage: 32
Median monthly owner costs for units with a mortgage: $1,235 Median monthly owner costs for units without a mortgage: $379
Residents with income below the poverty level in 2022:
This zip code:
28.9%
Whole state:
16.5%
Residents with income below 50% of the poverty level in 2022:
This zip code:
18.1%
Whole state:
9.0%
Median number of rooms in houses and condos:
Here:
6.1
State:
6.4
Median number of rooms in apartments:
Here:
4.2
State:
4.4
Notable locations in this zip code not listed on our city pages
Churches in zip code 42127 include: Harlow Chapel (A), Little Bethel Church (B), Little Hope Church (C), New Hope Church (D), Queens Chapel (E), Rock Springs Church (F), Basil Chapel (G), Salem Church (H), Servant Valley Church (I). Display/hide their locations on the map
In group quarters: 22 (-1 institutionalized population)
Size of family households: 909 2-persons, 510 3-persons, 244 4-persons, 179 5-persons, 22 6-persons, 17 7-or-more-persons
Size of nonfamily households: 934 1-person, 185 2-persons, 23 6-persons
687 married couples with children.
385 single-parent households (107 men, 278 women).
99.3% of residents of 42127 zip code speak English at home.
0.5% of residents speak Spanish at home (100% very well).
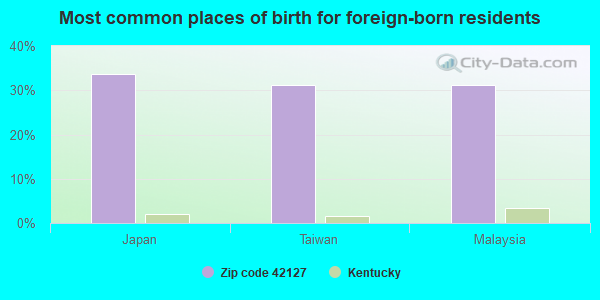
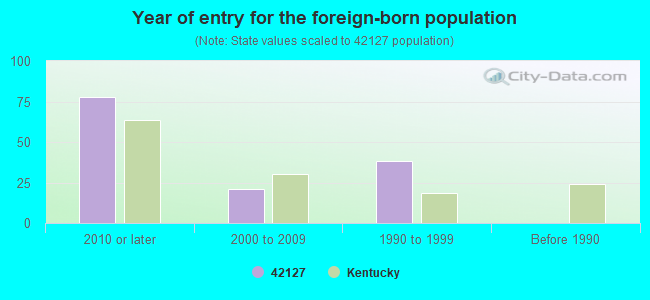
Foreign born population: 74 (1.1%) (36.2% of them are naturalized citizens)
This zip code:
1.1%
Whole state:
4.0%
34%Japan
31%Taiwan
31%Malaysia
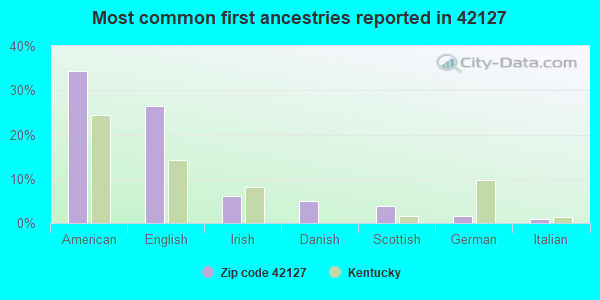
34%American
26%English
6%Irish
5%Danish
4%Scottish
2%German
1%Italian
Year of entry for the foreign-born population
782010 or later
212000 to 2009
381990 to 1999
0Before 1990
Facilities with environmental interests located in this zip code:
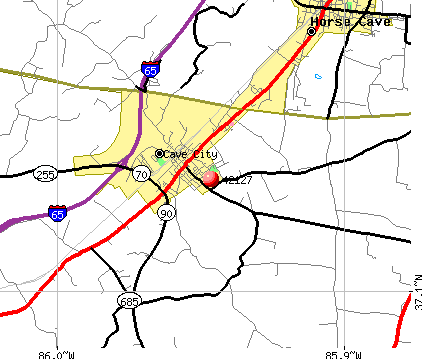
MOONSHINE BOAT TRAILERS (15 WALL STREET AND MOONSHINE BOULEVARD in CAVE CITY, KY)
CRITERIA AND HAZARDOUS AIR POLLUTANT INVENTORY (Inventory of air pollution sources) (Resource Conservation and Recovery Act (tracking hazardous waste)) Business SIC classification: AUTOMOTIVE STAMPINGS Business NAICS classification: ALL OTHER TRANSPORTATION EQUIPMENT MANUFACTURING. Organizations: LINWOOD J. SWEITZER (CONTACT/OWNER)
, SCOTT SWEITZER (CONTACT/OWNER)
CAVERNA ELEMENTARY SCHOOL (1106 N DIXIE HWY in CAVE CITY, KY)
(National Center for Education Statistics) - STATE ID-005113025 Organizations: CAVERNA INDEPENDENT (SCHOOL DISTRICT)
BARREN COUNTY PLT (1140 FLINT KNOB RD in CAVE CITY, KY)
(Integrated Compliance Information System) - ICIS-04-2000-0221, FORMAL ENFORCEMENT ACTION Business SIC classification: ASPHALT PAVING MIXTURES AND BLOCKS
CAVE CITY (P O BOX 191 in CAVE CITY, KY)
(Integrated Compliance Information System) - ICIS-04-1988-0010, FORMAL ENFORCEMENT ACTION Business SIC classification: REFUSE SYSTEMS
CHEVRON USA PRODUCTS #49073 (I-64 & HWY 70 in CAVE CITY, KY)
(Resource Conservation and Recovery Act (tracking hazardous waste))
MINIT MART #45 (US 31W & HWY 70 in CAVE CITY, KY)
(Resource Conservation and Recovery Act (tracking hazardous waste)) Organizations: MINIT MART FOODS INC. (CONTACT/OWNER)
MONROE BROS FEED MIL (SOUTH 1ST STREET in CAVE CITY, KY)
AIR MINOR (AIRS/AFS) Business SIC classification: PREPARED FEEDS AND FEED INGREDIENTS FOR ANIMALS AND FOWLS, EXCEPT DOGS AND CATS
OAKS, THE (5091 MAMMOTH CAVE RD in CAVE CITY, KY)
(Resource Conservation and Recovery Act (tracking hazardous waste)) Organizations: JAMES CAMPBELL (CONTACT/OWNER)
CAVERNA ELEMENTARY SCHOOL (RT. 3 BOX 93 in CAVE CITY, KY)
COMPLIANCE ACTIVITY (Tracking inspections of insecticide, fungicide, and rodenticide, and toxic substances)
CAVERNA INDEP. SCHOOL DIST. (HWY 31 WEST in CAVE CITY, KY)
COMPLIANCE ACTIVITY (Tracking inspections of insecticide, fungicide, and rodenticide, and toxic substances)
Housing units lacking complete plumbing facilities: 1.6% Housing units lacking complete kitchen facilities: 4.5%
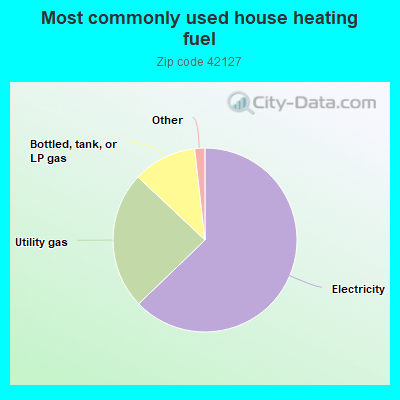
62.8%Electricity
24.2%Utility gas
11.2%Bottled, tank, or LP gas
1.0%Wood
0.9%No fuel used
Population in 1990: 6,283.
Place of birth for U.S.-born residents:
This state: 5,118
Northeast: 49
Midwest: 880
South: 653
West: 64
57% of the 42127 zip code residents lived in the same house 5 years ago. Out of people who lived in different houses, 63% lived in this county. Out of people who lived in different counties, 50% lived in Kentucky.
88% of the 42127 zip code residents lived in the same house 1 year ago. Out of people who lived in different houses, 34% moved from this county. Out of people who lived in different houses, 50% moved from different county within same state. Out of people who lived in different houses, 16% moved from different state.
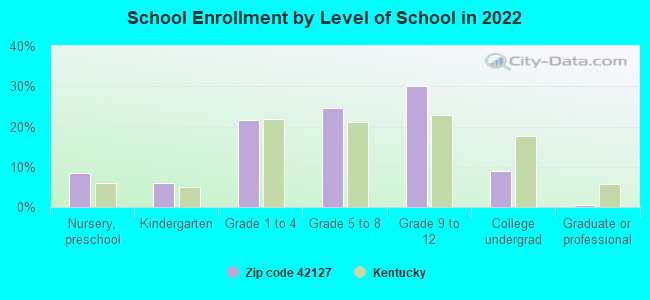
Private vs. public school enrollment:
Students in private schools in grades 1 to 8 (elementary and middle school): 94
Here:
16.1%
Kentucky:
17.2%
Students in private schools in grades 9 to 12 (high school): 115
Here:
30.1%
Kentucky:
15.2%
Students in private undergraduate colleges:
Here:
0.0%
Kentucky:
19.6%
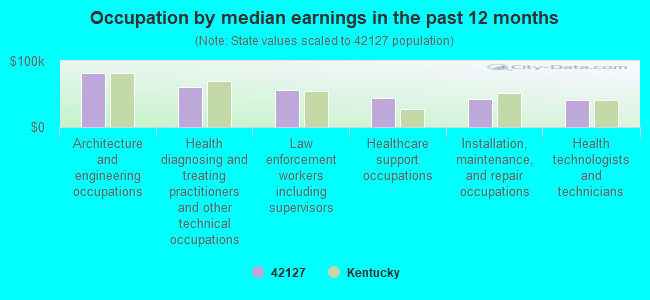
Occupation by median earnings in the past 12 months ($)
81,908Architecture and engineering occupations
59,905Health diagnosing and treating practitioners and other technical occupations
55,721Law enforcement workers including supervisors
43,937Healthcare support occupations
42,120Installation, maintenance, and repair occupations
40,610Health technologists and technicians
Companies with federal contracts located in this zip code:
10-33 EQUIPMENT, INC (540 PETERSON ROAD in CAVE CITY, KY; small business) : $207,857 in 5 contractsfrom 2001 to 2004
Contracts for Miscellaneous Fire Control Equipment, Miscellaneous Chemical Specialties, Safety and Rescue Equipment by Army Signed by year:2000: $0; 2001: $204,675; 2002: $0; 2003: $0; 2004: $3,182; 2005: $0; 2006: $0.
Biggest contracts:
$147,697 with Army for Miscellaneous Fire Control Equipment. Signed on 2001-10-25. Completion date: 2001-11-02.
$40,802 with Army for Miscellaneous Chemical Specialties. Signed on 2001-10-25. Completion date: 2001-12-11.
$16,176 with Army for Safety and Rescue Equipment. Signed on 2001-12-19. Completion date: 2002-01-11.
$2,884, same as above.Signed on 2004-09-20. Completion date: 2004-10-15.
Top industries in this zip code by the number of employees in 2005:
Accommodation and Food Services: Limited-Service Restaurants (20-49: 3, 10-19: 2)
Accommodation and Food Services: Hotels (except Casino Hotels) and Motels (20-49: 1, 10-19: 5, 5-9: 1, 1-4: 3)
Mining: Drilling Oil and Gas Wells (20-49: 1)
Health Care and Social Assistance: Offices of Physicians (except Mental Health Specialists) (10-19: 1, 5-9: 1, 1-4: 1)
Health Care and Social Assistance: Offices of Dentists (10-19: 1, 5-9: 1)
People in group quarters in 2010:
18 people in residential treatment centers for juveniles (non-correctional)
12 people in residential treatment centers for adults
People in group quarters in 2000:
6 people in homes for the mentally ill
Fatal accident statistics in 2014:
Fatal accident count: 1
Vehicles involved in fatal accidents: 3
Fatal accidents caused by drunken drivers: 1
Fatalities: 1
Persons involved in fatal accidents: 3
Pedestrians involved in fatal accidents: 0
Fatal accident statistics in 2012:
Fatal accident count: 3
Vehicles involved in fatal accidents: 6
Fatal accidents caused by drunken drivers: 0
Fatalities: 3
Persons involved in fatal accidents: 11
Pedestrians involved in fatal accidents: 0
2002 - 2018 National Fire Incident Reporting System (NFIRS) incidents
According to the data from the years 2002 - 2018 the average number of fires per year is 26. The highest number of reported fires - 69 took place in 2016, and the least - 4 in 2002. The data has a rising trend.
When looking into fire subcategories, the most reports belonged to: Structure Fires (49.3%), and Outside Fires (29.8%).
Fire incident types reported to NFIRS in Zip Code 42127
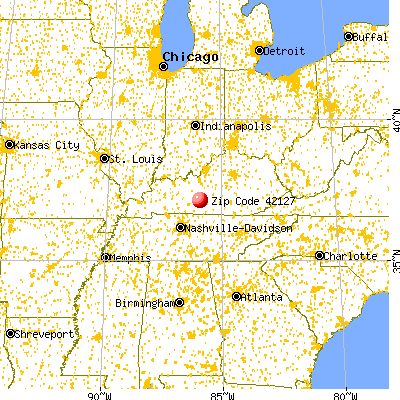


 Nearest zip codes: 42749, 42160, 42141, 42154, 42746, 42163.
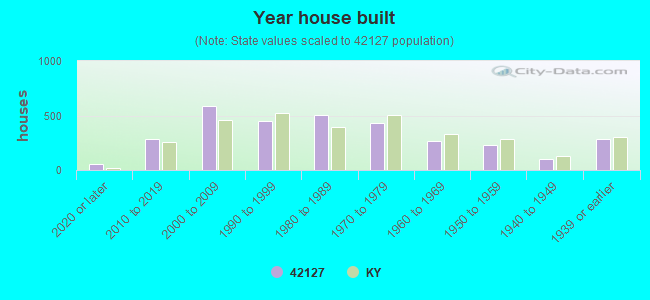


 According to the data from the years 2002 - 2018 the average number of fires per year is 26. The highest number of reported fires - 69 took place in 2016, and the least - 4 in 2002. The data has a rising trend.
 When looking into fire subcategories, the most reports belonged to: Structure Fires (49.3%), and Outside Fires (29.8%).