Estimated zip code population in 2022: 2,312 Zip code population in 2010: 460 Zip code population in 2000: 236
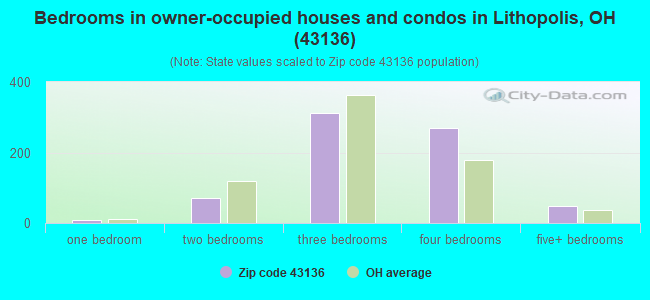
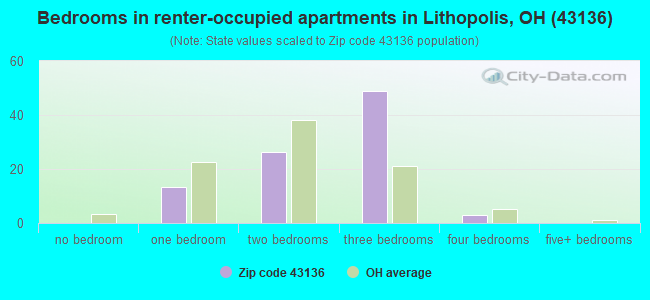
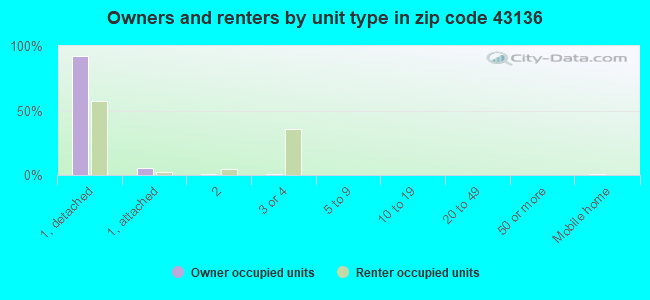
Houses and condos: 789 Renter-occupied apartments: 92
% of renters here:
12%
State:
33%
March 2022 cost of living index in zip code 43136: 95.4 (near average, U.S. average is 100)
Land area: 0.3 sq. mi. Water area: 0.0 sq. mi.
Population density: 8,327 people per square mile
(high).
OSM Map
General Map
Google Map
MSN Map
OSM Map
General Map
Google Map
MSN Map
OSM Map
General Map
Google Map
MSN Map
OSM Map
General Map
Google Map
MSN Map
Please wait while loading the map...
Real estate property taxes paid for housing units in 2022:
This zip code:
1.1% ($3,539)
Ohio:
1.3% ($2,639)
Median real estate property taxes paid for housing units with mortgages in 2022: $3,628 (1.1%) Median real estate property taxes paid for housing units with no mortgage in 2022: $3,389 (1.4%)
Business Search- 14 Million verified businesses
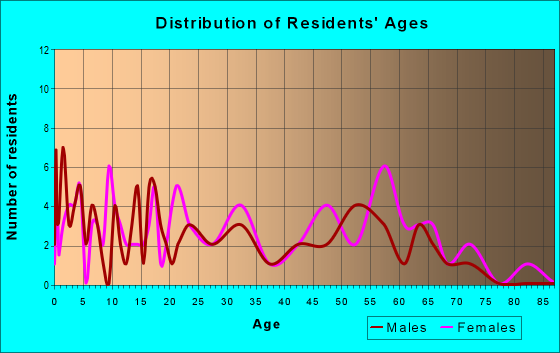
Males: 1,083
(46.8%)
Females: 1,229
(53.2%)
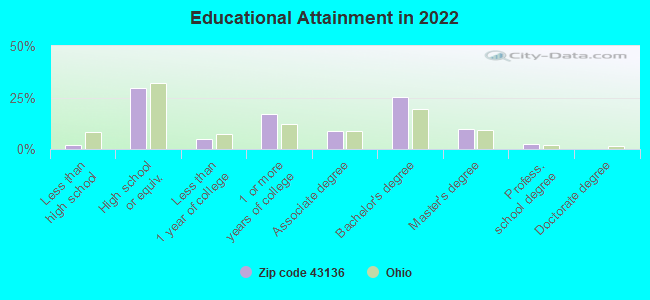
For population 25 years and over in 43136:
High school or higher: 97.8%
Bachelor's degree or higher: 37.2%
Graduate or professional degree: 12.3%
Unemployed: 1.7%
Mean travel time to work (commute): 28.8 minutes
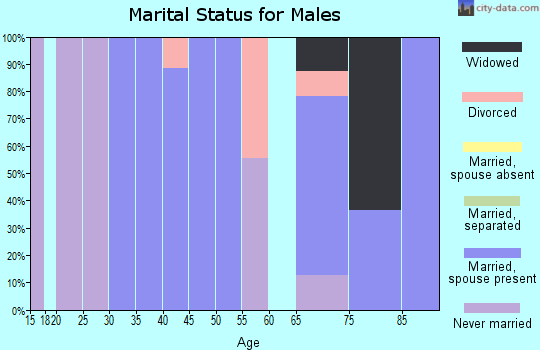
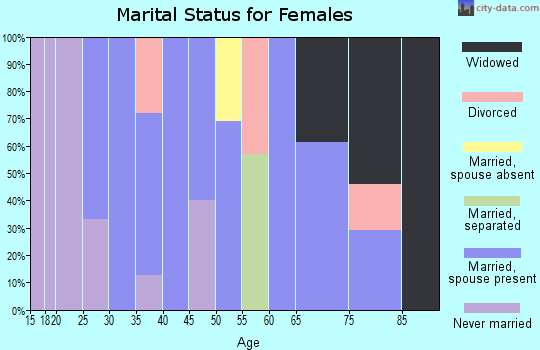
For population 15 years and over in 43136:
Never married: 22.4%
Now married: 65.1%
Separated: 0.4%
Widowed: 5.5%
Divorced: 6.6%
Zip code 43136 compared to state average:
Median household income above state average.
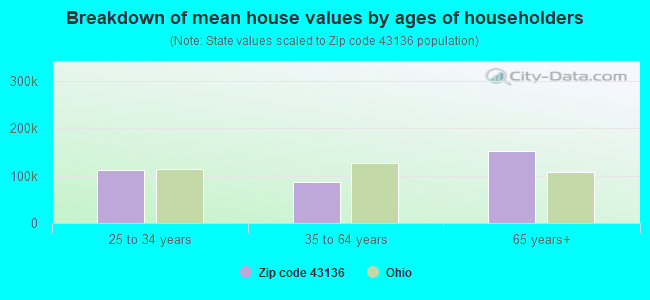
Median house value above state average.
Unemployed percentage below state average.
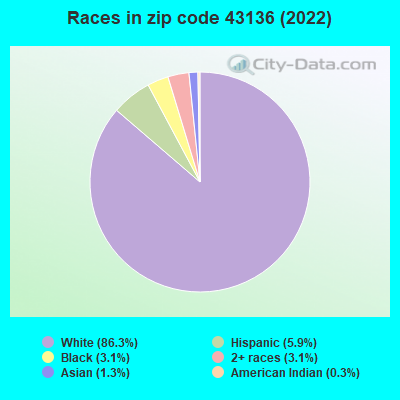
Black race population percentage significantly below state average.
Median age below state average.
Foreign-born population percentage below state average.
Renting percentage significantly below state average.
Length of stay since moving in below state average.
Estimated median house/condo value in 2022: $312,441
43136:
$312,441
Ohio:
$204,100
According to our research of Ohio and other state lists, there was 1 registered sex offender living in 43136 zip code as of April 24, 2024. The ratio of all residents to sex offenders in zip code 43136 is 564 to 1. The ratio of registered sex offenders to all residents in this zip code is near the state average.
Median resident age:
This zip code:
33.2 years
Ohio median age:
39.9 years
Average household size:
This zip code:
2.9 people
Ohio:
2.4 people
Averages for the 2020 tax year for zip code 43136, filed in 2021:
Average Adjusted Gross Income (AGI) in 2020: $67,005 (Individual Income Tax Returns)
Here:
$67,005
State:
$67,288
Salary/wage: $63,047 (reported on 87.1% of returns)
Here:
$63,047
State:
$55,628
(% of AGI for various income ranges: 1080.6% for AGIs below $25k, 3568.7% for AGIs $25k-50k, 6400.8% for AGIs $50k-75k, 10057.3% for AGIs $75k-100k, 17495.7% for AGIs $100k-200k)
Taxable interest for individuals: $395 (reported on 20.4% of returns)
This zip code:
$395
Ohio:
$1,518
(% of AGI for various income ranges: 16.7% for AGIs $25k-50k, 10.8% for AGIs $50k-75k, 10.0% for AGIs $75k-100k, 17.9% for AGIs $100k-200k)
Ordinary dividends: $1,353 (reported on 16.1% of returns)
Here:
$1,353
State:
$7,167
(% of AGI for various income ranges: 24.7% for AGIs below $25k, 63.8% for AGIs $50k-75k, 15.5% for AGIs $75k-100k, 43.6% for AGIs $100k-200k)
Net capital gain/loss in AGI: +$3,285 (reported on 14.0% of returns)
Here:
+$3,285
State:
+$18,919
(% of AGI for various income ranges: 80.8% for AGIs $50k-75k, 95.5% for AGIs $75k-100k, 156.4% for AGIs $100k-200k)
Profit/loss from business: +$6,450 (reported on 15.1% of returns)
Here:
+$6,450
State:
+$13,744
(% of AGI for various income ranges: 150.0% for AGIs below $25k, 3.1% for AGIs $50k-75k, 299.1% for AGIs $75k-100k, 225.0% for AGIs $100k-200k)
Taxable individual retirement arrangement distribution: $16,000 (reported on 6.5% of returns)
43136:
$16,000
Ohio:
$18,876
(% of AGI for various income ranges: 104.1% for AGIs below $25k, 179.2% for AGIs $50k-75k, 392.9% for AGIs $100k-200k)
Total itemized deductions: $24,856 (reported on 9.7% of returns)
Here:
$24,856
State:
$33,869
(% of AGI for various income ranges: 347.7% for AGIs $50k-75k, 388.2% for AGIs $75k-100k, 970.0% for AGIs $100k-200k)
Charity contributions: $11,180 (reported on 5.4% of returns)
Here:
$11,180
State:
$14,577
(% of AGI for various income ranges: 83.8% for AGIs $50k-75k, 321.4% for AGIs $100k-200k)
Taxes paid: $7,356 (reported on 9.7% of returns)
43136:
$7,356
State:
$7,681
(% of AGI for various income ranges: 115.4% for AGIs $50k-75k, 147.3% for AGIs $75k-100k, 250.0% for AGIs $100k-200k)
Earned income credit: $2,227 (reported on 11.8% of returns)
Here:
$2,227
State:
$2,304
(% of AGI for various income ranges: 78.2% for AGIs below $25k, 74.7% for AGIs $25k-50k)
Percentage of individuals using paid preparers for their 2020 taxes: 95.7%
Here:
96%
State:
94%
(% for various income ranges: 95.5% for AGIs below $25k, 94.4% for AGIs $25k-50k, 94.1% for AGIs $50k-75k, 100.0% for AGIs $75k-100k, 95.2% for AGIs $100k-200k)
Averages for the 2012 tax year for zip code 43136, filed in 2013:
Average Adjusted Gross Income (AGI) in 2012: $52,055 (Individual Income Tax Returns)
Here:
$52,055
State:
$54,926
Salary/wage: $47,862 (reported on 82.8% of returns)
Here:
$47,862
State:
$45,869
(% of AGI for various income ranges: 74.9% for AGIs below $25k, 79.8% for AGIs $25k-50k, 72.3% for AGIs $50k-75k, 76.5% for AGIs $75k-100k, 76.8% for AGIs $100k-200k)
Taxable interest for individuals: $606 (reported on 26.6% of returns)
This zip code:
$606
Ohio:
$1,297
(% of AGI for various income ranges: 0.6% for AGIs below $25k, 0.2% for AGIs $25k-50k, 0.4% for AGIs $50k-75k, 0.6% for AGIs $75k-100k)
Ordinary dividends: $1,320 (reported on 15.6% of returns)
Here:
$1,320
State:
$5,821
(% of AGI for various income ranges: 0.9% for AGIs $25k-50k, 1.0% for AGIs $50k-75k)
Net capital gain/loss in AGI: +$733 (reported on 9.4% of returns)
Here:
+$733
State:
+$11,232
(% of AGI for various income ranges: 0.9% for AGIs $75k-100k)
Profit/loss from business: +$7,422 (reported on 14.1% of returns)
Here:
+$7,422
State:
+$12,773
(% of AGI for various income ranges: 7.7% for AGIs below $25k, 2.6% for AGIs $50k-75k, 4.4% for AGIs $75k-100k)
Taxable individual retirement arrangement distribution: $12,217 (reported on 9.4% of returns)
43136:
$12,217
Ohio:
$14,511
(% of AGI for various income ranges: 7.3% for AGIs below $25k, 7.9% for AGIs $50k-75k)
Total itemized deductions: $18,585 (23% of AGI, reported on 42.2% of returns)
Here:
$18,585
State:
$21,278
Here:
23.2% of AGI
State:
18.8% of AGI
(% of AGI for various income ranges: 15.5% for AGIs $25k-50k, 16.4% for AGIs $50k-75k, 15.4% for AGIs $75k-100k, 17.2% for AGIs $100k-200k)
Charity contributions: $2,781 (reported on 32.8% of returns)
Here:
$2,781
State:
$3,943
(% of AGI for various income ranges: 1.2% for AGIs $25k-50k, 1.3% for AGIs $50k-75k, 1.5% for AGIs $75k-100k, 2.8% for AGIs $100k-200k)
Taxes paid: $7,722 (reported on 42.2% of returns)
43136:
$7,722
State:
$9,568
(% of AGI for various income ranges: 5.7% for AGIs $25k-50k, 6.1% for AGIs $50k-75k, 6.6% for AGIs $75k-100k, 7.8% for AGIs $100k-200k)
Earned income credit: $2,250 (reported on 12.5% of returns)
Here:
$2,250
State:
$2,285
(% of AGI for various income ranges: 5.4% for AGIs below $25k, 0.8% for AGIs $25k-50k)
Percentage of individuals using paid preparers for their 2012 taxes: 43.8%
Here:
44%
State:
51%
(% for various income ranges: 35.0% for AGIs below $25k, 50.0% for AGIs $25k-50k, 54.5% for AGIs $50k-75k, 50.0% for AGIs $75k-100k, 33.3% for AGIs $100k-200k)
Averages for the 2004 tax year for zip code 43136, filed in 2005:
Average Adjusted Gross Income (AGI) in 2004: $38,326 (Individual Income Tax Returns)
Here:
$38,326
State:
$44,480
Salary/wage: $36,267 (reported on 86.3% of returns)
Here:
$36,267
State:
$39,198
(% of AGI for various income ranges: 78.1% for AGIs below $10k, 76.1% for AGIs $10k-25k, 81.1% for AGIs $25k-50k, 79.0% for AGIs $50k-75k, 87.8% for AGIs $75k-100k, 82.7% for AGIs over 100k)
Taxable interest for individuals: $710 (reported on 34.2% of returns)
This zip code:
$710
Ohio:
$1,532
(% of AGI for various income ranges: 0.7% for AGIs $10k-25k, 1.1% for AGIs $25k-50k, 0.8% for AGIs $50k-75k, 0.2% for AGIs $75k-100k)
Taxable dividends: $360 (reported on 16.0% of returns)
Here:
$360
State:
$3,496
(% of AGI for various income ranges: 2.0% for AGIs below $10k, 0.2% for AGIs $25k-50k, 0.1% for AGIs $50k-75k, 0.0% for AGIs $75k-100k)
Profit/loss from business: +$3,794 (reported on 10.9% of returns)
Here:
+$3,794
State:
+$10,813
Total itemized deductions: $14,860 (22% of AGI, reported on 31.9% of returns)
Here:
$14,860
State:
$17,503
Here:
22.4% of AGI
State:
20.8% of AGI
(% of AGI for various income ranges: 11.7% for AGIs $25k-50k, 14.2% for AGIs $50k-75k, 13.6% for AGIs $75k-100k, 20.2% for AGIs over 100k)
Charity contributions deductions: $2,012 (3% of AGI, reported on 26.2% of returns)
Here:
$2,012
State:
$3,087
Here:
2.9% of AGI
State:
3.4% of AGI
(% of AGI for various income ranges: 1.0% for AGIs $25k-50k, 1.1% for AGIs $50k-75k, 2.2% for AGIs $75k-100k, 2.8% for AGIs over 100k)
Total tax: $4,461 (reported on 77.6% of returns)
43136:
$4,461
State:
$6,781
(% of AGI for various income ranges: 1.6% for AGIs below $10k, 5.2% for AGIs $10k-25k, 8.1% for AGIs $25k-50k, 9.5% for AGIs $50k-75k, 10.0% for AGIs $75k-100k, 13.1% for AGIs over 100k)
Earned income credit: $1,657 (reported on 11.2% of returns)
Here:
$1,657
State:
$1,696
Percentage of individuals using paid preparers for their 2004 taxes: 47.9%
Here:
48%
State:
55%
(% for various income ranges: 28.8% for AGIs below $10k, 52.2% for AGIs $10k-25k, 58.3% for AGIs $25k-50k, 52.1% for AGIs $50k-75k, 55.2% for AGIs $75k-100k)
Likely homosexual households (counted as self-reported same-sex unmarried-partner households)
Lesbian couples: 0.7% of all households
Gay men: 0.0% of all households
Household received Food Stamps/SNAP in the past 12 months: 12 Household did not receive Food Stamps/SNAP in the past 12 months: 782
Women who had a birth in the past 12 months: 72 (64 now married, 8 unmarried) Women who did not have a birth in the past 12 months: 435 (314 now married, 120 unmarried)
Housing units in zip code 43136 with a mortgage: 549 (66 second mortgage, 1 home equity loan, 43 both second mortgage and home equity loan) Houses without a mortgage: 3
Median monthly owner costs for units with a mortgage: $1,795 Median monthly owner costs for units without a mortgage: $651
Residents with income below the poverty level in 2022:
This zip code:
6.7%
Whole state:
13.4%
Residents with income below 50% of the poverty level in 2022:
This zip code:
0.3%
Whole state:
7.0%
Median number of rooms in houses and condos:
Here:
7.1
State:
6.7
Median number of rooms in apartments:
Here:
5.1
State:
4.4
Notable locations in this zip code not listed on our city pages
Size of family households: 224 2-persons, 66 3-persons, 195 4-persons, 76 5-persons, 26 6-persons, 13 7-or-more-persons
Size of nonfamily households: 146 1-person, 31 2-persons, 8 3-persons
688 married couples with children.
20 single-parent households (20 women).
94.2% of residents of 43136 zip code speak English at home.
4.1% of residents speak Spanish at home (69% very well, 31% well).
0.1% of residents speak other Indo-European language at home (100% very well).
0.9% of residents speak Asian or Pacific Island language at home (47% very well, 53% well).
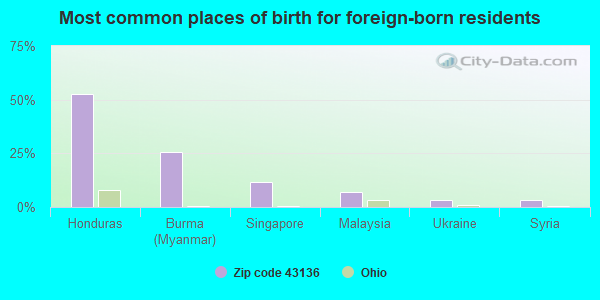
Foreign born population: 59 (2.6%) (91.5% of them are naturalized citizens)
This zip code:
2.6%
Whole state:
5.0%
53%Honduras
25%Burma (Myanmar)
12%Singapore
7%Malaysia
3%Ukraine
3%Syria
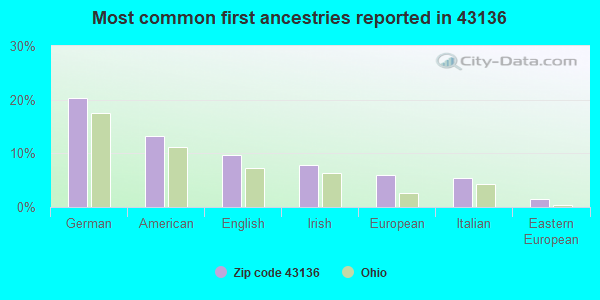
20%German
13%American
10%English
8%Irish
6%European
5%Italian
2%Eastern European
Year of entry for the foreign-born population
52010 or later
382000 to 2009
41990 to 1999
20Before 1990
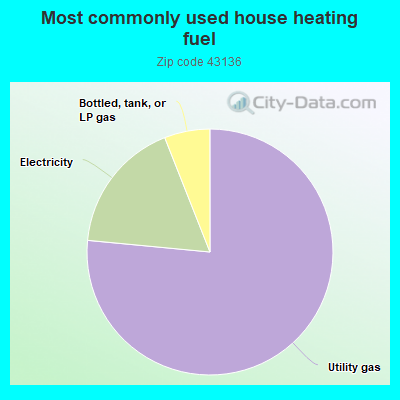
76.6%Utility gas
17.5%Electricity
6.0%Bottled, tank, or LP gas
Place of birth for U.S.-born residents:
This state: 1,830
Northeast: 44
Midwest: 58
South: 177
West: 127
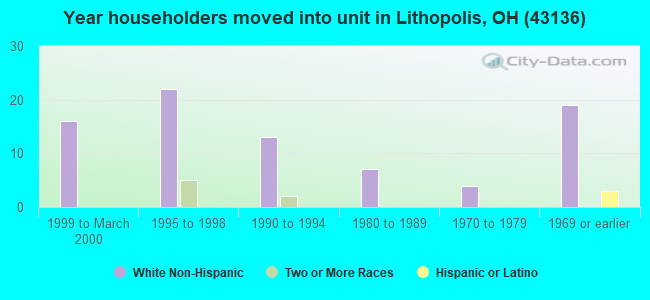
45% of the 43136 zip code residents lived in the same house 5 years ago. Out of people who lived in different houses, 40% lived in this county. Out of people who lived in different counties, 50% lived in Ohio.
94% of the 43136 zip code residents lived in the same house 1 year ago. Out of people who lived in different houses, 78% moved from this county. Out of people who lived in different houses, 22% moved from different county within same state.
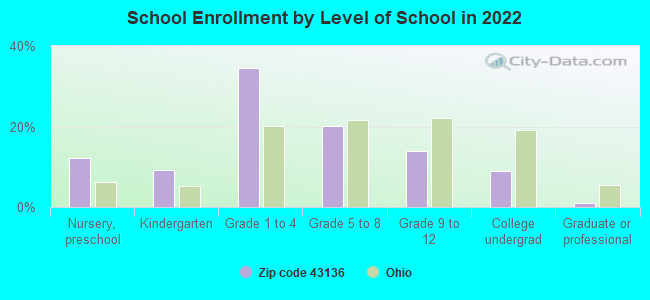
Private vs. public school enrollment:
Students in private schools in grades 1 to 8 (elementary and middle school): 94
Here:
30.5%
Ohio:
16.0%
Students in private schools in grades 9 to 12 (high school): 4
Here:
5.2%
Ohio:
13.1%
Students in private undergraduate colleges: 4
Here:
9.0%
Ohio:
22.3%
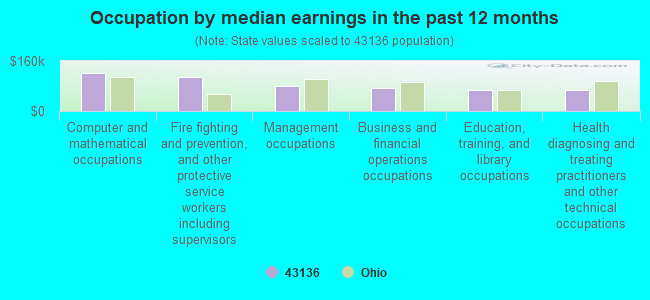
Occupation by median earnings in the past 12 months ($)
122,757Computer and mathematical occupations
107,370Fire fighting and prevention, and other protective service workers including supervisors
80,924Management occupations
73,570Business and financial operations occupations
67,369Education, training, and library occupations
67,292Health diagnosing and treating practitioners and other technical occupations
Top industries in this zip code by the number of employees in 2005:
Information: Libraries and Archives (10-19 employees: 1 establishment)
Accommodation and Food Services: Full-Service Restaurants (10-19: 1)
Health Care and Social Assistance: Residential Mental Health and Substance Abuse Facilities (10-19: 1)
Other Services (except Public Administration): Civic and Social Organizations (5-9: 1)
Construction: Flooring Contractors (5-9: 1)
Other Services (except Public Administration): Grantmaking Foundations (5-9: 1)
Home Mortgage Disclosure Act Aggregated Statistics For Year 2009 (Based on 2 partial tracts)
C) Refinancings
Number
Average Value
LOANS ORIGINATED
1
$230,690
APPLICATIONS APPROVED, NOT ACCEPTED
0
$0
APPLICATIONS DENIED
1
$111,180
APPLICATIONS WITHDRAWN
0
$0
FILES CLOSED FOR INCOMPLETENESS
0
$0
Aggregated Statistics For Year 2008 (Based on 2 partial tracts)
C) Refinancings
Number
Average Value
LOANS ORIGINATED
1
$112,820
APPLICATIONS APPROVED, NOT ACCEPTED
0
$0
APPLICATIONS DENIED
1
$139,680
APPLICATIONS WITHDRAWN
0
$0
FILES CLOSED FOR INCOMPLETENESS
0
$0
Aggregated Statistics For Year 2007 (Based on 2 partial tracts)
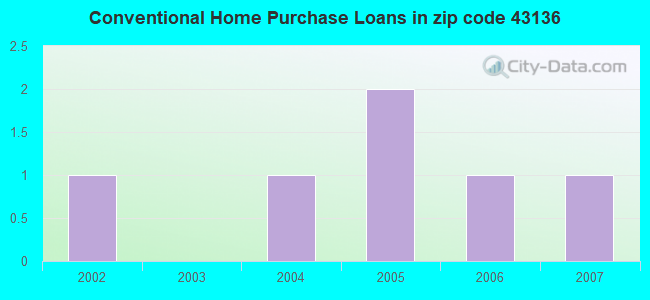
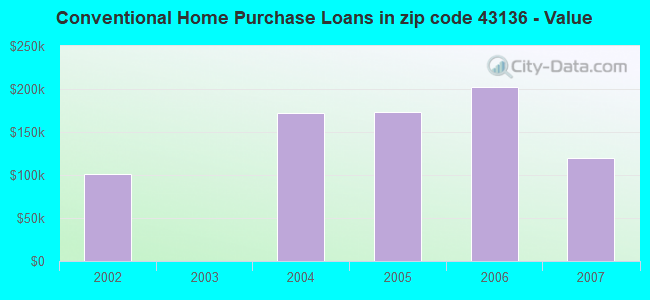
B) Conventional Home Purchase Loans
C) Refinancings
Number
Average Value
Number
Average Value
LOANS ORIGINATED
1
$119,750
1
$92,010
APPLICATIONS APPROVED, NOT ACCEPTED
0
$0
0
$0
APPLICATIONS DENIED
0
$0
1
$181,940
APPLICATIONS WITHDRAWN
0
$0
0
$0
FILES CLOSED FOR INCOMPLETENESS
0
$0
0
$0
Aggregated Statistics For Year 2006 (Based on 2 partial tracts)
B) Conventional Home Purchase Loans
C) Refinancings
Number
Average Value
Number
Average Value
LOANS ORIGINATED
1
$202,440
1
$156,840
APPLICATIONS APPROVED, NOT ACCEPTED
0
$0
0
$0
APPLICATIONS DENIED
1
$89,900
1
$104,630
APPLICATIONS WITHDRAWN
0
$0
0
$0
FILES CLOSED FOR INCOMPLETENESS
0
$0
0
$0
Aggregated Statistics For Year 2005 (Based on 2 partial tracts)
B) Conventional Home Purchase Loans
C) Refinancings
Number
Average Value
Number
Average Value
LOANS ORIGINATED
2
$173,120
1
$197,220
APPLICATIONS APPROVED, NOT ACCEPTED
0
$0
0
$0
APPLICATIONS DENIED
0
$0
1
$140,040
APPLICATIONS WITHDRAWN
0
$0
0
$0
FILES CLOSED FOR INCOMPLETENESS
0
$0
0
$0
Aggregated Statistics For Year 2004 (Based on 2 partial tracts)
A) FHA, FSA/RHS & VA Home Purchase Loans
B) Conventional Home Purchase Loans
C) Refinancings
Number
Average Value
Number
Average Value
Number
Average Value
LOANS ORIGINATED
1
$113,960
1
$172,260
1
$165,560
APPLICATIONS APPROVED, NOT ACCEPTED
0
$0
0
$0
0
$0
APPLICATIONS DENIED
0
$0
0
$0
0
$0
APPLICATIONS WITHDRAWN
0
$0
0
$0
0
$0
FILES CLOSED FOR INCOMPLETENESS
0
$0
0
$0
0
$0
Aggregated Statistics For Year 2003 (Based on 2 partial tracts)
A) FHA, FSA/RHS & VA Home Purchase Loans
C) Refinancings
Number
Average Value
Number
Average Value
LOANS ORIGINATED
1
$90,990
3
$125,787
APPLICATIONS APPROVED, NOT ACCEPTED
0
$0
0
$0
APPLICATIONS DENIED
0
$0
1
$104,020
APPLICATIONS WITHDRAWN
0
$0
0
$0
FILES CLOSED FOR INCOMPLETENESS
0
$0
0
$0
Aggregated Statistics For Year 2002 (Based on 2 partial tracts)
A) FHA, FSA/RHS & VA Home Purchase Loans
B) Conventional Home Purchase Loans
C) Refinancings
Number
Average Value
Number
Average Value
Number
Average Value
LOANS ORIGINATED
0
$0
1
$101,740
2
$139,050
APPLICATIONS APPROVED, NOT ACCEPTED
0
$0
0
$0
0
$0
APPLICATIONS DENIED
1
$88,220
0
$0
0
$0
APPLICATIONS WITHDRAWN
0
$0
0
$0
0
$0
FILES CLOSED FOR INCOMPLETENESS
0
$0
0
$0
0
$0
Aggregated Statistics For Year 2001 (Based on 2 partial tracts)
C) Refinancings
Number
Average Value
LOANS ORIGINATED
1
$196,060
APPLICATIONS APPROVED, NOT ACCEPTED
0
$0
APPLICATIONS DENIED
0
$0
APPLICATIONS WITHDRAWN
0
$0
FILES CLOSED FOR INCOMPLETENESS
0
$0
Aggregated Statistics For Year 2000 (Based on 2 partial tracts)
Detailed HMDA statistics for the following Tracts:0307.00
2002 - 2018 National Fire Incident Reporting System (NFIRS) incidents
Based on the data from the years 2002 - 2018 the average number of fire incidents per year is 12. The highest number of reported fires - 22 took place in 2007, and the least - 5 in 2004. The data has a constant trend.
When looking into fire subcategories, the most incidents belonged to: Structure Fires (62.9%), and Outside Fires (27.2%).
Fire incident types reported to NFIRS in Zip Code 43136
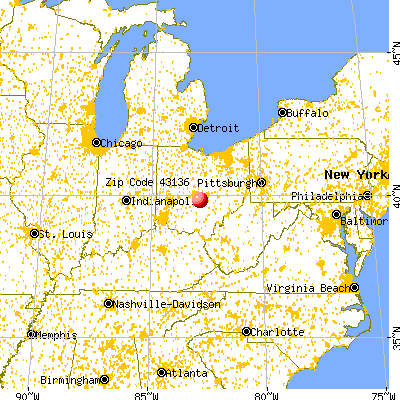


 Nearest zip codes: 43110, 43125, 43112, 43217, 43109, 43147.


 Based on the data from the years 2002 - 2018 the average number of fire incidents per year is 12. The highest number of reported fires - 22 took place in 2007, and the least - 5 in 2004. The data has a constant trend.
 When looking into fire subcategories, the most incidents belonged to: Structure Fires (62.9%), and Outside Fires (27.2%).