Estimated zip code population in 2022: 1,745 Zip code population in 2010: 1,879 Zip code population in 2000: 1,967
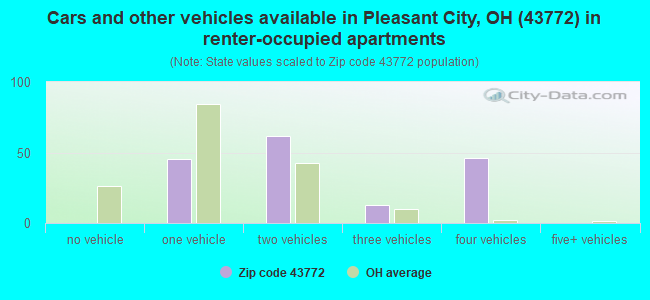
Houses and condos: 966 Renter-occupied apartments: 175
% of renters here:
23%
State:
33%
March 2022 cost of living index in zip code 43772: 82.4 (low, U.S. average is 100)
Land area: 34.1 sq. mi. Water area: 0.1 sq. mi.
Population density: 51 people per square mile
(very low).
OSM Map
General Map
Google Map
MSN Map
OSM Map
General Map
Google Map
MSN Map
OSM Map
General Map
Google Map
MSN Map
OSM Map
General Map
Google Map
MSN Map
Please wait while loading the map...
Real estate property taxes paid for housing units in 2022:
This zip code:
0.8% ($1,186)
Ohio:
1.3% ($2,639)
Median real estate property taxes paid for housing units with mortgages in 2022: $1,295 (0.9%) Median real estate property taxes paid for housing units with no mortgage in 2022: $800 (0.6%)
Business Search- 14 Million verified businesses
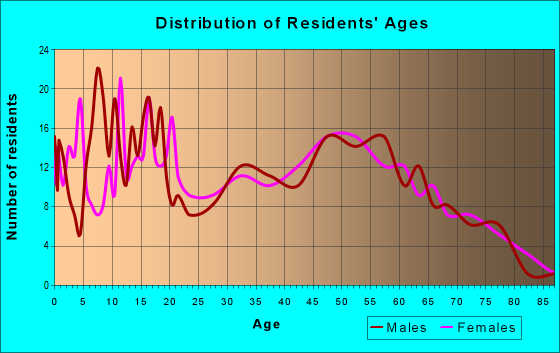
Males: 845
(48.4%)
Females: 899
(51.6%)
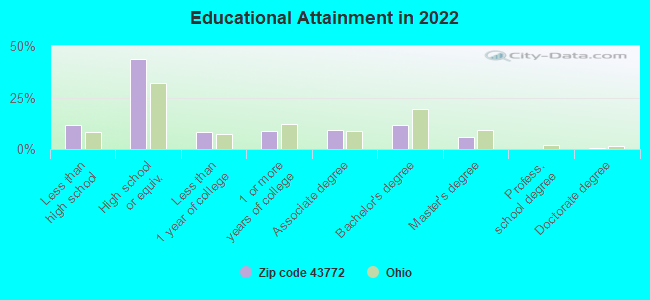
For population 25 years and over in 43772:
High school or higher: 87.2%
Bachelor's degree or higher: 17.7%
Graduate or professional degree: 6.2%
Unemployed: 3.6%
Mean travel time to work (commute): 24.0 minutes
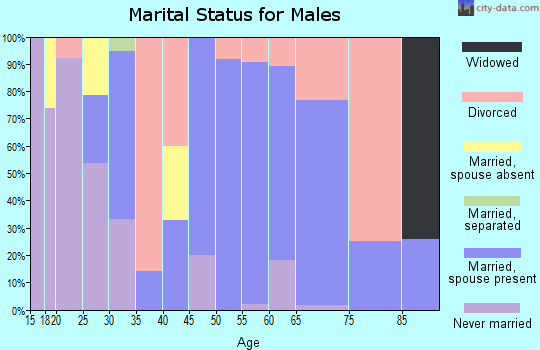
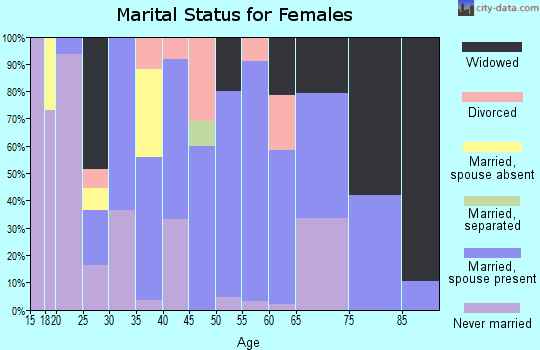
For population 15 years and over in 43772:
Never married: 23.5%
Now married: 53.2%
Separated: 0.6%
Widowed: 6.5%
Divorced: 16.2%
Zip code 43772 compared to state average:
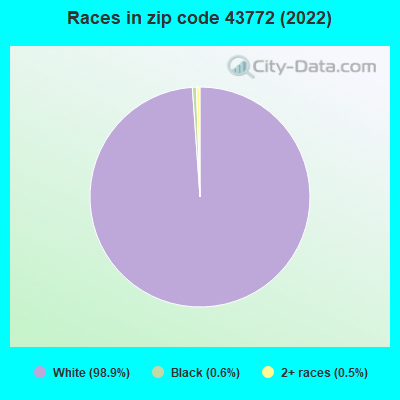
Black race population percentage significantly below state average.
Hispanic race population percentage significantly below state average.
Foreign-born population percentage significantly below state average.
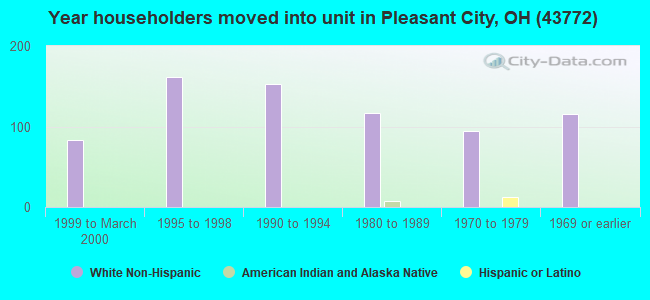
Length of stay since moving in significantly above state average.
Number of college students below state average.
Percentage of population with a bachelor's degree or higher below state average.
Averages for the 2020 tax year for zip code 43772, filed in 2021:
Average Adjusted Gross Income (AGI) in 2020: $47,341 (Individual Income Tax Returns)
Here:
$47,341
State:
$67,288
Salary/wage: $42,751 (reported on 81.7% of returns)
Here:
$42,751
State:
$55,628
(% of AGI for various income ranges: 1092.9% for AGIs below $25k, 3268.0% for AGIs $25k-50k, 6060.9% for AGIs $50k-75k, 9132.9% for AGIs $75k-100k, 14396.7% for AGIs $100k-200k)
Taxable interest for individuals: $335 (reported on 21.5% of returns)
This zip code:
$335
Ohio:
$1,518
(% of AGI for various income ranges: 12.5% for AGIs below $25k, 4.4% for AGIs $25k-50k, 13.6% for AGIs $50k-75k, 5.7% for AGIs $75k-100k, 11.7% for AGIs $100k-200k)
Ordinary dividends: $1,350 (reported on 10.8% of returns)
Here:
$1,350
State:
$7,167
(% of AGI for various income ranges: 17.2% for AGIs $25k-50k, 30.9% for AGIs $50k-75k, 96.7% for AGIs $100k-200k)
Net capital gain/loss in AGI: +$4,478 (reported on 9.7% of returns)
Here:
+$4,478
State:
+$18,919
(% of AGI for various income ranges: 46.8% for AGIs $25k-50k, 174.5% for AGIs $50k-75k, 156.7% for AGIs $100k-200k)
Profit/loss from business: +$8,822 (reported on 9.7% of returns)
Here:
+$8,822
State:
+$13,744
(% of AGI for various income ranges: 51.7% for AGIs below $25k, 102.4% for AGIs $25k-50k, 591.4% for AGIs $75k-100k)
Taxable individual retirement arrangement distribution: $10,880 (reported on 5.4% of returns)
43772:
$10,880
Ohio:
$18,876
(% of AGI for various income ranges: 105.4% for AGIs below $25k, 264.5% for AGIs $50k-75k)
Earned income credit: $2,650 (reported on 17.2% of returns)
Here:
$2,650
State:
$2,304
(% of AGI for various income ranges: 96.2% for AGIs below $25k, 77.2% for AGIs $25k-50k)
Percentage of individuals using paid preparers for their 2020 taxes: 96.8%
Here:
97%
State:
94%
(% for various income ranges: 93.5% for AGIs below $25k, 96.7% for AGIs $25k-50k, 100.0% for AGIs $50k-75k, 100.0% for AGIs $75k-100k, 100.0% for AGIs $100k-200k)
Averages for the 2012 tax year for zip code 43772, filed in 2013:
Average Adjusted Gross Income (AGI) in 2012: $54,710 (Individual Income Tax Returns)
Here:
$54,710
State:
$54,926
Salary/wage: $33,375 (reported on 85.4% of returns)
Here:
$33,375
State:
$45,869
(% of AGI for various income ranges: 77.7% for AGIs below $25k, 78.4% for AGIs $25k-50k, 74.9% for AGIs $50k-75k, 71.8% for AGIs $75k-100k, 63.5% for AGIs $100k-200k)
Taxable interest for individuals: $352 (reported on 25.8% of returns)
This zip code:
$352
Ohio:
$1,297
(% of AGI for various income ranges: 0.6% for AGIs below $25k, 0.2% for AGIs $25k-50k, 0.1% for AGIs $75k-100k, 0.1% for AGIs over 200k)
Ordinary dividends: $688 (reported on 9.0% of returns)
Here:
$688
State:
$5,821
(% of AGI for various income ranges: 0.6% for AGIs below $25k, 0.1% for AGIs $50k-75k, 0.2% for AGIs $100k-200k)
Net capital gain/loss in AGI: +$1,700 (reported on 5.6% of returns)
Here:
+$1,700
State:
+$11,232
(% of AGI for various income ranges: 0.2% for AGIs below $25k, 1.2% for AGIs $75k-100k)
Profit/loss from business: +$7,655 (reported on 12.4% of returns)
Here:
+$7,655
State:
+$12,773
(% of AGI for various income ranges: 4.4% for AGIs below $25k, 1.8% for AGIs $25k-50k, 1.5% for AGIs $50k-75k, 5.8% for AGIs $75k-100k)
Taxable individual retirement arrangement distribution: $7,700 (reported on 5.6% of returns)
43772:
$7,700
Ohio:
$14,511
(% of AGI for various income ranges: 4.6% for AGIs $25k-50k)
Total itemized deductions: $17,392 (12% of AGI, reported on 14.6% of returns)
Here:
$17,392
State:
$21,278
Here:
11.9% of AGI
State:
18.8% of AGI
(% of AGI for various income ranges: 5.9% for AGIs $25k-50k, 5.4% for AGIs $50k-75k, 6.1% for AGIs $75k-100k, 12.9% for AGIs $100k-200k)
Charity contributions: $3,000 (reported on 7.9% of returns)
Here:
$3,000
State:
$3,943
(% of AGI for various income ranges: 0.8% for AGIs $50k-75k, 2.0% for AGIs $100k-200k)
Taxes paid: $6,100 (reported on 14.6% of returns)
43772:
$6,100
State:
$9,568
(% of AGI for various income ranges: 0.8% for AGIs $25k-50k, 1.4% for AGIs $50k-75k, 1.5% for AGIs $75k-100k, 6.9% for AGIs $100k-200k)
Earned income credit: $2,283 (reported on 20.2% of returns)
Here:
$2,283
State:
$2,285
(% of AGI for various income ranges: 6.5% for AGIs below $25k, 1.0% for AGIs $25k-50k)
Percentage of individuals using paid preparers for their 2012 taxes: 53.9%
Here:
54%
State:
51%
(% for various income ranges: 44.7% for AGIs below $25k, 52.2% for AGIs $25k-50k, 66.7% for AGIs $50k-75k, 57.1% for AGIs $75k-100k, 66.7% for AGIs $100k-200k, 100.0% for AGIs over 200k)
Averages for the 2004 tax year for zip code 43772, filed in 2005:
Average Adjusted Gross Income (AGI) in 2004: $29,959 (Individual Income Tax Returns)
Here:
$29,959
State:
$44,480
Salary/wage: $29,000 (reported on 88.7% of returns)
Here:
$29,000
State:
$39,198
(% of AGI for various income ranges: 95.9% for AGIs below $10k, 76.1% for AGIs $10k-25k, 89.6% for AGIs $25k-50k, 90.2% for AGIs $50k-75k, 80.0% for AGIs $75k-100k)
Taxable interest for individuals: $719 (reported on 30.0% of returns)
This zip code:
$719
Ohio:
$1,532
(% of AGI for various income ranges: 0.8% for AGIs below $10k, 1.4% for AGIs $10k-25k, 0.7% for AGIs $25k-50k, 0.2% for AGIs $50k-75k, 0.8% for AGIs $75k-100k)
Taxable dividends: $417 (reported on 12.8% of returns)
Here:
$417
State:
$3,496
Net capital gain/loss: +$701 (reported on 7.9% of returns)
Here:
+$701
State:
+$8,582
Profit/loss from business: +$3,730 (reported on 11.8% of returns)
Here:
+$3,730
State:
+$10,813
(% of AGI for various income ranges: -1.6% for AGIs below $10k, 2.7% for AGIs $10k-25k, 1.8% for AGIs $25k-50k, 1.3% for AGIs $50k-75k)
IRA payment deduction: $2,500 (reported on 1.4% of returns)
43772:
$2,500
Ohio:
$2,794
Total itemized deductions: $13,130 (26% of AGI, reported on 14.6% of returns)
Here:
$13,130
State:
$17,503
Here:
25.5% of AGI
State:
20.8% of AGI
(% of AGI for various income ranges: 6.0% for AGIs $10k-25k, 5.0% for AGIs $25k-50k, 7.4% for AGIs $50k-75k, 10.1% for AGIs $75k-100k)
Charity contributions deductions: $1,420 (3% of AGI, reported on 9.6% of returns)
Here:
$1,420
State:
$3,087
Here:
2.6% of AGI
State:
3.4% of AGI
(% of AGI for various income ranges: 0.1% for AGIs $10k-25k, 0.2% for AGIs $25k-50k, 0.6% for AGIs $50k-75k, 1.2% for AGIs $75k-100k)
Total tax: $2,804 (reported on 73.9% of returns)
43772:
$2,804
State:
$6,781
(% of AGI for various income ranges: 1.9% for AGIs below $10k, 3.9% for AGIs $10k-25k, 6.2% for AGIs $25k-50k, 8.5% for AGIs $50k-75k, 11.3% for AGIs $75k-100k)
Earned income credit: $1,693 (reported on 19.3% of returns)
Here:
$1,693
State:
$1,696
Percentage of individuals using paid preparers for their 2004 taxes: 51.9%
Here:
52%
State:
55%
(% for various income ranges: 50.0% for AGIs below $10k, 55.2% for AGIs $10k-25k, 53.3% for AGIs $25k-50k, 39.2% for AGIs $50k-75k, 59.5% for AGIs $75k-100k)
Household received Food Stamps/SNAP in the past 12 months: 47 Household did not receive Food Stamps/SNAP in the past 12 months: 714
Women who had a birth in the past 12 months: 5 (2 now married, 3 unmarried) Women who did not have a birth in the past 12 months: 373 (144 now married, 228 unmarried)
Housing units in zip code 43772 with a mortgage: 291 (25 second mortgage, 25 both second mortgage and home equity loan) Houses without a mortgage: 34
Median monthly owner costs for units with a mortgage: $1,032 Median monthly owner costs for units without a mortgage: $445
Residents with income below the poverty level in 2022:
This zip code:
11.2%
Whole state:
13.4%
Residents with income below 50% of the poverty level in 2022:
This zip code:
4.8%
Whole state:
7.0%
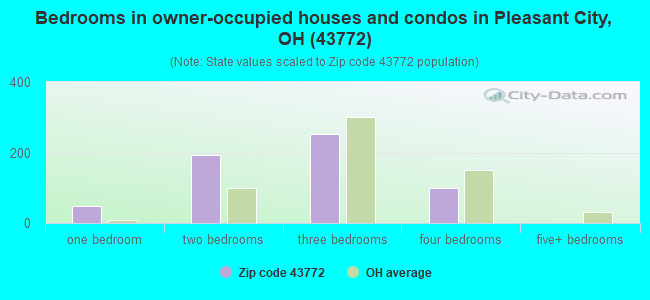
Median number of rooms in houses and condos:
Here:
6.4
State:
6.7
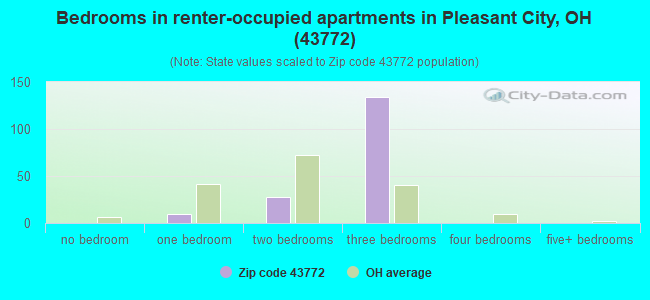
Median number of rooms in apartments:
Here:
5.8
State:
4.4
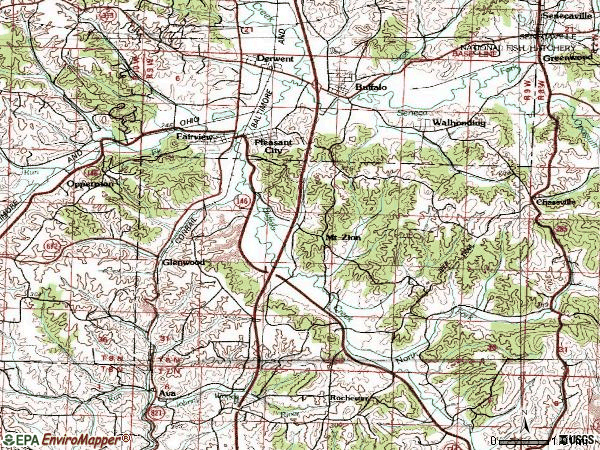
Notable locations in this zip code not listed on our city pages
Cemeteries: Mount Zion Lutheran Cemetery (1), Bethel Methodist Episcopal Cemetery (2), Pleasant City Protestant Cemetery (3). Display/hide their locations on the map
Size of family households: 285 2-persons, 116 3-persons, 132 4-persons, 24 5-persons, 9 6-persons
Size of nonfamily households: 137 1-person, 53 2-persons, 1 3-persons
204 married couples with children.
162 single-parent households (10 men, 152 women).
99.6% of residents of 43772 zip code speak English at home.
0.3% of residents speak other Indo-European language at home (100% very well).
0.1% of residents speak other language at home (100% very well).
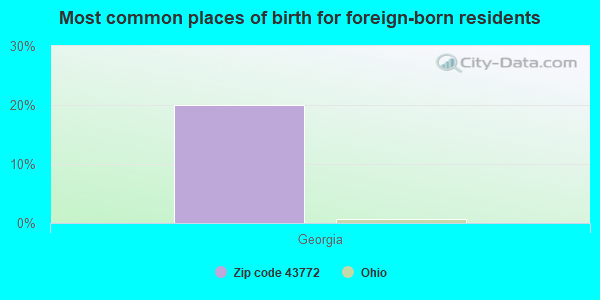
Foreign born population: 5 (0.3%) (60.4% of them are naturalized citizens)
This zip code:
0.3%
Whole state:
5.0%
20%Georgia
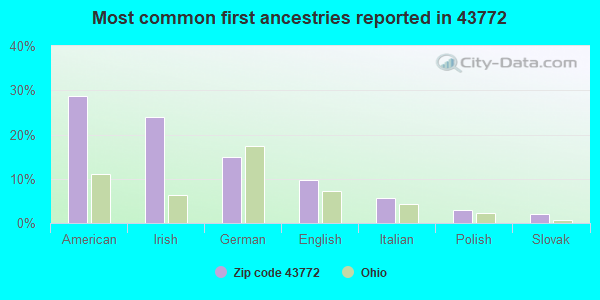
29%American
24%Irish
15%German
10%English
6%Italian
3%Polish
2%Slovak
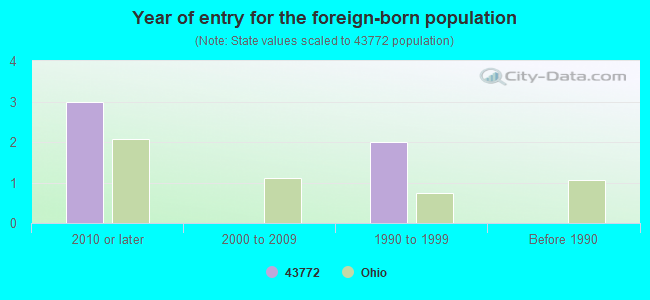
Year of entry for the foreign-born population
32010 or later
02000 to 2009
21990 to 1999
0Before 1990
Facilities with environmental interests located in this zip code:
ALLTEL - BUFFALO (52018 COUNTY ROAD 36 in PLEASANT CITY, OH)
(Integrated Compliance Information System) - ICIS-HQ-2000-6004, FORMAL ENFORCEMENT ACTION
AT&T LONG LINES PLEASANT CITY OHIO (APPROX 2M SOUTH PLEASANT CITY in PLEASANT CITY, OH)
(Resource Conservation and Recovery Act (tracking hazardous waste)) Organizations: AMERICAN TELEPHONE AND TELEGRAPH (CONTACT/OWNER)
Housing units lacking complete plumbing facilities: 4.0% Housing units lacking complete kitchen facilities: 4.1%
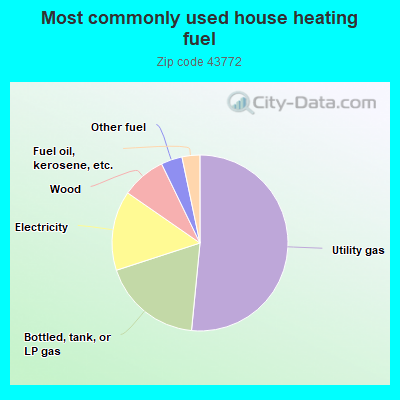
51.7%Utility gas
18.5%Bottled, tank, or LP gas
14.7%Electricity
8.2%Wood
3.9%Other fuel
3.3%Fuel oil, kerosene, etc.
Population in 1990: 1,231. Population change in the 1990s: +736 (+59.8%).
Place of birth for U.S.-born residents:
This state: 1,493
Northeast: 23
Midwest: 14
South: 200
West: 1
70% of the 43772 zip code residents lived in the same house 5 years ago. Out of people who lived in different houses, 49% lived in this county. Out of people who lived in different counties, 50% lived in Ohio.
94% of the 43772 zip code residents lived in the same house 1 year ago. Out of people who lived in different houses, 72% moved from this county. Out of people who lived in different houses, 24% moved from different county within same state. Out of people who lived in different houses, 6% moved from different state.
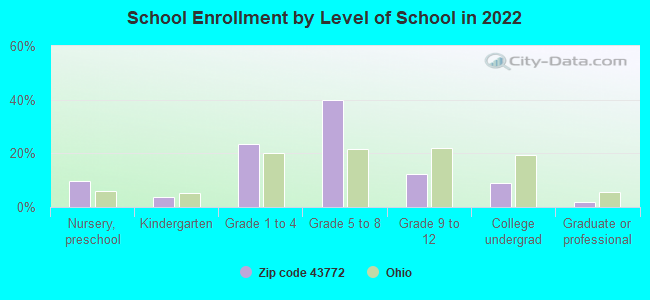
Private vs. public school enrollment:
Students in private schools in grades 1 to 8 (elementary and middle school):
Here:
0.0%
Ohio:
16.0%
Students in private schools in grades 9 to 12 (high school):
Here:
0.0%
Ohio:
13.1%
Students in private undergraduate colleges: 1
Here:
5.4%
Ohio:
22.3%
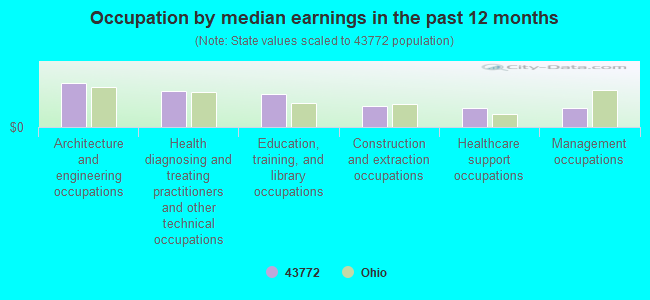
Occupation by median earnings in the past 12 months ($)
106,940Architecture and engineering occupations
87,597Health diagnosing and treating practitioners and other technical occupations
79,954Education, training, and library occupations
52,041Construction and extraction occupations
47,164Healthcare support occupations
46,477Management occupations
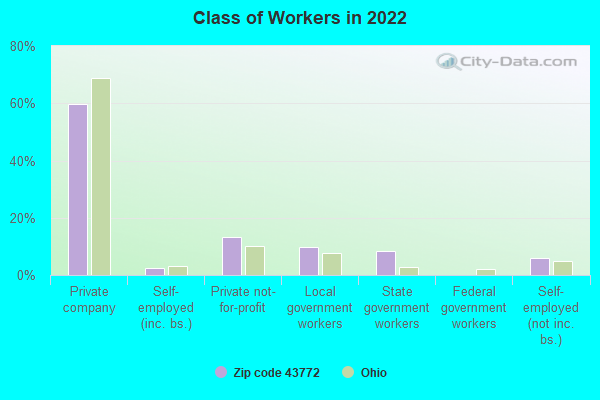
Top industries in this zip code by the number of employees in 2005:
Other Services (except Public Administration): Religious Organizations (1-4 employees: 4 establishments)
Construction: Poured Concrete Foundation and Structure Contractors (5-9: 1)
Construction: Plumbing, Heating, and Air-Conditioning Contractors (1-4: 1)
Other Services (except Public Administration): Beauty Salons (1-4: 1)
Accommodation and Food Services: Limited-Service Restaurants (1-4: 1)
Fatal accident statistics in 2014:
Fatal accident count: 1
Vehicles involved in fatal accidents: 2
Fatal accidents caused by drunken drivers: 0
Fatalities: 1
Persons involved in fatal accidents: 3
Pedestrians involved in fatal accidents: 0
2002 - 2018 National Fire Incident Reporting System (NFIRS) incidents
Based on the data from the years 2002 - 2018 the average number of fires per year is 12. The highest number of fire incidents - 29 took place in 2009, and the least - 2 in 2005. The data has a growing trend.
When looking into fire subcategories, the most reports belonged to: Structure Fires (43.9%), and Outside Fires (28.6%).
Fire incident types reported to NFIRS in Zip Code 43772


 Nearest zip codes: 43722, 43733, 43711, 43723, 43780, 43717.
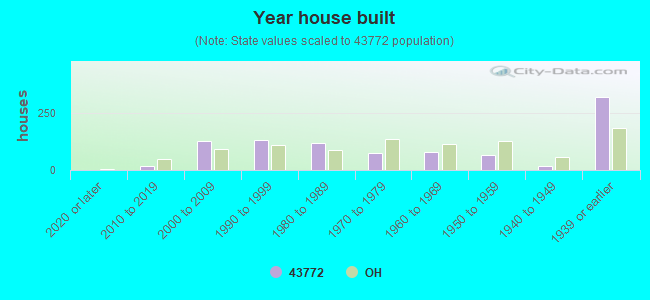


 Based on the data from the years 2002 - 2018 the average number of fires per year is 12. The highest number of fire incidents - 29 took place in 2009, and the least - 2 in 2005. The data has a growing trend.
 When looking into fire subcategories, the most reports belonged to: Structure Fires (43.9%), and Outside Fires (28.6%).