Cities: Waynesville, OH (3.39%) ,
Harveysburg, OH (1.06%) ,
Corwin, OH (0.49%) Counties: Warren County, OH (94.48%) ,
Greene County, OH (5.16%) ,
Clinton County, OH (0.36%) Estimated zip code population in 2022: 11,928
Zip code population in 2010: 10,479
Zip code population in 2000: 8,937
Houses and condos: 4,864
Renter-occupied apartments: 795
% of renters here:
17%State:
33%
March 2022 cost of living index in zip code 45068: 86.7
(less than average, U.S. average is 100)
Land area: 66.1
sq. mi.
Water area: 4.3
sq. mi.
Population density: 181 people per square mile (very low).
OSM Map
General Map
Google Map
MSN Map
OSM Map
General Map
Google Map
MSN Map
OSM Map
General Map
Google Map
MSN Map
OSM Map
General Map
Google Map
MSN Map
Please wait while loading the map...
Real estate property taxes paid for housing units in 2022:
This zip code:
1.3% ($4,220)Ohio:
1.3% ($2,639)
Median real estate property taxes paid for housing units with mortgages in 2022: $4,383 (1.2%)
Median real estate property taxes paid for housing units with no mortgage in 2022: $3,881 (1.5%)
Profiles of local businesses
Business Search - 14 Million verified businesses
Males: 6,289 Females: 5,639
For population 25 years and over in 45068:
High school or higher: 95.8%Bachelor's degree or higher: 45.1%Graduate or professional degree: 22.8%Unemployed: 2.5%Mean travel time to work (commute): 25.4 minutes
For population 15 years and over in 45068:
Never married: 19.9%Now married: 64.4%Separated: 1.1%Widowed: 4.3%Divorced: 10.3%
Zip code 45068 compared to state average:
Median house value above state average. Black race population percentage significantly below state average. Median age above state average. Foreign-born population percentage significantly below state average. Renting percentage below state average. 10,752 90.2% White 436 3.7% Two or more races 357 3.0% Hispanic or Latino 347 2.9% Asian 22 0.2% Some other race 10 0.08% Black
Data:
Median household income ($)
Median household income (% change since 2000)
Household income diversity
Ratio of average income to average house value (%)
Ratio of average income to average rent
Median household income ($) - White
Median household income ($) - Black or African American
Median household income ($) - Asian
Median household income ($) - Hispanic or Latino
Median household income ($) - American Indian and Alaska Native
Median household income ($) - Multirace
Median household income ($) - Other Race
Median household income for houses/condos with a mortgage ($)
Median household income for apartments without a mortgage ($)
Races - White alone (%)
Races - White alone (% change since 2000)
Races - Black alone (%)
Races - Black alone (% change since 2000)
Races - American Indian alone (%)
Races - American Indian alone (% change since 2000)
Races - Asian alone (%)
Races - Asian alone (% change since 2000)
Races - Hispanic (%)
Races - Hispanic (% change since 2000)
Races - Native Hawaiian and Other Pacific Islander alone (%)
Races - Native Hawaiian and Other Pacific Islander alone (% change since 2000)
Races - Two or more races (%)
Races - Two or more races (% change since 2000)
Races - Other race alone (%)
Races - Other race alone (% change since 2000)
Racial diversity
Unemployment (%)
Unemployment (% change since 2000)
Unemployment (%) - White
Unemployment (%) - Black or African American
Unemployment (%) - Asian
Unemployment (%) - Hispanic or Latino
Unemployment (%) - American Indian and Alaska Native
Unemployment (%) - Multirace
Unemployment (%) - Other Race
Population density (people per square mile)
Population - Males (%)
Population - Females (%)
Population - Males (%) - White
Population - Males (%) - Black or African American
Population - Males (%) - Asian
Population - Males (%) - Hispanic or Latino
Population - Males (%) - American Indian and Alaska Native
Population - Males (%) - Multirace
Population - Males (%) - Other Race
Population - Females (%) - White
Population - Females (%) - Black or African American
Population - Females (%) - Asian
Population - Females (%) - Hispanic or Latino
Population - Females (%) - American Indian and Alaska Native
Population - Females (%) - Multirace
Population - Females (%) - Other Race
Coronavirus confirmed cases (Apr 19, 2024)
Deaths caused by coronavirus (Apr 19, 2024)
Coronavirus confirmed cases (per 100k population) (Apr 19, 2024)
Deaths caused by coronavirus (per 100k population) (Apr 19, 2024)
Daily increase in number of cases (Apr 19, 2024)
Weekly increase in number of cases (Apr 19, 2024)
Cases doubled (in days) (Apr 19, 2024)
Hospitalized patients (Apr 18, 2022)
Negative test results (Apr 18, 2022)
Total test results (Apr 18, 2022)
COVID Vaccine doses distributed (per 100k population) (Sep 19, 2023)
COVID Vaccine doses administered (per 100k population) (Sep 19, 2023)
COVID Vaccine doses distributed (Sep 19, 2023)
COVID Vaccine doses administered (Sep 19, 2023)
Likely homosexual households (%)
Likely homosexual households (% change since 2000)
Likely homosexual households - Lesbian couples (%)
Likely homosexual households - Lesbian couples (% change since 2000)
Likely homosexual households - Gay men (%)
Likely homosexual households - Gay men (% change since 2000)
Cost of living index
Median gross rent ($)
Median contract rent ($)
Median monthly housing costs ($)
Median house or condo value ($)
Median house or condo value ($ change since 2000)
Mean house or condo value by units in structure - 1, detached ($)
Mean house or condo value by units in structure - 1, attached ($)
Mean house or condo value by units in structure - 2 ($)
Mean house or condo value by units in structure by units in structure - 3 or 4 ($)
Mean house or condo value by units in structure - 5 or more ($)
Mean house or condo value by units in structure - Boat, RV, van, etc. ($)
Mean house or condo value by units in structure - Mobile home ($)
Median house or condo value ($) - White
Median house or condo value ($) - Black or African American
Median house or condo value ($) - Asian
Median house or condo value ($) - Hispanic or Latino
Median house or condo value ($) - American Indian and Alaska Native
Median house or condo value ($) - Multirace
Median house or condo value ($) - Other Race
Median resident age
Resident age diversity
Median resident age - Males
Median resident age - Females
Median resident age - White
Median resident age - Black or African American
Median resident age - Asian
Median resident age - Hispanic or Latino
Median resident age - American Indian and Alaska Native
Median resident age - Multirace
Median resident age - Other Race
Median resident age - Males - White
Median resident age - Males - Black or African American
Median resident age - Males - Asian
Median resident age - Males - Hispanic or Latino
Median resident age - Males - American Indian and Alaska Native
Median resident age - Males - Multirace
Median resident age - Males - Other Race
Median resident age - Females - White
Median resident age - Females - Black or African American
Median resident age - Females - Asian
Median resident age - Females - Hispanic or Latino
Median resident age - Females - American Indian and Alaska Native
Median resident age - Females - Multirace
Median resident age - Females - Other Race
Commute - mean travel time to work (minutes)
Travel time to work - Less than 5 minutes (%)
Travel time to work - Less than 5 minutes (% change since 2000)
Travel time to work - 5 to 9 minutes (%)
Travel time to work - 5 to 9 minutes (% change since 2000)
Travel time to work - 10 to 19 minutes (%)
Travel time to work - 10 to 19 minutes (% change since 2000)
Travel time to work - 20 to 29 minutes (%)
Travel time to work - 20 to 29 minutes (% change since 2000)
Travel time to work - 30 to 39 minutes (%)
Travel time to work - 30 to 39 minutes (% change since 2000)
Travel time to work - 40 to 59 minutes (%)
Travel time to work - 40 to 59 minutes (% change since 2000)
Travel time to work - 60 to 89 minutes (%)
Travel time to work - 60 to 89 minutes (% change since 2000)
Travel time to work - 90 or more minutes (%)
Travel time to work - 90 or more minutes (% change since 2000)
Marital status - Never married (%)
Marital status - Now married (%)
Marital status - Separated (%)
Marital status - Widowed (%)
Marital status - Divorced (%)
Median family income ($)
Median family income (% change since 2000)
Median non-family income ($)
Median non-family income (% change since 2000)
Median per capita income ($)
Median per capita income (% change since 2000)
Median family income ($) - White
Median family income ($) - Black or African American
Median family income ($) - Asian
Median family income ($) - Hispanic or Latino
Median family income ($) - American Indian and Alaska Native
Median family income ($) - Multirace
Median family income ($) - Other Race
Median year house/condo built
Median year apartment built
Year house built - Built 2005 or later (%)
Year house built - Built 2000 to 2004 (%)
Year house built - Built 1990 to 1999 (%)
Year house built - Built 1980 to 1989 (%)
Year house built - Built 1970 to 1979 (%)
Year house built - Built 1960 to 1969 (%)
Year house built - Built 1950 to 1959 (%)
Year house built - Built 1940 to 1949 (%)
Year house built - Built 1939 or earlier (%)
Average household size
Household density (households per square mile)
Average household size - White
Average household size - Black or African American
Average household size - Asian
Average household size - Hispanic or Latino
Average household size - American Indian and Alaska Native
Average household size - Multirace
Average household size - Other Race
Occupied housing units (%)
Vacant housing units (%)
Owner occupied housing units (%)
Renter occupied housing units (%)
Vacancy status - For rent (%)
Vacancy status - For sale only (%)
Vacancy status - Rented or sold, not occupied (%)
Vacancy status - For seasonal, recreational, or occasional use (%)
Vacancy status - For migrant workers (%)
Vacancy status - Other vacant (%)
Residents with income below the poverty level (%)
Residents with income below 50% of the poverty level (%)
Children below poverty level (%)
Poor families by family type - Married-couple family (%)
Poor families by family type - Male, no wife present (%)
Poor families by family type - Female, no husband present (%)
Poverty status for native-born residents (%)
Poverty status for foreign-born residents (%)
Poverty among high school graduates not in families (%)
Poverty among people who did not graduate high school not in families (%)
Residents with income below the poverty level (%) - White
Residents with income below the poverty level (%) - Black or African American
Residents with income below the poverty level (%) - Asian
Residents with income below the poverty level (%) - Hispanic or Latino
Residents with income below the poverty level (%) - American Indian and Alaska Native
Residents with income below the poverty level (%) - Multirace
Residents with income below the poverty level (%) - Other Race
Air pollution - Air Quality Index (AQI)
Air pollution - CO
Air pollution - NO2
Air pollution - SO2
Air pollution - Ozone
Air pollution - PM10
Air pollution - PM25
Air pollution - Pb
Crime - Murders per 100,000 population
Crime - Rapes per 100,000 population
Crime - Robberies per 100,000 population
Crime - Assaults per 100,000 population
Crime - Burglaries per 100,000 population
Crime - Thefts per 100,000 population
Crime - Auto thefts per 100,000 population
Crime - Arson per 100,000 population
Crime - City-data.com crime index
Crime - Violent crime index
Crime - Property crime index
Crime - Murders per 100,000 population (5 year average)
Crime - Rapes per 100,000 population (5 year average)
Crime - Robberies per 100,000 population (5 year average)
Crime - Assaults per 100,000 population (5 year average)
Crime - Burglaries per 100,000 population (5 year average)
Crime - Thefts per 100,000 population (5 year average)
Crime - Auto thefts per 100,000 population (5 year average)
Crime - Arson per 100,000 population (5 year average)
Crime - City-data.com crime index (5 year average)
Crime - Violent crime index (5 year average)
Crime - Property crime index (5 year average)
1996 Presidential Elections Results (%) - Democratic Party (Clinton)
1996 Presidential Elections Results (%) - Republican Party (Dole)
1996 Presidential Elections Results (%) - Other
2000 Presidential Elections Results (%) - Democratic Party (Gore)
2000 Presidential Elections Results (%) - Republican Party (Bush)
2000 Presidential Elections Results (%) - Other
2004 Presidential Elections Results (%) - Democratic Party (Kerry)
2004 Presidential Elections Results (%) - Republican Party (Bush)
2004 Presidential Elections Results (%) - Other
2008 Presidential Elections Results (%) - Democratic Party (Obama)
2008 Presidential Elections Results (%) - Republican Party (McCain)
2008 Presidential Elections Results (%) - Other
2012 Presidential Elections Results (%) - Democratic Party (Obama)
2012 Presidential Elections Results (%) - Republican Party (Romney)
2012 Presidential Elections Results (%) - Other
2016 Presidential Elections Results (%) - Democratic Party (Clinton)
2016 Presidential Elections Results (%) - Republican Party (Trump)
2016 Presidential Elections Results (%) - Other
2020 Presidential Elections Results (%) - Democratic Party (Biden)
2020 Presidential Elections Results (%) - Republican Party (Trump)
2020 Presidential Elections Results (%) - Other
Ancestries Reported - Arab (%)
Ancestries Reported - Czech (%)
Ancestries Reported - Danish (%)
Ancestries Reported - Dutch (%)
Ancestries Reported - English (%)
Ancestries Reported - French (%)
Ancestries Reported - French Canadian (%)
Ancestries Reported - German (%)
Ancestries Reported - Greek (%)
Ancestries Reported - Hungarian (%)
Ancestries Reported - Irish (%)
Ancestries Reported - Italian (%)
Ancestries Reported - Lithuanian (%)
Ancestries Reported - Norwegian (%)
Ancestries Reported - Polish (%)
Ancestries Reported - Portuguese (%)
Ancestries Reported - Russian (%)
Ancestries Reported - Scotch-Irish (%)
Ancestries Reported - Scottish (%)
Ancestries Reported - Slovak (%)
Ancestries Reported - Subsaharan African (%)
Ancestries Reported - Swedish (%)
Ancestries Reported - Swiss (%)
Ancestries Reported - Ukrainian (%)
Ancestries Reported - United States (%)
Ancestries Reported - Welsh (%)
Ancestries Reported - West Indian (%)
Ancestries Reported - Other (%)
Educational Attainment - No schooling completed (%)
Educational Attainment - Less than high school (%)
Educational Attainment - High school or equivalent (%)
Educational Attainment - Less than 1 year of college (%)
Educational Attainment - 1 or more years of college (%)
Educational Attainment - Associate degree (%)
Educational Attainment - Bachelor's degree (%)
Educational Attainment - Master's degree (%)
Educational Attainment - Professional school degree (%)
Educational Attainment - Doctorate degree (%)
School Enrollment - Nursery, preschool (%)
School Enrollment - Kindergarten (%)
School Enrollment - Grade 1 to 4 (%)
School Enrollment - Grade 5 to 8 (%)
School Enrollment - Grade 9 to 12 (%)
School Enrollment - College undergrad (%)
School Enrollment - Graduate or professional (%)
School Enrollment - Not enrolled in school (%)
School enrollment - Public schools (%)
School enrollment - Private schools (%)
School enrollment - Not enrolled (%)
Median number of rooms in houses and condos
Median number of rooms in apartments
Housing units lacking complete plumbing facilities (%)
Housing units lacking complete kitchen facilities (%)
Density of houses
Urban houses (%)
Rural houses (%)
Households with people 60 years and over (%)
Households with people 65 years and over (%)
Households with people 75 years and over (%)
Households with one or more nonrelatives (%)
Households with no nonrelatives (%)
Population in households (%)
Family households (%)
Nonfamily households (%)
Population in families (%)
Family households with own children (%)
Median number of bedrooms in owner occupied houses
Mean number of bedrooms in owner occupied houses
Median number of bedrooms in renter occupied houses
Mean number of bedrooms in renter occupied houses
Median number of vehichles in owner occupied houses
Mean number of vehichles in owner occupied houses
Median number of vehichles in renter occupied houses
Mean number of vehichles in renter occupied houses
Mortgage status - with mortgage (%)
Mortgage status - with second mortgage (%)
Mortgage status - with home equity loan (%)
Mortgage status - with both second mortgage and home equity loan (%)
Mortgage status - without a mortgage (%)
Average family size
Average family size - White
Average family size - Black or African American
Average family size - Asian
Average family size - Hispanic or Latino
Average family size - American Indian and Alaska Native
Average family size - Multirace
Average family size - Other Race
Geographical mobility - Same house 1 year ago (%)
Geographical mobility - Moved within same county (%)
Geographical mobility - Moved from different county within same state (%)
Geographical mobility - Moved from different state (%)
Geographical mobility - Moved from abroad (%)
Place of birth - Born in state of residence (%)
Place of birth - Born in other state (%)
Place of birth - Native, outside of US (%)
Place of birth - Foreign born (%)
Housing units in structures - 1, detached (%)
Housing units in structures - 1, attached (%)
Housing units in structures - 2 (%)
Housing units in structures - 3 or 4 (%)
Housing units in structures - 5 to 9 (%)
Housing units in structures - 10 to 19 (%)
Housing units in structures - 20 to 49 (%)
Housing units in structures - 50 or more (%)
Housing units in structures - Mobile home (%)
Housing units in structures - Boat, RV, van, etc. (%)
House/condo owner moved in on average (years ago)
Renter moved in on average (years ago)
Year householder moved into unit - Moved in 1999 to March 2000 (%)
Year householder moved into unit - Moved in 1995 to 1998 (%)
Year householder moved into unit - Moved in 1990 to 1994 (%)
Year householder moved into unit - Moved in 1980 to 1989 (%)
Year householder moved into unit - Moved in 1970 to 1979 (%)
Year householder moved into unit - Moved in 1969 or earlier (%)
Means of transportation to work - Drove car alone (%)
Means of transportation to work - Carpooled (%)
Means of transportation to work - Public transportation (%)
Means of transportation to work - Bus or trolley bus (%)
Means of transportation to work - Streetcar or trolley car (%)
Means of transportation to work - Subway or elevated (%)
Means of transportation to work - Railroad (%)
Means of transportation to work - Ferryboat (%)
Means of transportation to work - Taxicab (%)
Means of transportation to work - Motorcycle (%)
Means of transportation to work - Bicycle (%)
Means of transportation to work - Walked (%)
Means of transportation to work - Other means (%)
Working at home (%)
Industry diversity
Most Common Industries - Agriculture, forestry, fishing and hunting, and mining (%)
Most Common Industries - Agriculture, forestry, fishing and hunting (%)
Most Common Industries - Mining, quarrying, and oil and gas extraction (%)
Most Common Industries - Construction (%)
Most Common Industries - Manufacturing (%)
Most Common Industries - Wholesale trade (%)
Most Common Industries - Retail trade (%)
Most Common Industries - Transportation and warehousing, and utilities (%)
Most Common Industries - Transportation and warehousing (%)
Most Common Industries - Utilities (%)
Most Common Industries - Information (%)
Most Common Industries - Finance and insurance, and real estate and rental and leasing (%)
Most Common Industries - Finance and insurance (%)
Most Common Industries - Real estate and rental and leasing (%)
Most Common Industries - Professional, scientific, and management, and administrative and waste management services (%)
Most Common Industries - Professional, scientific, and technical services (%)
Most Common Industries - Management of companies and enterprises (%)
Most Common Industries - Administrative and support and waste management services (%)
Most Common Industries - Educational services, and health care and social assistance (%)
Most Common Industries - Educational services (%)
Most Common Industries - Health care and social assistance (%)
Most Common Industries - Arts, entertainment, and recreation, and accommodation and food services (%)
Most Common Industries - Arts, entertainment, and recreation (%)
Most Common Industries - Accommodation and food services (%)
Most Common Industries - Other services, except public administration (%)
Most Common Industries - Public administration (%)
Occupation diversity
Most Common Occupations - Management, business, science, and arts occupations (%)
Most Common Occupations - Management, business, and financial occupations (%)
Most Common Occupations - Management occupations (%)
Most Common Occupations - Business and financial operations occupations (%)
Most Common Occupations - Computer, engineering, and science occupations (%)
Most Common Occupations - Computer and mathematical occupations (%)
Most Common Occupations - Architecture and engineering occupations (%)
Most Common Occupations - Life, physical, and social science occupations (%)
Most Common Occupations - Education, legal, community service, arts, and media occupations (%)
Most Common Occupations - Community and social service occupations (%)
Most Common Occupations - Legal occupations (%)
Most Common Occupations - Education, training, and library occupations (%)
Most Common Occupations - Arts, design, entertainment, sports, and media occupations (%)
Most Common Occupations - Healthcare practitioners and technical occupations (%)
Most Common Occupations - Health diagnosing and treating practitioners and other technical occupations (%)
Most Common Occupations - Health technologists and technicians (%)
Most Common Occupations - Service occupations (%)
Most Common Occupations - Healthcare support occupations (%)
Most Common Occupations - Protective service occupations (%)
Most Common Occupations - Fire fighting and prevention, and other protective service workers including supervisors (%)
Most Common Occupations - Law enforcement workers including supervisors (%)
Most Common Occupations - Food preparation and serving related occupations (%)
Most Common Occupations - Building and grounds cleaning and maintenance occupations (%)
Most Common Occupations - Personal care and service occupations (%)
Most Common Occupations - Sales and office occupations (%)
Most Common Occupations - Sales and related occupations (%)
Most Common Occupations - Office and administrative support occupations (%)
Most Common Occupations - Natural resources, construction, and maintenance occupations (%)
Most Common Occupations - Farming, fishing, and forestry occupations (%)
Most Common Occupations - Construction and extraction occupations (%)
Most Common Occupations - Installation, maintenance, and repair occupations (%)
Most Common Occupations - Production, transportation, and material moving occupations (%)
Most Common Occupations - Production occupations (%)
Most Common Occupations - Transportation occupations (%)
Most Common Occupations - Material moving occupations (%)
People in Group quarters - Institutionalized population (%)
People in Group quarters - Correctional institutions (%)
People in Group quarters - Federal prisons and detention centers (%)
People in Group quarters - Halfway houses (%)
People in Group quarters - Local jails and other confinement facilities (including police lockups) (%)
People in Group quarters - Military disciplinary barracks (%)
People in Group quarters - State prisons (%)
People in Group quarters - Other types of correctional institutions (%)
People in Group quarters - Nursing homes (%)
People in Group quarters - Hospitals/wards, hospices, and schools for the handicapped (%)
People in Group quarters - Hospitals/wards and hospices for chronically ill (%)
People in Group quarters - Hospices or homes for chronically ill (%)
People in Group quarters - Military hospitals or wards for chronically ill (%)
People in Group quarters - Other hospitals or wards for chronically ill (%)
People in Group quarters - Hospitals or wards for drug/alcohol abuse (%)
People in Group quarters - Mental (Psychiatric) hospitals or wards (%)
People in Group quarters - Schools, hospitals, or wards for the mentally retarded (%)
People in Group quarters - Schools, hospitals, or wards for the physically handicapped (%)
People in Group quarters - Institutions for the deaf (%)
People in Group quarters - Institutions for the blind (%)
People in Group quarters - Orthopedic wards and institutions for the physically handicapped (%)
People in Group quarters - Wards in general hospitals for patients who have no usual home elsewhere (%)
People in Group quarters - Wards in military hospitals for patients who have no usual home elsewhere (%)
People in Group quarters - Juvenile institutions (%)
People in Group quarters - Long-term care (%)
People in Group quarters - Homes for abused, dependent, and neglected children (%)
People in Group quarters - Residential treatment centers for emotionally disturbed children (%)
People in Group quarters - Training schools for juvenile delinquents (%)
People in Group quarters - Short-term care, detention or diagnostic centers for delinquent children (%)
People in Group quarters - Type of juvenile institution unknown (%)
People in Group quarters - Noninstitutionalized population (%)
People in Group quarters - College dormitories (includes college quarters off campus) (%)
People in Group quarters - Military quarters (%)
People in Group quarters - On base (%)
People in Group quarters - Barracks, unaccompanied personnel housing (UPH), (Enlisted/Officer), ;and similar group living quarters for military personnel (%)
People in Group quarters - Transient quarters for temporary residents (%)
People in Group quarters - Military ships (%)
People in Group quarters - Group homes (%)
People in Group quarters - Homes or halfway houses for drug/alcohol abuse (%)
People in Group quarters - Homes for the mentally ill (%)
People in Group quarters - Homes for the mentally retarded (%)
People in Group quarters - Homes for the physically handicapped (%)
People in Group quarters - Other group homes (%)
People in Group quarters - Religious group quarters (%)
People in Group quarters - Dormitories (%)
People in Group quarters - Agriculture workers' dormitories on farms (%)
People in Group quarters - Job Corps and vocational training facilities (%)
People in Group quarters - Other workers' dormitories (%)
People in Group quarters - Crews of maritime vessels (%)
People in Group quarters - Other nonhousehold living situations (%)
People in Group quarters - Other noninstitutional group quarters (%)
Residents speaking English at home (%)
Residents speaking English at home - Born in the United States (%)
Residents speaking English at home - Native, born elsewhere (%)
Residents speaking English at home - Foreign born (%)
Residents speaking Spanish at home (%)
Residents speaking Spanish at home - Born in the United States (%)
Residents speaking Spanish at home - Native, born elsewhere (%)
Residents speaking Spanish at home - Foreign born (%)
Residents speaking other language at home (%)
Residents speaking other language at home - Born in the United States (%)
Residents speaking other language at home - Native, born elsewhere (%)
Residents speaking other language at home - Foreign born (%)
Class of Workers - Employee of private company (%)
Class of Workers - Self-employed in own incorporated business (%)
Class of Workers - Private not-for-profit wage and salary workers (%)
Class of Workers - Local government workers (%)
Class of Workers - State government workers (%)
Class of Workers - Federal government workers (%)
Class of Workers - Self-employed workers in own not incorporated business and Unpaid family workers (%)
House heating fuel used in houses and condos - Utility gas (%)
House heating fuel used in houses and condos - Bottled, tank, or LP gas (%)
House heating fuel used in houses and condos - Electricity (%)
House heating fuel used in houses and condos - Fuel oil, kerosene, etc. (%)
House heating fuel used in houses and condos - Coal or coke (%)
House heating fuel used in houses and condos - Wood (%)
House heating fuel used in houses and condos - Solar energy (%)
House heating fuel used in houses and condos - Other fuel (%)
House heating fuel used in houses and condos - No fuel used (%)
House heating fuel used in apartments - Utility gas (%)
House heating fuel used in apartments - Bottled, tank, or LP gas (%)
House heating fuel used in apartments - Electricity (%)
House heating fuel used in apartments - Fuel oil, kerosene, etc. (%)
House heating fuel used in apartments - Coal or coke (%)
House heating fuel used in apartments - Wood (%)
House heating fuel used in apartments - Solar energy (%)
House heating fuel used in apartments - Other fuel (%)
House heating fuel used in apartments - No fuel used (%)
Armed forces status - In Armed Forces (%)
Armed forces status - Civilian (%)
Armed forces status - Civilian - Veteran (%)
Armed forces status - Civilian - Nonveteran (%)
Fatal accidents locations in years 2005-2021
Fatal accidents locations in 2005
Fatal accidents locations in 2006
Fatal accidents locations in 2007
Fatal accidents locations in 2008
Fatal accidents locations in 2009
Fatal accidents locations in 2010
Fatal accidents locations in 2011
Fatal accidents locations in 2012
Fatal accidents locations in 2013
Fatal accidents locations in 2014
Fatal accidents locations in 2015
Fatal accidents locations in 2016
Fatal accidents locations in 2017
Fatal accidents locations in 2018
Fatal accidents locations in 2019
Fatal accidents locations in 2020
Fatal accidents locations in 2021
Alcohol use - People drinking some alcohol every month (%)
Alcohol use - People not drinking at all (%)
Alcohol use - Average days/month drinking alcohol
Alcohol use - Average drinks/week
Alcohol use - Average days/year people drink much
Audiometry - Average condition of hearing (%)
Audiometry - People that can hear a whisper from across a quiet room (%)
Audiometry - People that can hear normal voice from across a quiet room (%)
Audiometry - Ears ringing, roaring, buzzing (%)
Audiometry - Had a job exposure to loud noise (%)
Audiometry - Had off-work exposure to loud noise (%)
Blood Pressure & Cholesterol - Has high blood pressure (%)
Blood Pressure & Cholesterol - Checking blood pressure at home (%)
Blood Pressure & Cholesterol - Frequently checking blood cholesterol (%)
Blood Pressure & Cholesterol - Has high cholesterol level (%)
Consumer Behavior - Money monthly spent on food at supermarket/grocery store
Consumer Behavior - Money monthly spent on food at other stores
Consumer Behavior - Money monthly spent on eating out
Consumer Behavior - Money monthly spent on carryout/delivered foods
Consumer Behavior - Income spent on food at supermarket/grocery store (%)
Consumer Behavior - Income spent on food at other stores (%)
Consumer Behavior - Income spent on eating out (%)
Consumer Behavior - Income spent on carryout/delivered foods (%)
Current Health Status - General health condition (%)
Current Health Status - Blood donors (%)
Current Health Status - Has blood ever tested for HIV virus (%)
Current Health Status - Left-handed people (%)
Dermatology - People using sunscreen (%)
Diabetes - Diabetics (%)
Diabetes - Had a blood test for high blood sugar (%)
Diabetes - People taking insulin (%)
Diet Behavior & Nutrition - Diet health (%)
Diet Behavior & Nutrition - Milk product consumption (# of products/month)
Diet Behavior & Nutrition - Meals not home prepared (#/week)
Diet Behavior & Nutrition - Meals from fast food or pizza place (#/week)
Diet Behavior & Nutrition - Ready-to-eat foods (#/month)
Diet Behavior & Nutrition - Frozen meals/pizza (#/month)
Drug Use - People that ever used marijuana or hashish (%)
Drug Use - Ever used hard drugs (%)
Drug Use - Ever used any form of cocaine (%)
Drug Use - Ever used heroin (%)
Drug Use - Ever used methamphetamine (%)
Health Insurance - People covered by health insurance (%)
Kidney Conditions-Urology - Avg. # of times urinating at night
Medical Conditions - People with asthma (%)
Medical Conditions - People with anemia (%)
Medical Conditions - People with psoriasis (%)
Medical Conditions - People with overweight (%)
Medical Conditions - Elderly people having difficulties in thinking or remembering (%)
Medical Conditions - People who ever received blood transfusion (%)
Medical Conditions - People having trouble seeing even with glass/contacts (%)
Medical Conditions - People with arthritis (%)
Medical Conditions - People with gout (%)
Medical Conditions - People with congestive heart failure (%)
Medical Conditions - People with coronary heart disease (%)
Medical Conditions - People with angina pectoris (%)
Medical Conditions - People who ever had heart attack (%)
Medical Conditions - People who ever had stroke (%)
Medical Conditions - People with emphysema (%)
Medical Conditions - People with thyroid problem (%)
Medical Conditions - People with chronic bronchitis (%)
Medical Conditions - People with any liver condition (%)
Medical Conditions - People who ever had cancer or malignancy (%)
Mental Health - People who have little interest in doing things (%)
Mental Health - People feeling down, depressed, or hopeless (%)
Mental Health - People who have trouble sleeping or sleeping too much (%)
Mental Health - People feeling tired or having little energy (%)
Mental Health - People with poor appetite or overeating (%)
Mental Health - People feeling bad about themself (%)
Mental Health - People who have trouble concentrating on things (%)
Mental Health - People moving or speaking slowly or too fast (%)
Mental Health - People having thoughts they would be better off dead (%)
Oral Health - Average years since last visit a dentist
Oral Health - People embarrassed because of mouth (%)
Oral Health - People with gum disease (%)
Oral Health - General health of teeth and gums (%)
Oral Health - Average days a week using dental floss/device
Oral Health - Average days a week using mouthwash for dental problem
Oral Health - Average number of teeth
Pesticide Use - Households using pesticides to control insects (%)
Pesticide Use - Households using pesticides to kill weeds (%)
Physical Activity - People doing vigorous-intensity work activities (%)
Physical Activity - People doing moderate-intensity work activities (%)
Physical Activity - People walking or bicycling (%)
Physical Activity - People doing vigorous-intensity recreational activities (%)
Physical Activity - People doing moderate-intensity recreational activities (%)
Physical Activity - Average hours a day doing sedentary activities
Physical Activity - Average hours a day watching TV or videos
Physical Activity - Average hours a day using computer
Physical Functioning - People having limitations keeping them from working (%)
Physical Functioning - People limited in amount of work they can do (%)
Physical Functioning - People that need special equipment to walk (%)
Physical Functioning - People experiencing confusion/memory problems (%)
Physical Functioning - People requiring special healthcare equipment (%)
Prescription Medications - Average number of prescription medicines taking
Preventive Aspirin Use - Adults 40+ taking low-dose aspirin (%)
Reproductive Health - Vaginal deliveries (%)
Reproductive Health - Cesarean deliveries (%)
Reproductive Health - Deliveries resulted in a live birth (%)
Reproductive Health - Pregnancies resulted in a delivery (%)
Reproductive Health - Women breastfeeding newborns (%)
Reproductive Health - Women that had a hysterectomy (%)
Reproductive Health - Women that had both ovaries removed (%)
Reproductive Health - Women that have ever taken birth control pills (%)
Reproductive Health - Women taking birth control pills (%)
Reproductive Health - Women that have ever used Depo-Provera or injectables (%)
Reproductive Health - Women that have ever used female hormones (%)
Sexual Behavior - People 18+ that ever had sex (vaginal, anal, or oral) (%)
Sexual Behavior - Males 18+ that ever had vaginal sex with a woman (%)
Sexual Behavior - Males 18+ that ever performed oral sex on a woman (%)
Sexual Behavior - Males 18+ that ever had anal sex with a woman (%)
Sexual Behavior - Males 18+ that ever had any sex with a man (%)
Sexual Behavior - Females 18+ that ever had vaginal sex with a man (%)
Sexual Behavior - Females 18+ that ever performed oral sex on a man (%)
Sexual Behavior - Females 18+ that ever had anal sex with a man (%)
Sexual Behavior - Females 18+ that ever had any kind of sex with a woman (%)
Sexual Behavior - Average age people first had sex
Sexual Behavior - Average number of female sex partners in lifetime (males 18+)
Sexual Behavior - Average number of female vaginal sex partners in lifetime (males 18+)
Sexual Behavior - Average age people first performed oral sex on a woman (18+)
Sexual Behavior - Average number of woman performed oral sex on in lifetime (18+)
Sexual Behavior - Average number of male sex partners in lifetime (males 18+)
Sexual Behavior - Average number of male anal sex partners in lifetime (males 18+)
Sexual Behavior - Average age people first performed oral sex on a man (18+)
Sexual Behavior - Average number of male oral sex partners in lifetime (18+)
Sexual Behavior - People using protection when performing oral sex (%)
Sexual Behavior - Average number of times people have vaginal or anal sex a year
Sexual Behavior - People having sex without condom (%)
Sexual Behavior - Average number of male sex partners in lifetime (females 18+)
Sexual Behavior - Average number of male vaginal sex partners in lifetime (females 18+)
Sexual Behavior - Average number of female sex partners in lifetime (females 18+)
Sexual Behavior - Circumcised males 18+ (%)
Sleep Disorders - Average hours sleeping at night
Sleep Disorders - People that has trouble sleeping (%)
Smoking-Cigarette Use - People smoking cigarettes (%)
Taste & Smell - People 40+ having problems with smell (%)
Taste & Smell - People 40+ having problems with taste (%)
Taste & Smell - People 40+ that ever had wisdom teeth removed (%)
Taste & Smell - People 40+ that ever had tonsils teeth removed (%)
Taste & Smell - People 40+ that ever had a loss of consciousness because of a head injury (%)
Taste & Smell - People 40+ that ever had a broken nose or other serious injury to face or skull (%)
Taste & Smell - People 40+ that ever had two or more sinus infections (%)
Weight - Average height (inches)
Weight - Average weight (pounds)
Weight - Average BMI
Weight - People that are obese (%)
Weight - People that ever were obese (%)
Weight - People trying to lose weight (%)
Urban population: 3,970
Rural population: 7,957
Estimated median house/condo value in 2022: $334,377
45068:
$334,377Ohio:
$204,100
According to our research of Ohio and other state lists, there were 8 registered sex offenders living in 45068 zip code as of April 19, 2024 . The ratio of all residents to sex offenders in zip code 45068 is 1,392 to 1.The ratio of registered sex offenders to all residents in this zip code is much lower than the state average.
Median resident age: This zip code:
45.2 yearsOhio median age:
39.9 years
Average household size: This zip code:
2.5 peopleOhio:
2.4 people
Averages for the 2020 tax year for zip code 45068, filed in 2021:
Average Adjusted Gross Income (AGI) in 2020: $99,111 (Individual Income Tax Returns) Here:
$99,111State:
$67,288
Salary/wage: $82,688 (reported on 81.5% of returns )Here:
$82,688State:
$55,628
(% of AGI for various income ranges: 1131.8% for AGIs below $25k , 3325.6% for AGIs $25k-50k , 6395.1% for AGIs $50k-75k , 9918.0% for AGIs $75k-100k , 19562.7% for AGIs $100k-200k , 75974.2% for AGIs over 200k ) Taxable interest for individuals: $1,252 (reported on 41.9% of returns )This zip code:
$1,252Ohio:
$1,518
(% of AGI for various income ranges: 13.7% for AGIs below $25k , 31.7% for AGIs $25k-50k , 77.9% for AGIs $50k-75k , 57.1% for AGIs $75k-100k , 126.0% for AGIs $100k-200k , 602.6% for AGIs over 200k ) Ordinary dividends: $5,927 (reported on 25.4% of returns )(% of AGI for various income ranges: 34.1% for AGIs below $25k , 55.8% for AGIs $25k-50k , 91.3% for AGIs $50k-75k , 259.8% for AGIs $75k-100k , 340.7% for AGIs $100k-200k , 2143.2% for AGIs over 200k ) Net capital gain/loss in AGI: +$20,364 (reported on 22.6% of returns )Here:
+$20,364State:
+$18,919
(% of AGI for various income ranges: 20.3% for AGIs below $25k , 40.6% for AGIs $25k-50k , 98.1% for AGIs $50k-75k , 145.4% for AGIs $75k-100k , 607.6% for AGIs $100k-200k , 11051.6% for AGIs over 200k ) Profit/loss from business: +$22,462 (reported on 17.5% of returns )Here:
+$22,462State:
+$13,744
(% of AGI for various income ranges: 128.5% for AGIs below $25k , 218.2% for AGIs $25k-50k , 336.8% for AGIs $50k-75k , 342.4% for AGIs $75k-100k , 783.3% for AGIs $100k-200k , 5942.6% for AGIs over 200k ) Taxable individual retirement arrangement distribution: $22,582 (reported on 10.3% of returns )45068:
$22,582Ohio:
$18,876
(% of AGI for various income ranges: 65.4% for AGIs below $25k , 162.6% for AGIs $25k-50k , 320.4% for AGIs $50k-75k , 357.8% for AGIs $75k-100k , 621.4% for AGIs $100k-200k , 2174.7% for AGIs over 200k ) Self-employed (Keogh) retirement plans: $26,233 (reported on 1.0% of returns )45068:
$26,233Ohio:
$24,898
(% of AGI for various income ranges: 74.3% for AGIs $100k-200k , 554.7% for AGIs over 200k ) Total itemized deductions: $33,503 (reported on 11.5% of returns )Here:
$33,503State:
$33,869
(% of AGI for various income ranges: 220.5% for AGIs $25k-50k , 278.7% for AGIs $50k-75k , 439.5% for AGIs $75k-100k , 897.4% for AGIs $100k-200k , 5876.8% for AGIs over 200k ) Charity contributions: $12,621 (reported on 9.1% of returns )Here:
$12,621State:
$14,577
(% of AGI for various income ranges: 17.2% for AGIs $25k-50k , 39.1% for AGIs $50k-75k , 47.8% for AGIs $75k-100k , 232.4% for AGIs $100k-200k , 2381.6% for AGIs over 200k ) Taxes paid: $8,221 (reported on 11.5% of returns )(% of AGI for various income ranges: 31.3% for AGIs $25k-50k , 60.8% for AGIs $50k-75k , 124.6% for AGIs $75k-100k , 277.0% for AGIs $100k-200k , 1311.6% for AGIs over 200k ) Earned income credit: $2,007 (reported on 7.9% of returns )(% of AGI for various income ranges: 53.4% for AGIs below $25k , 51.9% for AGIs $25k-50k ) Percentage of individuals using paid preparers for their 2020 taxes: 93.8%(% for various income ranges: 92.6% for AGIs below $25k , 94.3% for AGIs $25k-50k , 94.9% for AGIs $50k-75k , 92.2% for AGIs $75k-100k , 94.5% for AGIs $100k-200k , 94.9% for AGIs over 200k )
Averages for the 2012 tax year for zip code 45068, filed in 2013:
Average Adjusted Gross Income (AGI) in 2012: $68,223 (Individual Income Tax Returns) Here:
$68,223State:
$54,926
Salary/wage: $59,578 (reported on 82.8% of returns )Here:
$59,578State:
$45,869
(% of AGI for various income ranges: 68.1% for AGIs below $25k , 71.1% for AGIs $25k-50k , 74.5% for AGIs $50k-75k , 76.4% for AGIs $75k-100k , 80.6% for AGIs $100k-200k , 59.1% for AGIs over 200k ) Taxable interest for individuals: $1,364 (reported on 39.8% of returns )This zip code:
$1,364Ohio:
$1,297
(% of AGI for various income ranges: 1.4% for AGIs below $25k , 0.4% for AGIs $25k-50k , 1.0% for AGIs $50k-75k , 0.4% for AGIs $75k-100k , 0.7% for AGIs $100k-200k , 1.0% for AGIs over 200k ) Ordinary dividends: $4,737 (reported on 23.5% of returns )(% of AGI for various income ranges: 1.3% for AGIs below $25k , 0.8% for AGIs $25k-50k , 1.2% for AGIs $50k-75k , 1.0% for AGIs $75k-100k , 1.5% for AGIs $100k-200k , 2.9% for AGIs over 200k ) Net capital gain/loss in AGI: +$7,256 (reported on 18.4% of returns )Here:
+$7,256State:
+$11,232
(% of AGI for various income ranges: 0.2% for AGIs $25k-50k , 0.8% for AGIs $50k-75k , 0.9% for AGIs $75k-100k , 1.7% for AGIs $100k-200k , 4.8% for AGIs over 200k ) Profit/loss from business: +$16,679 (reported on 18.2% of returns )Here:
+$16,679State:
+$12,773
(% of AGI for various income ranges: 8.6% for AGIs below $25k , 3.5% for AGIs $25k-50k , 3.4% for AGIs $50k-75k , 3.5% for AGIs $75k-100k , 3.5% for AGIs $100k-200k , 6.3% for AGIs over 200k ) Taxable individual retirement arrangement distribution: $16,264 (reported on 10.6% of returns )45068:
$16,264Ohio:
$14,511
(% of AGI for various income ranges: 4.0% for AGIs below $25k , 2.7% for AGIs $25k-50k , 2.6% for AGIs $50k-75k , 3.4% for AGIs $75k-100k , 2.1% for AGIs $100k-200k , 2.1% for AGIs over 200k ) Self-employment retirement plans: $16,325 (reported on 0.8% of returns )45068:
$16,325Ohio:
$20,257
(% of AGI for various income ranges: 0.6% for AGIs $100k-200k ) Total itemized deductions: $22,624 (20% of AGI, reported on 43.8% of returns )Here:
$22,624State:
$21,278
Here:
19.6% of AGIState:
18.8% of AGI
(% of AGI for various income ranges: 11.1% for AGIs below $25k , 11.0% for AGIs $25k-50k , 14.2% for AGIs $50k-75k , 15.6% for AGIs $75k-100k , 17.1% for AGIs $100k-200k , 13.1% for AGIs over 200k ) Charity contributions: $3,677 (reported on 34.3% of returns )(% of AGI for various income ranges: 0.9% for AGIs below $25k , 1.0% for AGIs $25k-50k , 1.6% for AGIs $50k-75k , 1.8% for AGIs $75k-100k , 2.3% for AGIs $100k-200k , 2.1% for AGIs over 200k ) Taxes paid: $9,507 (reported on 43.6% of returns )(% of AGI for various income ranges: 2.2% for AGIs below $25k , 3.2% for AGIs $25k-50k , 4.6% for AGIs $50k-75k , 6.2% for AGIs $75k-100k , 7.4% for AGIs $100k-200k , 7.3% for AGIs over 200k ) Earned income credit: $1,923 (reported on 10.6% of returns )(% of AGI for various income ranges: 3.8% for AGIs below $25k , 0.8% for AGIs $25k-50k ) Percentage of individuals using paid preparers for their 2012 taxes: 50.8%(% for various income ranges: 41.5% for AGIs below $25k , 56.0% for AGIs $25k-50k , 55.8% for AGIs $50k-75k , 56.1% for AGIs $75k-100k , 48.8% for AGIs $100k-200k , 73.9% for AGIs over 200k )
Averages for the 2004 tax year for zip code 45068, filed in 2005:
Average Adjusted Gross Income (AGI) in 2004: $51,459 (Individual Income Tax Returns) Here:
$51,459State:
$44,480
Salary/wage: $44,050 (reported on 86.9% of returns )Here:
$44,050State:
$39,198
(% of AGI for various income ranges: 154.1% for AGIs below $10k , 69.4% for AGIs $10k-25k , 77.9% for AGIs $25k-50k , 82.3% for AGIs $50k-75k , 84.6% for AGIs $75k-100k , 62.5% for AGIs over 100k ) Taxable interest for individuals: $1,644 (reported on 47.7% of returns )This zip code:
$1,644Ohio:
$1,532
(% of AGI for various income ranges: 8.7% for AGIs below $10k , 2.8% for AGIs $10k-25k , 1.1% for AGIs $25k-50k , 0.8% for AGIs $50k-75k , 0.7% for AGIs $75k-100k , 2.1% for AGIs over 100k ) Taxable dividends: $3,681 (reported on 25.7% of returns )(% of AGI for various income ranges: 3.1% for AGIs below $10k , 1.2% for AGIs $10k-25k , 0.7% for AGIs $25k-50k , 1.2% for AGIs $50k-75k , 1.1% for AGIs $75k-100k , 3.1% for AGIs over 100k ) Net capital gain/loss: +$10,646 (reported on 20.1% of returns )Here:
+$10,646State:
+$8,582
(% of AGI for various income ranges: -1.7% for AGIs below $10k , 0.4% for AGIs $10k-25k , 0.5% for AGIs $25k-50k , 0.9% for AGIs $50k-75k , 1.3% for AGIs $75k-100k , 9.8% for AGIs over 100k ) Profit/loss from business: +$12,184 (reported on 17.4% of returns )Here:
+$12,184State:
+$10,813
(% of AGI for various income ranges: 10.9% for AGIs below $10k , 6.1% for AGIs $10k-25k , 4.4% for AGIs $25k-50k , 3.0% for AGIs $50k-75k , 1.7% for AGIs $75k-100k , 5.2% for AGIs over 100k ) IRA payment deduction: $3,095 (reported on 2.3% of returns )(% of AGI for various income ranges: 0.3% for AGIs $10k-25k , 0.2% for AGIs $25k-50k , 0.2% for AGIs $50k-75k , 0.1% for AGIs $75k-100k , 0.1% for AGIs over 100k ) Self-employed pension: $12,967 (reported on 0.7% of returns )Total itemized deductions: $18,451 (22% of AGI, reported on 45.0% of returns )Here:
$18,451State:
$17,503
Here:
21.9% of AGIState:
20.8% of AGI
(% of AGI for various income ranges: 13.2% for AGIs below $10k , 12.7% for AGIs $10k-25k , 14.6% for AGIs $25k-50k , 17.1% for AGIs $50k-75k , 17.8% for AGIs $75k-100k , 16.2% for AGIs over 100k ) Charity contributions deductions: $3,037 (3% of AGI, reported on 36.2% of returns )Here:
3.4% of AGIState:
3.4% of AGI
(% of AGI for various income ranges: 0.6% for AGIs below $10k , 1.2% for AGIs $10k-25k , 1.4% for AGIs $25k-50k , 1.8% for AGIs $50k-75k , 2.3% for AGIs $75k-100k , 2.8% for AGIs over 100k ) Total tax: $7,369 (reported on 80.7% of returns )(% of AGI for various income ranges: 5.5% for AGIs below $10k , 4.8% for AGIs $10k-25k , 7.5% for AGIs $25k-50k , 9.0% for AGIs $50k-75k , 10.2% for AGIs $75k-100k , 16.8% for AGIs over 100k ) Earned income credit: $1,567 (reported on 7.8% of returns )Percentage of individuals using paid preparers for their 2004 taxes: 51.5%(% for various income ranges: 35.2% for AGIs below $10k , 51.9% for AGIs $10k-25k , 58.7% for AGIs $25k-50k , 54.9% for AGIs $50k-75k , 50.3% for AGIs $75k-100k , 57.9% for AGIs over 100k )
Estimated median household income in 2022: This zip code:
$88,205Ohio:
$65,720
Nearest zip codes: 45032 ,
45054 ,
45370 ,
45305 ,
45458 ,
45113 .
Harveysburg Zip Code Map
Percentage of family households: This zip code:
53.3%Ohio:
43.3%
Percentage of households with unmarried partners: This zip code:
3.4%Ohio:
44.6%
Likely homosexual households (counted as self-reported same-sex unmarried-partner households)
Lesbian couples: 0.2% of all households Gay men: 0.5% of all households
Household received Food Stamps/SNAP in the past 12 months: 103Household did not receive Food Stamps/SNAP in the past 12 months: 4,569
Women who had a birth in the past 12 months: 28 (29 now married , 0 unmarried) Women who did not have a birth in the past 12 months: 2,359 (1,296 now married , 1,061 unmarried)
Housing units in zip code 45068 with a mortgage: 2,737 (332
second mortgage , 11
home equity loan , 300
both second mortgage and home equity loan )
Houses without a mortgage: 189
Median monthly owner costs for units with a mortgage: $1,820
Median monthly owner costs for units without a mortgage: $671
Residents with income below the poverty level in 2022:
This zip code:
5.1%Whole state:
13.4%
Residents with income below 50% of the poverty level in 2022:
This zip code:
0.6%Whole state:
7.0%
Median number of rooms in houses and condos: Median number of rooms in apartments: Notable locations in this zip code not listed on our city pages
Click to draw/clear zip code borders Notable locations in zip code 45068: (A) , Camp Stonybrook (B) , Wayne Township Fire and Emergency Medical Services Station 91 (C) , Massie Township Fire and Emergency Medical Services Department (D) . Display/hide their locations on the map
Churches in zip code 45068 include: (A) , Corwin Pentecostal Church (B) , Saint Marys Episcopal Church (C) , Waynesville Methodist Church (D) , Lytle Methodist Church (E) . Display/hide their locations on the map
Cemeteries: (1) , Miami Cemetery (2) , Miami Valley Memorial Garden (3) , Mount Holly Cemetery (4) , Brannock Cemetery (5) , Caesars Creek Cemetery (6) , Lytle Cemetery (7) . Display/hide their locations on the map
Reservoirs: (A) , Spring Valley Lake (B) , Glass Pond (C) , Poore Pond (D) , Stoneybrook Farm Lake (E) , Old Stage Farms Lake (F) , Stolle Lake (G) . Display/hide their locations on the map
Streams, rivers, and creeks: (A) , Knoll Brook (B) , Gum Run (C) , Flat Fork (D) , Dakins Run (E) , Jonahs Run (F) , Harlans Run (G) , Cooks Run (H) , Turkey Run (I) . Display/hide their locations on the map
Parks in zip code 45068 include: (1) , Caesar Creek Gorge State Natural Area (2) , Spring Valley Wildlife Area (3) . Display/hide their locations on the map
Year house built (houses)
11 2020 or later363 2010 to 2019975 2000 to 2009912 1990 to 1999398 1980 to 1989449 1970 to 1979425 1960 to 1969316 1950 to 1959163 1940 to 1949835 1939 or earlier
Zip code 45068 household income distribution in 2022 109 Less than $10,000159 $10,000 to $14,999146 $15,000 to $19,99973 $20,000 to $24,99974 $25,000 to $29,99960 $30,000 to $34,99993 $35,000 to $39,999144 $40,000 to $44,999211 $45,000 to $49,999286 $50,000 to $59,999607 $60,000 to $74,999632 $75,000 to $99,999310 $100,000 to $124,999214 $125,000 to $149,999566 $150,000 to $199,999986 $200,000 or moreEstimate of home value of owner-occupied houses/condos in 2022 in zip code 45068 51 Less than $10,00027 $15,000 to $19,9991 $20,000 to $24,9994 $30,000 to $34,9998 $35,000 to $39,99925 $50,000 to $59,9994 $60,000 to $69,99936 $70,000 to $79,99948 $80,000 to $89,99999 $100,000 to $124,999161 $125,000 to $149,999274 $150,000 to $174,999179 $175,000 to $199,999603 $200,000 to $249,999346 $250,000 to $299,999852 $300,000 to $399,999491 $400,000 to $499,999841 $500,000 to $749,99990 $750,000 to $999,999156 $1,000,000 to $1,499,9996 $2,000,000 or moreRent paid by renters in 2022 in zip code 45068 8 $150 to $1998 $200 to $2492 $250 to $29957 $300 to $3494 $400 to $44915 $450 to $49918 $550 to $59993 $600 to $64931 $700 to $74964 $750 to $79962 $800 to $89918 $900 to $999189 $1,000 to $1,24968 $1,250 to $1,499153 $2,500 to $2,99937 No cash rent
Median gross rent in 2022: $1,238.
Estimated median house (or condo) value in 2022 for: White Non-Hispanic householders: $316,706Asian householders: $622,991Some other race householders: $101,944Two or more races householders: $283,178Hispanic or Latino householders: $111,911Estimated median house or condo value in 2022: $334,377
45068:
$334,377Ohio:
$204,100
Lower value quartile - upper value quartile: $210,262 - $530,284
Mean price in 2022: Detached houses: $362,713Here:
$362,713State:
$254,366
Townhouses or other attached units: $253,892Here:
$253,892State:
$225,733
In 2-unit structures: $238,913Here:
$238,913State:
$144,384
In 3-to-4-unit structures: $302,533Here:
$302,533State:
$203,002
In 5-or-more-unit structures: $364,360Here:
$364,360State:
$211,593
Mobile homes: $18,921Here:
$18,921State:
$62,719
Housing units in structures:
One, detached: 4,400One, attached: 68Two: 693 or 4: 1875 to 9: 310 to 19: 1520 to 49: 77Mobile homes: 26Unemployment : 2.5%
Means of transportation to work in zip code 45068 74.7% 4,553 Drove a car alone6.9% 422 Carpooled1.8% 112 Walked17.7% 1,081 Worked at homeTravel time to work (commute) in zip code 45068 196 Less than 5 minutes390 5 to 9 minutes452 10 to 14 minutes524 15 to 19 minutes697 20 to 24 minutes523 25 to 29 minutes1,109 30 to 34 minutes468 35 to 39 minutes206 40 to 44 minutes412 45 to 59 minutes80 60 to 89 minutes32 90 or more minutes
Percentage of zip code residents living and working in this county: 45.3%
Household type by relationship:
Households: 11,928
Male householders: 2,608 (498 living alone ), Female householders: 2,074 (431 living alone )2,995 spouses (2,995 opposite-sex spouses ), 208 unmarried partners , (208 opposite-sex unmarried partners ), 3,185 children (3,005 natural , 89 adopted , 94 stepchildren ), 192 grandchildren , 125 brothers or sisters , 220 parents , 0 foster children , 18 other relatives , 207 non-relatives In group quarters: 89 (-1 institutionalized population )
Size of family households: 1,766 2-persons , 697 3-persons , 506 4-persons , 355 5-persons , 87 6-persons , 83 7-or-more-persons
Size of nonfamily households: 927 1-person , 230 2-persons , 17 3-persons
2,163 married couples with children. single-parent households (123 men , 205 women ).
96.7% of residents of 45068 zip code speak English at home. of residents speak Spanish at home (100% well ).of residents speak other Indo-European language at home (100% very well ).of residents speak Asian or Pacific Island language at home (67% very well, 33% well ).of residents speak other language at home (100% very well ).
Foreign born population: 248 (2.1%)
(65.3%
of them are naturalized citizens )
This zip code:
2.1%Whole state:
5.0%
48% Bolivia 16% Japan 11% Norway 5% Taiwan 4% United Kingdom, excluding England and Scotland 4% Singapore 3% Sweden 26% English 25% German 13% American 8% Irish 4% Polish 3% Brazilian 3% European
Year of entry for the foreign-born population
104 2010 or later 66 2000 to 2009 13 1990 to 1999 207 Before 1990
Facilities with environmental interests located in this zip code:
AMERICAN AGGREGATES INC SPRING VALLEY PLANT * (2225 ROXANNA NEW BURLINGTON ROAD in WAYNESVILLE, OH)
AIR MINOR (AIRS/AFS) STATE MASTER (Ohio general info) - AIR MAJOR Business SIC classification: CRUSHED AND BROKEN STONEAlternative names: AMERICAN AGGREGATES CORPORATION
AEROTECH TRANSPARENCIES INC (184 N MAIN ST in CORWIN, OH)
Small Quantity Generators, between 100 kg and 1000 kg of hazardous waste/month (Resource Conservation and Recovery Act (tracking hazardous waste)) - notification Organizations: MAGINN VALERIE (CONTACT/OWNER)
, PURKEY PROPERTIES (CONTACT/OWNER)
BP OIL CO SITE 09340 (400 S MAIN ST in WAYNESVILLE, OH)
(Resource Conservation and Recovery Act (tracking hazardous waste)) Organizations: BP OIL COMPANY (CONTACT/OWNER)
Housing units lacking complete plumbing facilities: 1.4%
Housing units lacking complete kitchen facilities: 1.9%
39.1% Utility gas 28.2% Electricity 20.3% Bottled, tank, or LP gas 5.5% Other fuel 5.3% Wood 1.7% Fuel oil, kerosene, etc.
Population in 1990: 6,880. Population change in the 1990s: +2,057 (+29.9%).
Place of birth for U.S.-born residents:
This state: 8,623Northeast: 584Midwest: 987South: 905West: 413
61% of the 45068 zip code residents lived in the same house 5 years ago.
Out of people who lived in different houses, 46% lived in this county.
Out of people who lived in different counties, 50% lived in Ohio.
92% of the 45068 zip code residents lived in the same house 1 year ago.
Out of people who lived in different houses, 33% moved from this county.
Out of people who lived in different houses, 62% moved from different county within same state.
Out of people who lived in different houses, 9% moved from different state.
Private vs. public school enrollment:
Students in private schools in grades 1 to 8 (elementary and middle school): 182
Students in private schools in grades 9 to 12 (high school): 63
Students in private undergraduate colleges: 25
Occupation by median earnings in the past 12 months ($)
115,831 Life, physical, and social science occupations 115,474 Management occupations 98,357 Architecture and engineering occupations 90,106 Computer and mathematical occupations 87,549 Healthcare support occupations 81,793 Installation, maintenance, and repair occupations
Companies with federal contracts located in this zip code:
CASALCORP (10036 BELLBROOK ROAD in WAYNESVILLE, OH; small business)
$15,095 with Army for ADP Software. Signed on 2004-06-14. Completion date: 2004-06-30.
Top industries in this zip code by the number of employees in 2005:
Health Care and Social Assistance: Nursing Care Facilities (100-249 employees: 1 establishment)Accommodation and Food Services: Full-Service Restaurants (50-99: 1, 20-49: 1, 10-19: 1, 1-4: 1)Construction: Poured Concrete Foundation and Structure Contractors (50-99: 1, 1-4: 2)Accommodation and Food Services: Limited-Service Restaurants (20-49: 1, 10-19: 2, 1-4: 2)Construction: Plumbing, Heating, and Air-Conditioning Contractors (10-19: 1, 5-9: 2, 1-4: 4)Construction: New Single-Family Housing Construction (except Operative Builders) (10-19: 1, 5-9: 2, 1-4: 3)Other Services (except Public Administration): Religious Organizations (10-19: 1, 5-9: 2, 1-4: 3)
People in group quarters in 2010:
94 people in nursing facilities/skilled-nursing facilities
8 people in group homes intended for adults
People in group quarters in 2000:
93 people in nursing homes
17 people in homes for the mentally retarded
Fatal accident statistics in 2014:
Fatal accident count: 1Vehicles involved in fatal accidents: 3Fatal accidents caused by drunken drivers: 0Fatalities: 2Persons involved in fatal accidents: 4Pedestrians involved in fatal accidents: 0
Fatal accident statistics in 2013:
Fatal accident count: 1Vehicles involved in fatal accidents: 2Fatal accidents caused by drunken drivers: 0Fatalities: 1Persons involved in fatal accidents: 3Pedestrians involved in fatal accidents: 0
Home Mortgage Disclosure Act Aggregated Statistics For Year 2009(Based on 10 partial tracts) A) FHA, FSA/RHS & VA B) Conventional C) Refinancings D) Home Improvement Loans E) Loans on Dwellings For 5+ Families F) Non-occupant Loans on G) Loans On Manufactured Number Average Value Number Average Value Number Average Value Number Average Value Number Average Value Number Average Value Number Average Value
LOANS ORIGINATED 140 $192,629 215 $203,781 1,264 $197,826 30 $42,832 1 $3,200,980 37 $125,060 2 $117,525 APPLICATIONS APPROVED, NOT ACCEPTED 3 $151,533 12 $181,964 79 $207,875 5 $56,236 0 $0 3 $54,890 0 $0 APPLICATIONS DENIED 21 $184,576 25 $169,702 313 $230,659 19 $82,431 0 $0 11 $164,066 2 $223,285 APPLICATIONS WITHDRAWN 17 $178,701 18 $227,046 147 $206,046 5 $129,388 0 $0 2 $86,830 0 $0 FILES CLOSED FOR INCOMPLETENESS 9 $156,099 1 $364,420 30 $237,683 0 $0 0 $0 0 $0 0 $0
Aggregated Statistics For Year 2008(Based on 10 partial tracts) A) FHA, FSA/RHS & VA B) Conventional C) Refinancings D) Home Improvement Loans E) Loans on Dwellings For 5+ Families F) Non-occupant Loans on G) Loans On Manufactured Number Average Value Number Average Value Number Average Value Number Average Value Number Average Value Number Average Value Number Average Value
LOANS ORIGINATED 95 $185,408 302 $217,760 531 $202,099 46 $51,429 0 $0 31 $197,742 2 $107,825 APPLICATIONS APPROVED, NOT ACCEPTED 5 $116,410 25 $210,756 82 $184,241 5 $25,180 0 $0 10 $139,296 0 $0 APPLICATIONS DENIED 14 $129,423 53 $209,156 258 $178,751 34 $74,917 0 $0 20 $180,702 3 $30,580 APPLICATIONS WITHDRAWN 13 $230,255 36 $217,840 132 $199,858 8 $124,234 2 $574,430 6 $129,400 1 $40,000 FILES CLOSED FOR INCOMPLETENESS 2 $170,800 8 $264,620 20 $195,561 4 $51,528 0 $0 3 $120,863 0 $0
Aggregated Statistics For Year 2007(Based on 10 partial tracts) A) FHA, FSA/RHS & VA B) Conventional C) Refinancings D) Home Improvement Loans F) Non-occupant Loans on G) Loans On Manufactured Number Average Value Number Average Value Number Average Value Number Average Value Number Average Value Number Average Value
LOANS ORIGINATED 57 $186,901 527 $198,333 553 $178,635 74 $54,890 74 $119,804 2 $15,780 APPLICATIONS APPROVED, NOT ACCEPTED 1 $241,000 80 $192,410 86 $162,404 9 $122,967 12 $150,868 3 $76,903 APPLICATIONS DENIED 4 $148,915 70 $174,751 319 $181,974 46 $66,203 19 $180,523 4 $34,005 APPLICATIONS WITHDRAWN 4 $209,735 45 $201,447 143 $156,341 12 $46,649 10 $114,850 0 $0 FILES CLOSED FOR INCOMPLETENESS 0 $0 14 $171,100 50 $177,175 3 $153,690 6 $177,617 0 $0
Aggregated Statistics For Year 2006(Based on 10 partial tracts) A) FHA, FSA/RHS & VA B) Conventional C) Refinancings D) Home Improvement Loans F) Non-occupant Loans on G) Loans On Manufactured Number Average Value Number Average Value Number Average Value Number Average Value Number Average Value Number Average Value
LOANS ORIGINATED 47 $170,876 679 $190,302 581 $162,341 64 $49,982 46 $172,410 1 $45,330 APPLICATIONS APPROVED, NOT ACCEPTED 0 $0 67 $176,824 107 $161,373 18 $40,516 13 $122,120 0 $0 APPLICATIONS DENIED 9 $150,476 92 $177,780 310 $162,608 46 $57,593 18 $113,161 6 $75,303 APPLICATIONS WITHDRAWN 2 $109,600 79 $219,610 155 $175,966 18 $69,957 8 $130,615 2 $133,590 FILES CLOSED FOR INCOMPLETENESS 1 $126,220 14 $134,859 72 $184,824 2 $34,145 4 $176,025 0 $0
Aggregated Statistics For Year 2005(Based on 10 partial tracts) A) FHA, FSA/RHS & VA B) Conventional C) Refinancings D) Home Improvement Loans F) Non-occupant Loans on G) Loans On Manufactured Number Average Value Number Average Value Number Average Value Number Average Value Number Average Value Number Average Value
LOANS ORIGINATED 36 $171,751 745 $186,686 656 $173,419 84 $61,861 54 $189,352 1 $38,210 APPLICATIONS APPROVED, NOT ACCEPTED 1 $125,770 66 $161,854 124 $159,620 10 $57,553 6 $113,640 2 $48,665 APPLICATIONS DENIED 8 $124,878 93 $143,542 394 $161,209 43 $60,430 12 $93,515 3 $52,170 APPLICATIONS WITHDRAWN 5 $149,072 68 $150,696 250 $177,326 21 $118,139 6 $99,963 0 $0 FILES CLOSED FOR INCOMPLETENESS 0 $0 26 $160,004 45 $196,549 11 $83,474 2 $53,435 0 $0
Aggregated Statistics For Year 2004(Based on 10 partial tracts) A) FHA, FSA/RHS & VA B) Conventional C) Refinancings D) Home Improvement Loans F) Non-occupant Loans on G) Loans On Manufactured Number Average Value Number Average Value Number Average Value Number Average Value Number Average Value Number Average Value
LOANS ORIGINATED 43 $159,443 718 $179,022 839 $160,647 59 $72,556 87 $147,116 1 $128,950 APPLICATIONS APPROVED, NOT ACCEPTED 4 $127,445 50 $174,623 151 $170,554 7 $82,099 25 $178,274 3 $19,710 APPLICATIONS DENIED 2 $106,870 86 $150,001 348 $151,234 54 $49,679 16 $191,092 11 $25,116 APPLICATIONS WITHDRAWN 5 $118,740 62 $157,525 250 $164,682 9 $49,424 13 $172,635 0 $0 FILES CLOSED FOR INCOMPLETENESS 4 $114,980 18 $250,607 68 $190,649 8 $44,659 3 $466,983 0 $0
Aggregated Statistics For Year 2003(Based on 10 partial tracts) A) FHA, FSA/RHS & VA B) Conventional C) Refinancings D) Home Improvement Loans F) Non-occupant Loans on Number Average Value Number Average Value Number Average Value Number Average Value Number Average Value
LOANS ORIGINATED 66 $150,218 592 $181,377 2,186 $153,279 56 $38,805 70 $150,068 APPLICATIONS APPROVED, NOT ACCEPTED 2 $104,425 43 $170,573 230 $161,799 6 $27,735 12 $185,455 APPLICATIONS DENIED 5 $157,148 73 $138,117 374 $155,252 42 $39,405 29 $173,361 APPLICATIONS WITHDRAWN 5 $139,170 34 $143,954 252 $160,543 5 $48,912 15 $187,592 FILES CLOSED FOR INCOMPLETENESS 6 $130,090 15 $159,533 100 $164,853 6 $48,752 1 $120,130
Aggregated Statistics For Year 2002(Based on 10 partial tracts) A) FHA, FSA/RHS & VA B) Conventional C) Refinancings D) Home Improvement Loans E) Loans on Dwellings For 5+ Families F) Non-occupant Loans on Number Average Value Number Average Value Number Average Value Number Average Value Number Average Value Number Average Value
LOANS ORIGINATED 92 $137,988 505 $163,559 1,594 $153,131 37 $25,829 2 $329,200 76 $130,176 APPLICATIONS APPROVED, NOT ACCEPTED 3 $113,467 39 $150,461 192 $145,005 12 $23,713 0 $0 4 $102,578 APPLICATIONS DENIED 8 $120,215 66 $130,887 255 $159,329 19 $15,073 0 $0 20 $180,889 APPLICATIONS WITHDRAWN 6 $152,420 48 $128,883 189 $150,427 7 $66,760 0 $0 6 $186,608 FILES CLOSED FOR INCOMPLETENESS 1 $109,050 11 $192,177 56 $139,208 3 $12,317 0 $0 0 $0
Aggregated Statistics For Year 2001(Based on 10 partial tracts) A) FHA, FSA/RHS & VA B) Conventional C) Refinancings D) Home Improvement Loans F) Non-occupant Loans on Number Average Value Number Average Value Number Average Value Number Average Value Number Average Value
LOANS ORIGINATED 78 $141,523 490 $147,934 1,130 $146,732 72 $25,173 67 $145,403 APPLICATIONS APPROVED, NOT ACCEPTED 7 $109,636 46 $133,983 176 $120,472 18 $40,811 3 $82,120 APPLICATIONS DENIED 3 $97,570 33 $154,768 277 $125,177 44 $24,914 11 $102,710 APPLICATIONS WITHDRAWN 3 $130,930 41 $163,112 180 $136,825 7 $12,204 16 $158,991 FILES CLOSED FOR INCOMPLETENESS 0 $0 4 $167,800 37 $178,348 7 $23,289 3 $111,140
Aggregated Statistics For Year 2000(Based on 10 partial tracts) A) FHA, FSA/RHS & VA B) Conventional C) Refinancings D) Home Improvement Loans F) Non-occupant Loans on Number Average Value Number Average Value Number Average Value Number Average Value Number Average Value
LOANS ORIGINATED 52 $135,210 445 $156,180 264 $113,392 75 $24,588 27 $122,081 APPLICATIONS APPROVED, NOT ACCEPTED 0 $0 47 $106,643 85 $104,391 23 $14,883 2 $11,450 APPLICATIONS DENIED 2 $122,485 88 $88,050 181 $103,345 57 $24,681 5 $121,320 APPLICATIONS WITHDRAWN 8 $137,651 31 $120,051 104 $97,329 8 $48,042 4 $52,110 FILES CLOSED FOR INCOMPLETENESS 0 $0 2 $90,280 29 $104,751 0 $0 0 $0
Aggregated Statistics For Year 1999(Based on 5 partial tracts) A) FHA, FSA/RHS & VA B) Conventional C) Refinancings D) Home Improvement Loans E) Loans on Dwellings For 5+ Families F) Non-occupant Loans on Number Average Value Number Average Value Number Average Value Number Average Value Number Average Value Number Average Value
LOANS ORIGINATED 37 $120,266 235 $147,731 278 $114,179 46 $18,188 0 $0 18 $91,872 APPLICATIONS APPROVED, NOT ACCEPTED 1 $123,940 12 $111,722 74 $118,589 17 $16,472 0 $0 2 $96,825 APPLICATIONS DENIED 0 $0 33 $93,939 118 $122,914 27 $16,991 1 $126,800 10 $79,350 APPLICATIONS WITHDRAWN 4 $142,432 22 $125,449 80 $93,613 13 $69,575 1 $66,740 1 $86,930 FILES CLOSED FOR INCOMPLETENESS 0 $0 1 $84,340 12 $108,731 1 $36,300 0 $0 0 $0
Detailed HMDA statistics for the following Tracts:
0308.00
,
0309.00 ,
0310.00 ,
0311.00
Private Mortgage Insurance Companies Aggregated Statistics For Year 2009(Based on 10 partial tracts) A) Conventional B) Refinancings Number Average Value Number Average Value
LOANS ORIGINATED 46 $235,081 48 $241,158 APPLICATIONS APPROVED, NOT ACCEPTED 16 $295,702 22 $232,119 APPLICATIONS DENIED 4 $308,970 8 $283,264 APPLICATIONS WITHDRAWN 4 $422,710 1 $388,070 FILES CLOSED FOR INCOMPLETENESS 0 $0 1 $164,300
Aggregated Statistics For Year 2008(Based on 10 partial tracts) A) Conventional B) Refinancings C) Non-occupant Loans on Number Average Value Number Average Value Number Average Value
LOANS ORIGINATED 80 $227,487 40 $236,422 6 $77,093 APPLICATIONS APPROVED, NOT ACCEPTED 24 $235,002 29 $196,527 0 $0 APPLICATIONS DENIED 6 $306,768 0 $0 3 $279,320 APPLICATIONS WITHDRAWN 3 $288,290 0 $0 0 $0 FILES CLOSED FOR INCOMPLETENESS 0 $0 1 $242,310 0 $0
Aggregated Statistics For Year 2007(Based on 10 partial tracts) A) Conventional B) Refinancings C) Non-occupant Loans on Number Average Value Number Average Value Number Average Value
LOANS ORIGINATED 113 $194,375 41 $223,417 8 $145,546 APPLICATIONS APPROVED, NOT ACCEPTED 42 $227,061 14 $197,969 4 $170,325 APPLICATIONS DENIED 1 $367,860 1 $99,700 0 $0 APPLICATIONS WITHDRAWN 4 $172,600 2 $240,635 0 $0 FILES CLOSED FOR INCOMPLETENESS 2 $151,720 0 $0 0 $0
Aggregated Statistics For Year 2006(Based on 10 partial tracts) A) Conventional B) Refinancings C) Non-occupant Loans on Number Average Value Number Average Value Number Average Value
LOANS ORIGINATED 74 $199,934 24 $226,616 4 $141,330 APPLICATIONS APPROVED, NOT ACCEPTED 24 $267,495 15 $220,931 0 $0 APPLICATIONS DENIED 1 $455,830 2 $345,950 1 $218,830 APPLICATIONS WITHDRAWN 3 $288,197 5 $147,318 2 $117,365 FILES CLOSED FOR INCOMPLETENESS 0 $0 0 $0 0 $0
Aggregated Statistics For Year 2005(Based on 10 partial tracts) A) Conventional B) Refinancings C) Non-occupant Loans on D) Loans On Manufactured Number Average Value Number Average Value Number Average Value Number Average Value
LOANS ORIGINATED 105 $216,718 57 $174,698 1 $405,670 1 $38,210 APPLICATIONS APPROVED, NOT ACCEPTED 30 $225,487 18 $196,682 1 $153,990 0 $0 APPLICATIONS DENIED 4 $315,158 2 $107,825 0 $0 0 $0 APPLICATIONS WITHDRAWN 11 $290,273 8 $208,585 0 $0 0 $0 FILES CLOSED FOR INCOMPLETENESS 2 $245,230 0 $0 0 $0 0 $0
Aggregated Statistics For Year 2004(Based on 10 partial tracts) A) Conventional B) Refinancings C) Non-occupant Loans on Number Average Value Number Average Value Number Average Value
LOANS ORIGINATED 126 $196,709 66 $179,820 10 $102,079 APPLICATIONS APPROVED, NOT ACCEPTED 19 $218,474 40 $155,703 0 $0 APPLICATIONS DENIED 2 $133,590 0 $0 0 $0 APPLICATIONS WITHDRAWN 10 $234,983 7 $178,824 0 $0 FILES CLOSED FOR INCOMPLETENESS 1 $154,120 0 $0 0 $0
Aggregated Statistics For Year 2003(Based on 10 partial tracts) A) Conventional B) Refinancings C) Non-occupant Loans on Number Average Value Number Average Value Number Average Value
LOANS ORIGINATED 138 $181,972 192 $165,688 3 $117,393 APPLICATIONS APPROVED, NOT ACCEPTED 27 $171,448 69 $172,393 2 $118,590 APPLICATIONS DENIED 0 $0 10 $186,347 0 $0 APPLICATIONS WITHDRAWN 4 $138,198 19 $153,618 2 $52,480 FILES CLOSED FOR INCOMPLETENESS 0 $0 0 $0 0 $0
Aggregated Statistics For Year 2002(Based on 10 partial tracts) A) Conventional B) Refinancings C) Non-occupant Loans on Number Average Value Number Average Value Number Average Value
LOANS ORIGINATED 147 $174,344 140 $169,946 5 $122,638 APPLICATIONS APPROVED, NOT ACCEPTED 34 $160,700 39 $152,071 0 $0 APPLICATIONS DENIED 0 $0 4 $150,458 2 $139,810 APPLICATIONS WITHDRAWN 9 $130,829 8 $144,836 1 $97,060 FILES CLOSED FOR INCOMPLETENESS 2 $150,205 2 $101,145 0 $0
Aggregated Statistics For Year 2001(Based on 10 partial tracts) A) Conventional B) Refinancings C) Non-occupant Loans on Number Average Value Number Average Value Number Average Value
LOANS ORIGINATED 120 $168,689 109 $173,898 4 $93,988 APPLICATIONS APPROVED, NOT ACCEPTED 19 $227,088 21 $137,989 1 $104,880 APPLICATIONS DENIED 3 $237,337 1 $217,240 0 $0 APPLICATIONS WITHDRAWN 1 $84,770 3 $142,707 1 $84,770 FILES CLOSED FOR INCOMPLETENESS 4 $192,658 2 $99,235 0 $0
Aggregated Statistics For Year 2000(Based on 10 partial tracts) A) Conventional B) Refinancings C) Non-occupant Loans on Number Average Value Number Average Value Number Average Value
LOANS ORIGINATED 112 $166,199 21 $137,186 6 $88,813 APPLICATIONS APPROVED, NOT ACCEPTED 11 $166,675 5 $186,550 0 $0 APPLICATIONS DENIED 1 $125,040 0 $0 0 $0 APPLICATIONS WITHDRAWN 1 $152,670 0 $0 0 $0 FILES CLOSED FOR INCOMPLETENESS 3 $180,297 0 $0 0 $0
Aggregated Statistics For Year 1999(Based on 5 partial tracts) A) Conventional B) Refinancings Number Average Value Number Average Value
LOANS ORIGINATED 65 $172,247 31 $140,786 APPLICATIONS APPROVED, NOT ACCEPTED 3 $168,580 9 $175,503 APPLICATIONS DENIED 2 $267,560 2 $112,070 APPLICATIONS WITHDRAWN 1 $99,720 1 $80,950 FILES CLOSED FOR INCOMPLETENESS 0 $0 0 $0
Detailed PMIC statistics for the following Tracts:
0308.00
,
0309.00 ,
0310.00 ,
0311.00
2002 - 2018 National Fire Incident Reporting System (NFIRS) incidents See full 2006 National Fire Incident Reporting System statistics for zip code 45068, Ohio
Most common first names in zip code 45068 among deceased individuals Name Count Lived (average)
Mary 56 80.7 years James 49 70.1 years William 46 77.5 years Charles 43 74.5 years Robert 32 75.2 years John 31 76.5 years George 28 75.1 years Raymond 25 76.3 years Dorothy 23 80.9 years Ruth 21 79.7 years
Most common last names in zip code 45068 among deceased individuals Last name Count Lived (average)
Jones 22 79.5 years Smith 21 76.8 years Miller 20 76.5 years Davis 18 79.6 years Lamb 15 75.4 years Brown 13 83.1 years Wilson 12 77.0 years Young 11 80.2 years Hartsock 11 80.9 years Dakin 11 71.4 years
Businesses in zip code 45068
FedEx: 1McDonald's: 1U-Haul: 1
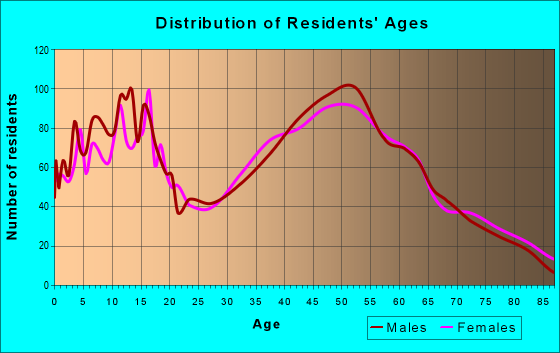
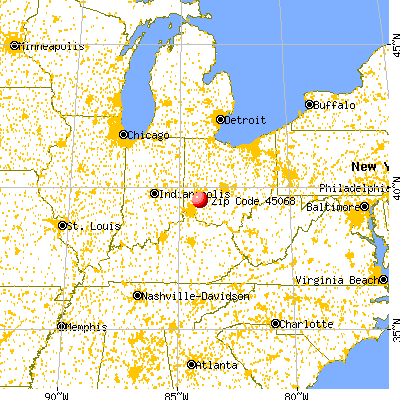


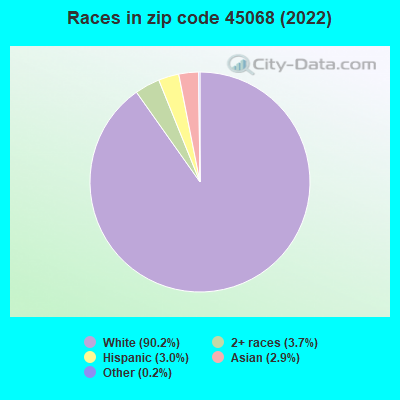


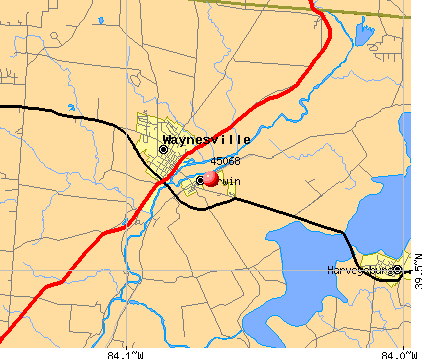 Nearest zip codes: 45032, 45054, 45370, 45305, 45458, 45113.
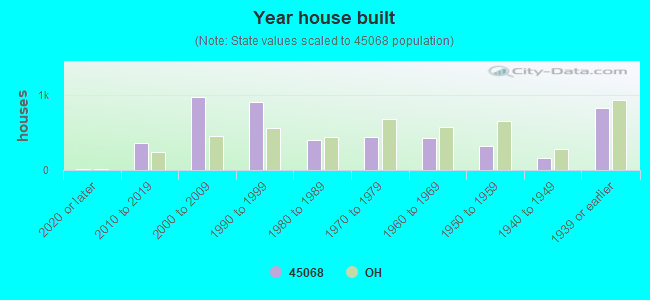
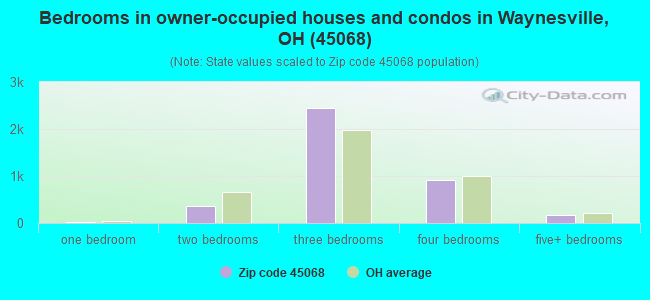
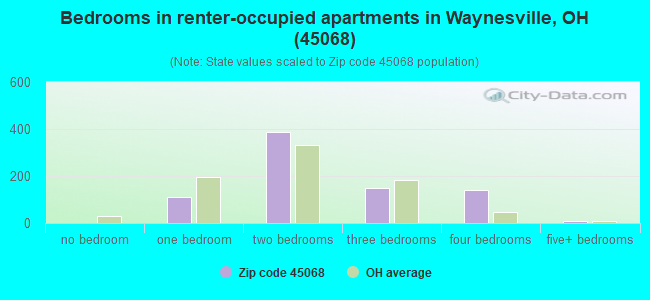


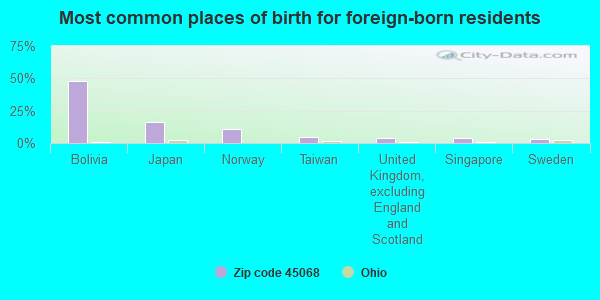
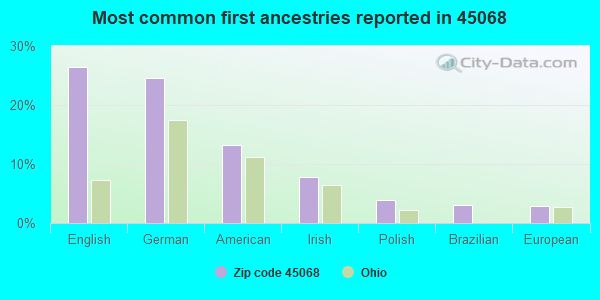
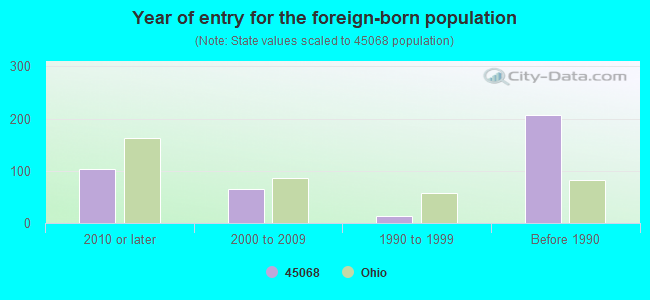
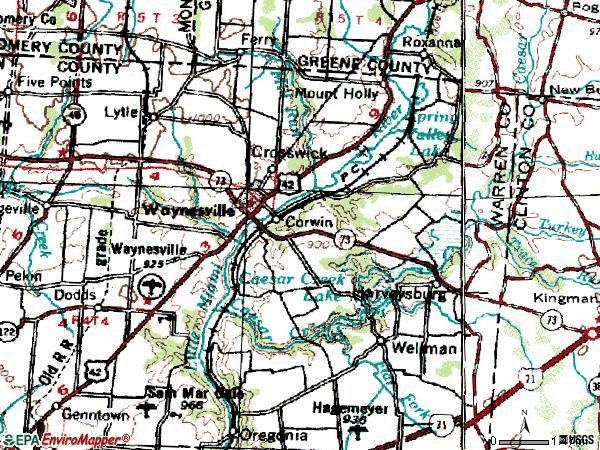


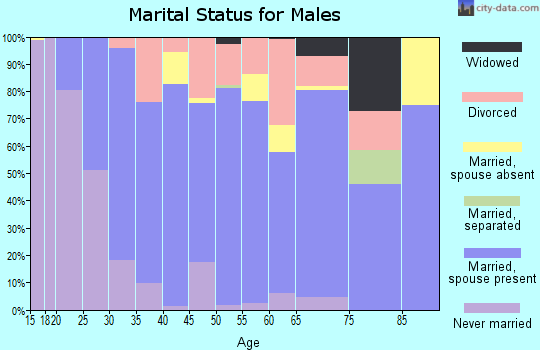
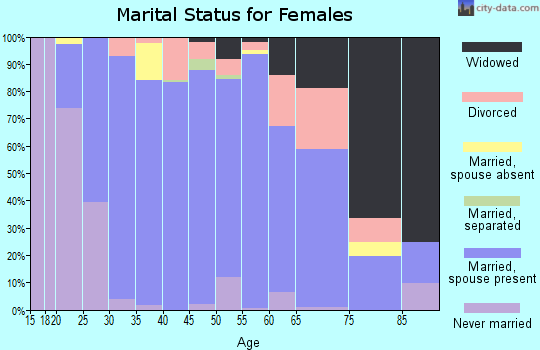
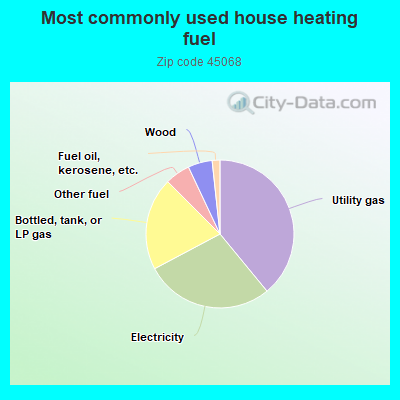
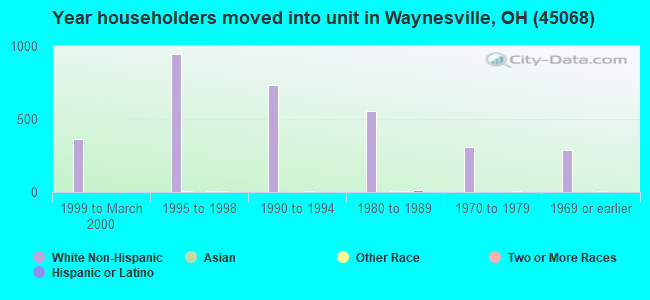

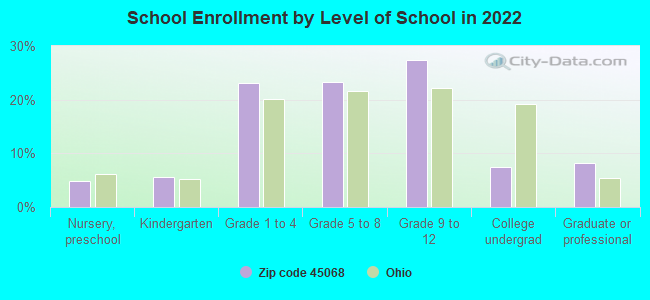
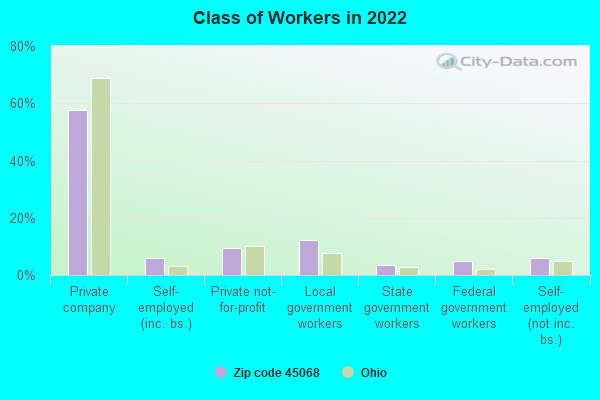
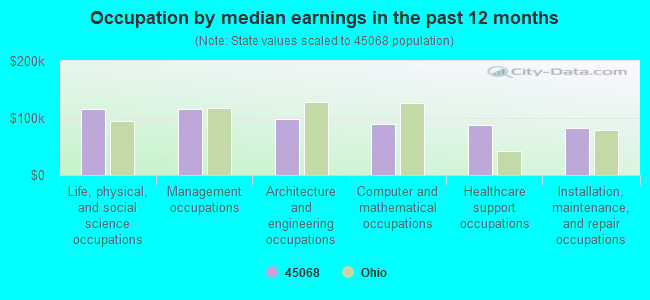
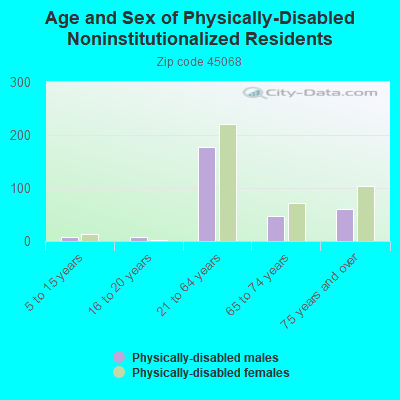
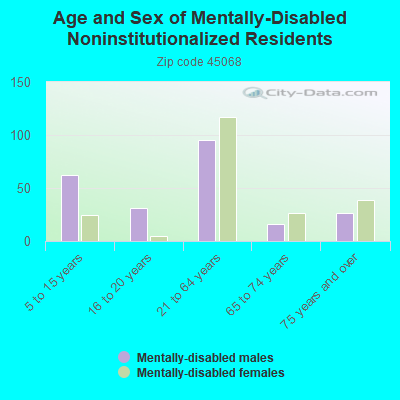
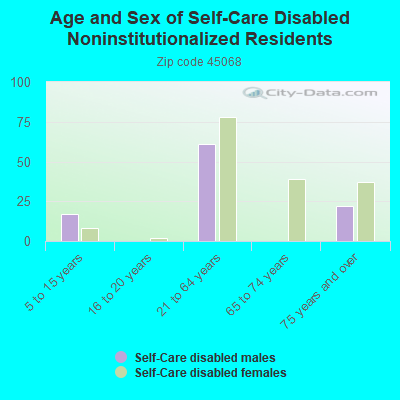
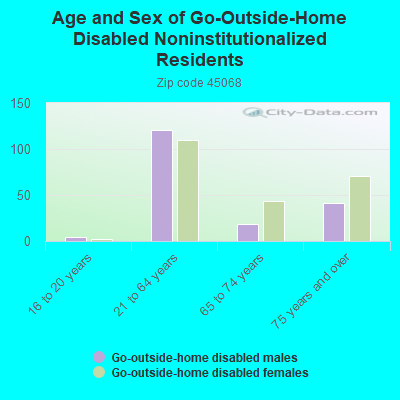
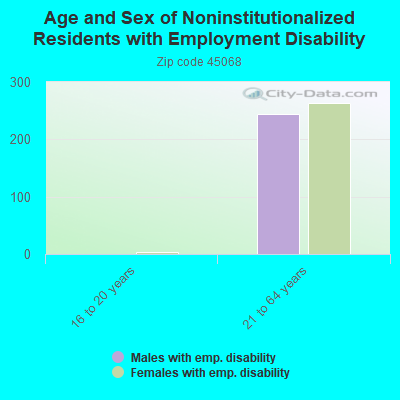
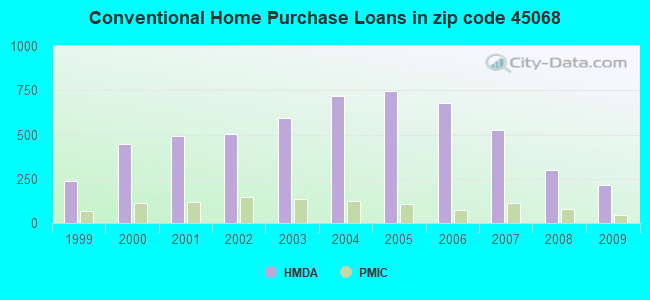
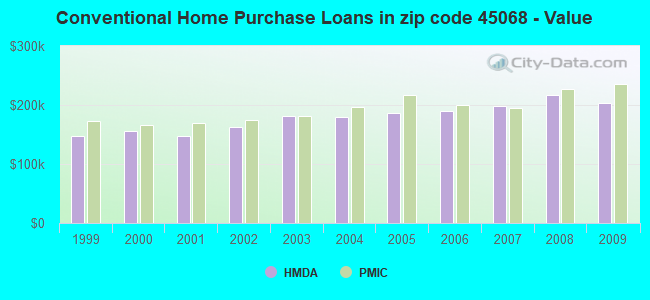
 According to the data from the years 2002 - 2018 the average number of fires per year is 52. The highest number of reported fire incidents - 78 took place in 2014, and the least - 5 in 2002. The data has an increasing trend.
 When looking into fire subcategories, the most reports belonged to: Structure Fires (46.3%), and Outside Fires (41.9%).