Estimated zip code population in 2022: 11,454 Zip code population in 2010: 10,712 Zip code population in 2000: 9,739
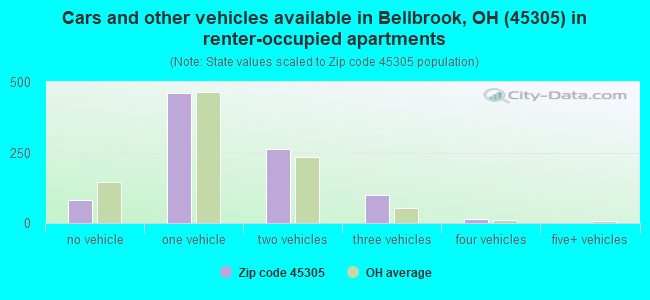
Houses and condos: 4,674 Renter-occupied apartments: 916
% of renters here:
20%
State:
33%
March 2022 cost of living index in zip code 45305: 94.7 (less than average, U.S. average is 100)
Land area: 14.4 sq. mi. Water area: 0.1 sq. mi.
Population density: 793 people per square mile
(low).
OSM Map
General Map
Google Map
MSN Map
OSM Map
General Map
Google Map
MSN Map
OSM Map
General Map
Google Map
MSN Map
OSM Map
General Map
Google Map
MSN Map
Please wait while loading the map...
Real estate property taxes paid for housing units in 2022:
This zip code:
1.7% ($5,241)
Ohio:
1.3% ($2,639)
Median real estate property taxes paid for housing units with mortgages in 2022: $5,204 (1.7%) Median real estate property taxes paid for housing units with no mortgage in 2022: $5,320 (1.8%)
Business Search- 14 Million verified businesses
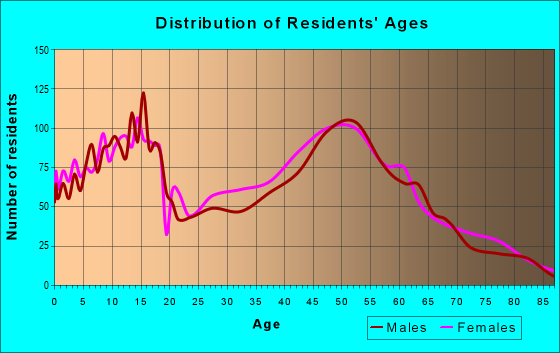
Males: 5,855
(51.1%)
Females: 5,599
(48.9%)
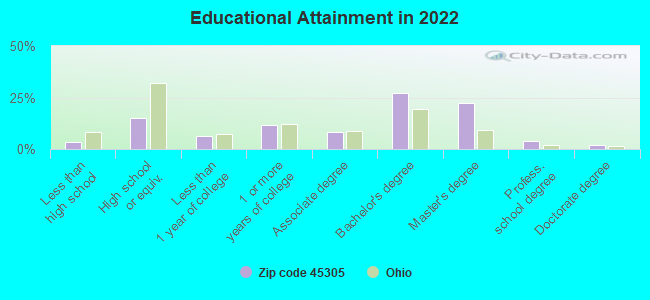
For population 25 years and over in 45305:
High school or higher: 98.4%
Bachelor's degree or higher: 56.1%
Graduate or professional degree: 28.5%
Unemployed: 1.8%
Mean travel time to work (commute): 22.8 minutes
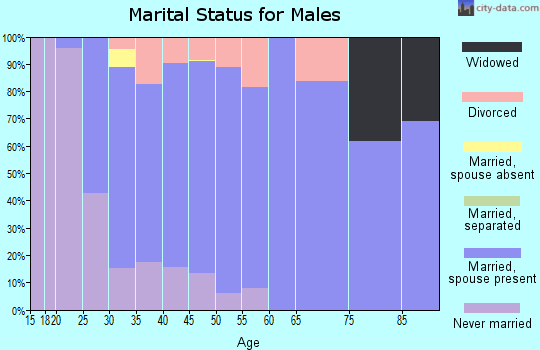
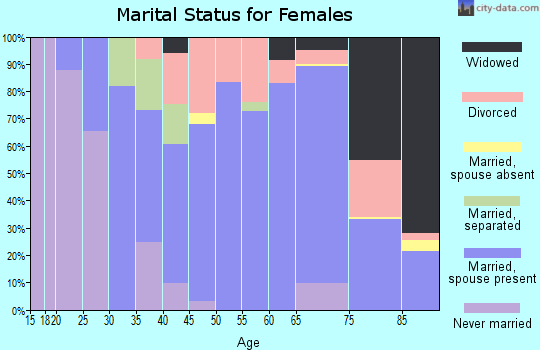
For population 15 years and over in 45305:
Never married: 20.3%
Now married: 67.4%
Separated: 0.8%
Widowed: 4.3%
Divorced: 7.1%
Zip code 45305 compared to state average:
Median household income above state average.
Unemployed percentage below state average.
Black race population percentage significantly below state average.
Renting percentage below state average.
Length of stay since moving in significantly above state average.
House age below state average.
Percentage of population with a bachelor's degree or higher above state average.
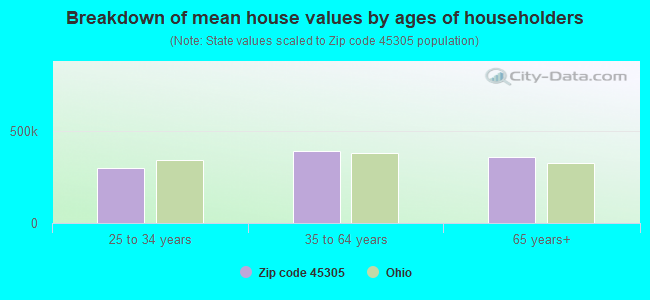
Estimated median house/condo value in 2022: $300,193
45305:
$300,193
Ohio:
$204,100
According to our research of Ohio and other state lists, there were 3 registered sex offenders living in 45305 zip code as of April 25, 2024. The ratio of all residents to sex offenders in zip code 45305 is 3,788 to 1. The ratio of registered sex offenders to all residents in this zip code is much lower than the state average.
Median resident age:
This zip code:
42.9 years
Ohio median age:
39.9 years
Average household size:
This zip code:
2.5 people
Ohio:
2.4 people
Averages for the 2020 tax year for zip code 45305, filed in 2021:
Average Adjusted Gross Income (AGI) in 2020: $115,369 (Individual Income Tax Returns)
Here:
$115,369
State:
$67,288
Salary/wage: $81,925 (reported on 81.5% of returns)
Here:
$81,925
State:
$55,628
(% of AGI for various income ranges: 1208.3% for AGIs below $25k, 3373.4% for AGIs $25k-50k, 6709.8% for AGIs $50k-75k, 9352.0% for AGIs $75k-100k, 18892.7% for AGIs $100k-200k, 74666.5% for AGIs over 200k)
Taxable interest for individuals: $2,274 (reported on 47.8% of returns)
This zip code:
$2,274
Ohio:
$1,518
(% of AGI for various income ranges: 18.8% for AGIs below $25k, 26.7% for AGIs $25k-50k, 50.7% for AGIs $50k-75k, 70.7% for AGIs $75k-100k, 126.4% for AGIs $100k-200k, 2555.9% for AGIs over 200k)
Ordinary dividends: $6,895 (reported on 31.5% of returns)
Here:
$6,895
State:
$7,167
(% of AGI for various income ranges: 31.2% for AGIs below $25k, 62.8% for AGIs $25k-50k, 116.1% for AGIs $50k-75k, 202.2% for AGIs $75k-100k, 375.4% for AGIs $100k-200k, 4349.4% for AGIs over 200k)
Net capital gain/loss in AGI: +$27,732 (reported on 27.3% of returns)
Here:
+$27,732
State:
+$18,919
(% of AGI for various income ranges: 19.1% for AGIs below $25k, 58.6% for AGIs $25k-50k, 91.3% for AGIs $50k-75k, 212.7% for AGIs $75k-100k, 518.8% for AGIs $100k-200k, 22222.9% for AGIs over 200k)
Profit/loss from business: +$20,618 (reported on 15.7% of returns)
Here:
+$20,618
State:
+$13,744
(% of AGI for various income ranges: 107.0% for AGIs below $25k, 209.3% for AGIs $25k-50k, 319.1% for AGIs $50k-75k, 377.1% for AGIs $75k-100k, 663.8% for AGIs $100k-200k, 4540.0% for AGIs over 200k)
Taxable individual retirement arrangement distribution: $22,459 (reported on 12.8% of returns)
45305:
$22,459
Ohio:
$18,876
(% of AGI for various income ranges: 56.7% for AGIs below $25k, 188.3% for AGIs $25k-50k, 283.7% for AGIs $50k-75k, 460.5% for AGIs $75k-100k, 867.7% for AGIs $100k-200k, 2628.2% for AGIs over 200k)
Self-employed (Keogh) retirement plans: $28,050 (reported on 0.7% of returns)
45305:
$28,050
Ohio:
$24,898
(% of AGI for various income ranges: 64.4% for AGIs $50k-75k, 455.3% for AGIs over 200k)
Total itemized deductions: $37,062 (reported on 10.4% of returns)
Here:
$37,062
State:
$33,869
(% of AGI for various income ranges: 211.1% for AGIs $25k-50k, 292.6% for AGIs $50k-75k, 443.4% for AGIs $75k-100k, 834.5% for AGIs $100k-200k, 6309.4% for AGIs over 200k)
Charity contributions: $15,996 (reported on 8.8% of returns)
Here:
$15,996
State:
$14,577
(% of AGI for various income ranges: 20.0% for AGIs $25k-50k, 48.0% for AGIs $50k-75k, 96.6% for AGIs $75k-100k, 237.9% for AGIs $100k-200k, 3232.4% for AGIs over 200k)
Taxes paid: $8,600 (reported on 10.4% of returns)
45305:
$8,600
State:
$7,681
(% of AGI for various income ranges: 39.3% for AGIs $25k-50k, 88.0% for AGIs $50k-75k, 124.4% for AGIs $75k-100k, 259.4% for AGIs $100k-200k, 1090.0% for AGIs over 200k)
Earned income credit: $2,087 (reported on 8.0% of returns)
Here:
$2,087
State:
$2,304
(% of AGI for various income ranges: 60.2% for AGIs below $25k, 51.8% for AGIs $25k-50k)
Percentage of individuals using paid preparers for their 2020 taxes: 91.9%
Here:
92%
State:
94%
(% for various income ranges: 89.8% for AGIs below $25k, 93.0% for AGIs $25k-50k, 92.7% for AGIs $50k-75k, 93.8% for AGIs $75k-100k, 92.3% for AGIs $100k-200k, 90.6% for AGIs over 200k)
Averages for the 2012 tax year for zip code 45305, filed in 2013:
Average Adjusted Gross Income (AGI) in 2012: $82,300 (Individual Income Tax Returns)
Here:
$82,300
State:
$54,926
Salary/wage: $63,458 (reported on 84.3% of returns)
Here:
$63,458
State:
$45,869
(% of AGI for various income ranges: 75.7% for AGIs below $25k, 70.8% for AGIs $25k-50k, 71.7% for AGIs $50k-75k, 75.7% for AGIs $75k-100k, 77.9% for AGIs $100k-200k, 43.4% for AGIs over 200k)
Taxable interest for individuals: $1,449 (reported on 47.6% of returns)
This zip code:
$1,449
Ohio:
$1,297
(% of AGI for various income ranges: 1.3% for AGIs below $25k, 0.7% for AGIs $25k-50k, 0.7% for AGIs $50k-75k, 0.7% for AGIs $75k-100k, 0.5% for AGIs $100k-200k, 1.3% for AGIs over 200k)
Ordinary dividends: $4,673 (reported on 30.4% of returns)
Here:
$4,673
State:
$5,821
(% of AGI for various income ranges: 1.8% for AGIs below $25k, 0.9% for AGIs $25k-50k, 1.3% for AGIs $50k-75k, 1.4% for AGIs $75k-100k, 1.4% for AGIs $100k-200k, 2.5% for AGIs over 200k)
Net capital gain/loss in AGI: +$7,719 (reported on 23.2% of returns)
Here:
+$7,719
State:
+$11,232
(% of AGI for various income ranges: 0.2% for AGIs $25k-50k, 0.5% for AGIs $50k-75k, 1.1% for AGIs $75k-100k, 0.8% for AGIs $100k-200k, 5.3% for AGIs over 200k)
Profit/loss from business: +$17,400 (reported on 15.5% of returns)
Here:
+$17,400
State:
+$12,773
(% of AGI for various income ranges: 6.9% for AGIs below $25k, 3.7% for AGIs $25k-50k, 3.1% for AGIs $50k-75k, 2.8% for AGIs $75k-100k, 2.3% for AGIs $100k-200k, 3.9% for AGIs over 200k)
Taxable individual retirement arrangement distribution: $16,257 (reported on 12.9% of returns)
45305:
$16,257
Ohio:
$14,511
(% of AGI for various income ranges: 3.6% for AGIs below $25k, 3.4% for AGIs $25k-50k, 3.2% for AGIs $50k-75k, 2.3% for AGIs $75k-100k, 2.6% for AGIs $100k-200k, 2.0% for AGIs over 200k)
Self-employment retirement plans: $22,080 (reported on 0.9% of returns)
45305:
$22,080
Ohio:
$20,257
(% of AGI for various income ranges: 0.3% for AGIs $100k-200k, 0.5% for AGIs over 200k)
Total itemized deductions: $24,375 (17% of AGI, reported on 47.0% of returns)
Here:
$24,375
State:
$21,278
Here:
17.4% of AGI
State:
18.8% of AGI
(% of AGI for various income ranges: 16.6% for AGIs below $25k, 11.3% for AGIs $25k-50k, 14.4% for AGIs $50k-75k, 15.0% for AGIs $75k-100k, 15.8% for AGIs $100k-200k, 11.8% for AGIs over 200k)
Charity contributions: $4,057 (reported on 39.5% of returns)
Here:
$4,057
State:
$3,943
(% of AGI for various income ranges: 0.9% for AGIs below $25k, 1.1% for AGIs $25k-50k, 1.6% for AGIs $50k-75k, 2.2% for AGIs $75k-100k, 2.4% for AGIs $100k-200k, 1.9% for AGIs over 200k)
Taxes paid: $11,741 (reported on 46.7% of returns)
45305:
$11,741
State:
$9,568
(% of AGI for various income ranges: 2.7% for AGIs below $25k, 3.7% for AGIs $25k-50k, 5.6% for AGIs $50k-75k, 6.5% for AGIs $75k-100k, 7.6% for AGIs $100k-200k, 7.4% for AGIs over 200k)
Earned income credit: $1,994 (reported on 9.8% of returns)
Here:
$1,994
State:
$2,285
(% of AGI for various income ranges: 4.4% for AGIs below $25k, 0.7% for AGIs $25k-50k)
Percentage of individuals using paid preparers for their 2012 taxes: 42.1%
Here:
42%
State:
51%
(% for various income ranges: 34.1% for AGIs below $25k, 43.6% for AGIs $25k-50k, 47.5% for AGIs $50k-75k, 47.5% for AGIs $75k-100k, 39.6% for AGIs $100k-200k, 67.9% for AGIs over 200k)
Averages for the 2004 tax year for zip code 45305, filed in 2005:
Average Adjusted Gross Income (AGI) in 2004: $62,963 (Individual Income Tax Returns)
Here:
$62,963
State:
$44,480
Salary/wage: $54,113 (reported on 87.6% of returns)
Here:
$54,113
State:
$39,198
(% of AGI for various income ranges: 174.7% for AGIs below $10k, 72.3% for AGIs $10k-25k, 74.3% for AGIs $25k-50k, 82.1% for AGIs $50k-75k, 84.4% for AGIs $75k-100k, 68.9% for AGIs over 100k)
Taxable interest for individuals: $1,166 (reported on 56.7% of returns)
This zip code:
$1,166
Ohio:
$1,532
(% of AGI for various income ranges: 5.3% for AGIs below $10k, 2.8% for AGIs $10k-25k, 1.7% for AGIs $25k-50k, 1.1% for AGIs $50k-75k, 0.7% for AGIs $75k-100k, 0.8% for AGIs over 100k)
Taxable dividends: $2,183 (reported on 35.9% of returns)
Here:
$2,183
State:
$3,496
(% of AGI for various income ranges: 4.8% for AGIs below $10k, 2.1% for AGIs $10k-25k, 1.0% for AGIs $25k-50k, 0.8% for AGIs $50k-75k, 1.0% for AGIs $75k-100k, 1.4% for AGIs over 100k)
Net capital gain/loss: +$8,568 (reported on 28.4% of returns)
Here:
+$8,568
State:
+$8,582
(% of AGI for various income ranges: -1.0% for AGIs below $10k, -0.6% for AGIs $10k-25k, 0.1% for AGIs $25k-50k, 0.8% for AGIs $50k-75k, 1.5% for AGIs $75k-100k, 7.1% for AGIs over 100k)
Profit/loss from business: +$12,974 (reported on 14.4% of returns)
Here:
+$12,974
State:
+$10,813
(% of AGI for various income ranges: 9.6% for AGIs below $10k, 4.1% for AGIs $10k-25k, 4.0% for AGIs $25k-50k, 2.0% for AGIs $50k-75k, 2.7% for AGIs $75k-100k, 3.0% for AGIs over 100k)
IRA payment deduction: $3,079 (reported on 2.5% of returns)
45305:
$3,079
Ohio:
$2,794
(% of AGI for various income ranges: 0.3% for AGIs $10k-25k, 0.3% for AGIs $25k-50k, 0.1% for AGIs $50k-75k, 0.1% for AGIs $75k-100k, 0.1% for AGIs over 100k)
Self-employed pension: $9,308 (reported on 1.0% of returns)
Here:
$9,308
Ohio:
$13,981
Total itemized deductions: $19,941 (20% of AGI, reported on 51.4% of returns)
Here:
$19,941
State:
$17,503
Here:
20.0% of AGI
State:
20.8% of AGI
(% of AGI for various income ranges: 20.3% for AGIs below $10k, 13.3% for AGIs $10k-25k, 14.8% for AGIs $25k-50k, 17.4% for AGIs $50k-75k, 18.5% for AGIs $75k-100k, 15.6% for AGIs over 100k)
Charity contributions deductions: $3,091 (3% of AGI, reported on 45.0% of returns)
Here:
$3,091
State:
$3,087
Here:
2.9% of AGI
State:
3.4% of AGI
(% of AGI for various income ranges: 0.7% for AGIs below $10k, 0.8% for AGIs $10k-25k, 1.7% for AGIs $25k-50k, 2.0% for AGIs $50k-75k, 2.2% for AGIs $75k-100k, 2.5% for AGIs over 100k)
Total tax: $10,088 (reported on 81.8% of returns)
45305:
$10,088
State:
$6,781
(% of AGI for various income ranges: 5.1% for AGIs below $10k, 4.4% for AGIs $10k-25k, 7.7% for AGIs $25k-50k, 9.5% for AGIs $50k-75k, 10.1% for AGIs $75k-100k, 17.6% for AGIs over 100k)
Earned income credit: $1,670 (reported on 7.9% of returns)
Here:
$1,670
State:
$1,696
Percentage of individuals using paid preparers for their 2004 taxes: 44.6%
Here:
45%
State:
55%
(% for various income ranges: 35.8% for AGIs below $10k, 48.7% for AGIs $10k-25k, 49.0% for AGIs $25k-50k, 49.3% for AGIs $50k-75k, 38.8% for AGIs $75k-100k, 45.1% for AGIs over 100k)
Likely homosexual households (counted as self-reported same-sex unmarried-partner households)
Lesbian couples: 0.4% of all households
Gay men: 0.0% of all households
Household received Food Stamps/SNAP in the past 12 months: 215 Household did not receive Food Stamps/SNAP in the past 12 months: 4,416
Women who had a birth in the past 12 months: 168 (123 now married, 46 unmarried) Women who did not have a birth in the past 12 months: 2,234 (1,446 now married, 786 unmarried)
Housing units in zip code 45305 with a mortgage: 2,620 (491 second mortgage, 21 home equity loan, 420 both second mortgage and home equity loan) Houses without a mortgage: 277
Median monthly owner costs for units with a mortgage: $1,809 Median monthly owner costs for units without a mortgage: $812
Residents with income below the poverty level in 2022:
This zip code:
3.6%
Whole state:
13.4%
Residents with income below 50% of the poverty level in 2022:
This zip code:
2.0%
Whole state:
7.0%
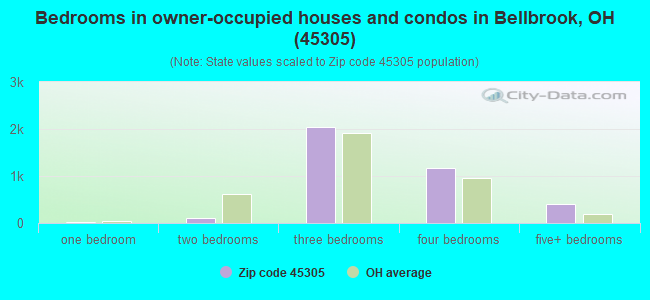
Median number of rooms in houses and condos:
Here:
7.5
State:
6.7
Median number of rooms in apartments:
Here:
4.6
State:
4.4
Notable locations in this zip code not listed on our city pages
Notable locations in zip code 45305: Dayton Sugarcreek Office Park (A), Bellbrook Fire and Emergency Medical Services Station 1 (B), Sugarcreek Township Fire Department Station 2 (C), Bellbrook Fire and Emergency Medical Services Station 2 (D), Sugarcreek Township Fire Emergency Medical Services Department Station 1 (E). Display/hide their locations on the map
In group quarters: 41 (-1 institutionalized population)
Size of family households: 1,618 2-persons, 858 3-persons, 773 4-persons, 152 5-persons, 61 6-persons
Size of nonfamily households: 890 1-person, 244 2-persons, 22 3-persons
2,060 married couples with children.
379 single-parent households (113 men, 266 women).
93.5% of residents of 45305 zip code speak English at home.
1.0% of residents speak Spanish at home (100% very well).
1.5% of residents speak other Indo-European language at home (46% very well, 46% well, 7% not well).
3.3% of residents speak Asian or Pacific Island language at home (55% very well, 23% well, 22% not well).
0.5% of residents speak other language at home (79% very well, 21% not well).
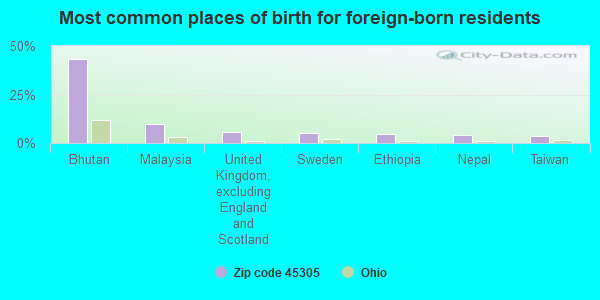
Foreign born population: 613 (5.4%) (44.3% of them are naturalized citizens)
This zip code:
5.4%
Whole state:
5.0%
43%Bhutan
10%Malaysia
6%United Kingdom, excluding England and Scotland
5%Sweden
5%Ethiopia
4%Nepal
3%Taiwan
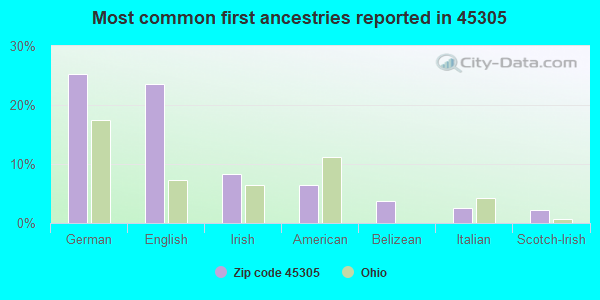
25%German
24%English
8%Irish
6%American
4%Belizean
3%Italian
2%Scotch-Irish
Year of entry for the foreign-born population
3462010 or later
1262000 to 2009
171990 to 1999
265Before 1990
Facilities with environmental interests located in this zip code:
BELLBROOK HIGH SCHOOL * (3491 UPPER BELLBROOK ROAD in BELLBROOK, OH)
STATE MASTER (Ohio general info) - AIR MAJOR STATE MASTER (Ohio general info) - RCRA-OHR000016840, HAZARDOUS WASTE PROGRAM Conditionally Exempt Small Quantity Generators, less than 100 kg/month of hazardous waste (Resource Conservation and Recovery Act (tracking hazardous waste)) - notification Organizations: SUGARCREEK SCHOOL SYSTEM (CONTACT/OWNER)
BP OIL NO 09409 (34 W FRANKLIN ST in BELLBROOK, OH)
STATE MASTER (Ohio general info) - AIR MAJOR (Resource Conservation and Recovery Act (tracking hazardous waste)) Organizations: BP OIL COMPANY (CONTACT/OWNER)
Alternative names: BP OIL CO
BELLBROOK HIGH SCHOOL (3737 UPPER BELLBROOK RD in BELLBROOK, OH)
(Geographic Names Information System) (National Center for Education Statistics) - STATE ID-002154 Organizations: SUGARCREEK LOCAL SD (SCHOOL DISTRICT)
BELLBROOK JUNIOR HIGH SCHOOL (3777 UPPER BELLBROOK RD in BELLBROOK, OH)
(Geographic Names Information System) (National Center for Education Statistics) - STATE ID-002147 Organizations: SUGARCREEK LOCAL SD (SCHOOL DISTRICT)
BELL CREEK ELEMENTARY SCHOOL (3757 UPPER BELLBROOK RD in BELLBROOK, OH)
(National Center for Education Statistics) - STATE ID-123216 Organizations: SUGARCREEK LOCAL SD (SCHOOL DISTRICT)
BELLBROOK CITGO (34 W FRANKLIN STREET in BELLBROOK, OH)
AIR MINOR (AIRS/AFS) CRITERIA AND HAZARDOUS AIR POLLUTANT INVENTORY (Inventory of air pollution sources) Business SIC classification: GASOLINE SERVICE STATIONS Alternative names: BELLBROOK CITGO-DUNCAN OIL CO
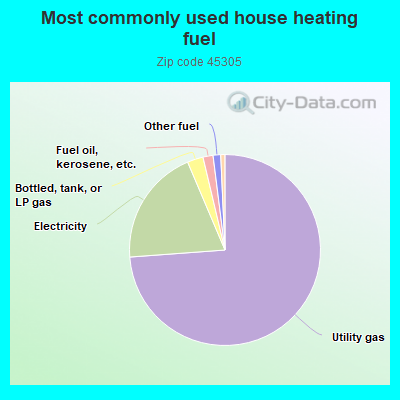
73.9%Utility gas
19.8%Electricity
2.7%Bottled, tank, or LP gas
1.7%Fuel oil, kerosene, etc.
1.3%Other fuel
0.7%Wood
Population in 1990: 8,162. Population change in the 1990s: +1,577 (+19.3%).
Place of birth for U.S.-born residents:
This state: 7,783
Northeast: 697
Midwest: 680
South: 948
West: 602
53% of the 45305 zip code residents lived in the same house 5 years ago. Out of people who lived in different houses, 34% lived in this county. Out of people who lived in different counties, 50% lived in Ohio.
93% of the 45305 zip code residents lived in the same house 1 year ago. Out of people who lived in different houses, 52% moved from this county. Out of people who lived in different houses, 42% moved from different county within same state. Out of people who lived in different houses, 9% moved from different state.
Private vs. public school enrollment:
Students in private schools in grades 1 to 8 (elementary and middle school): 44
Here:
3.8%
Ohio:
16.0%
Students in private schools in grades 9 to 12 (high school):
Here:
0.0%
Ohio:
13.1%
Students in private undergraduate colleges: 189
Here:
37.7%
Ohio:
22.3%
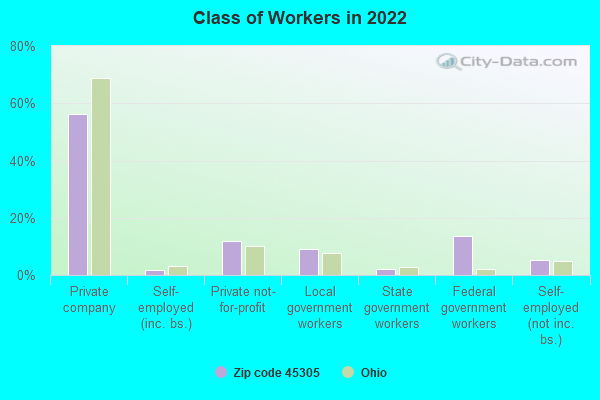
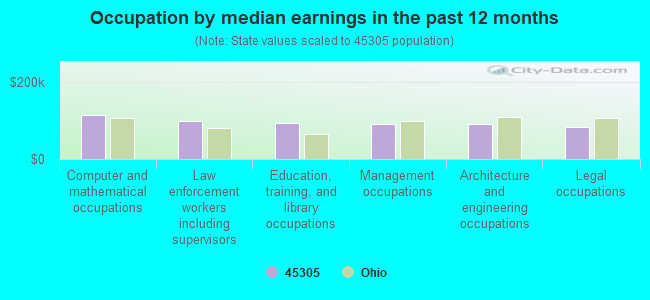
Occupation by median earnings in the past 12 months ($)
112,431Computer and mathematical occupations
97,207Law enforcement workers including supervisors
91,661Education, training, and library occupations
90,638Management occupations
89,231Architecture and engineering occupations
83,509Legal occupations
Companies with federal contracts located in this zip code:
RHAMM TECHNOLOGIES, LLC (332 SKYLAND DRIVE in BELLBROOK, OH; small business) : $1,920,234 in 12 contractsfrom 2003 to 2005
Contracts for Defense Missile and Space Systems -- Advanced Development (R&D), Engineering and Technical Services, Physical Sciences -- Basic Research (R&D) by Army, Federal Technology Service, Air Force Signed by year:2000: $0; 2001: $0; 2002: $0; 2003: $543,303; 2004: $1,008,980; 2005: $367,951; 2006: $0.
Biggest contracts:
$367,951 with Army for Defense Missile and Space Systems -- Advanced Development (R&D). Signed on 2005-11-15. Completion date: 2006-11-10.
$362,030, same as above.Signed on 2004-11-08. Completion date: 2006-11-10.
$220,640 with Federal Technology Service for Engineering and Technical Services. Signed on 2003-10-08. Completion date: 2004-12-31.
$149,995 with Air Force for Physical Sciences -- Basic Research (R&D). Signed on 2004-11-19. Completion date: 2005-12-31.
Top industries in this zip code by the number of employees in 2005:
2002 - 2018 National Fire Incident Reporting System (NFIRS) incidents
Based on the data from the years 2002 - 2018 the average number of fire incidents per year is 32. The highest number of reported fire incidents - 51 took place in 2007, and the least - 14 in 2013. The data has a rising trend.
When looking into fire subcategories, the most reports belonged to: Structure Fires (44.1%), and Outside Fires (42.9%).
Fire incident types reported to NFIRS in Zip Code 45305


 Nearest zip codes: 45440, 45370, 45430, 45458, 45459, 45429.
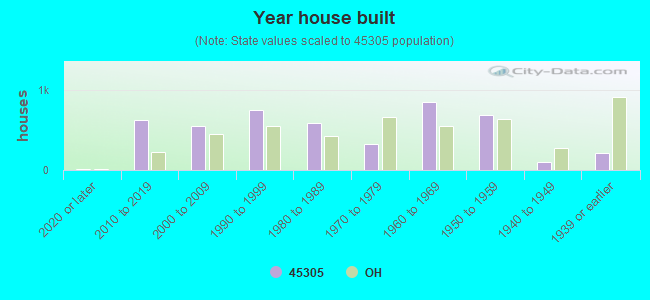


 Based on the data from the years 2002 - 2018 the average number of fire incidents per year is 32. The highest number of reported fire incidents - 51 took place in 2007, and the least - 14 in 2013. The data has a rising trend.
 When looking into fire subcategories, the most reports belonged to: Structure Fires (44.1%), and Outside Fires (42.9%).