Estimated zip code population in 2022: 5,299 Zip code population in 2010: 5,879 Zip code population in 2000: 5,860
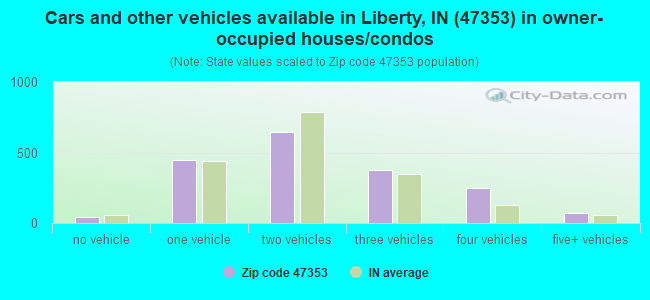
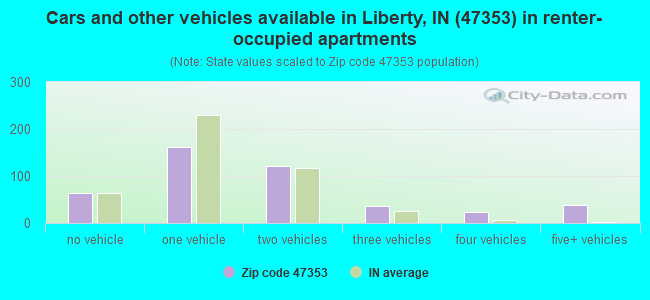
Houses and condos: 2,495 Renter-occupied apartments: 448
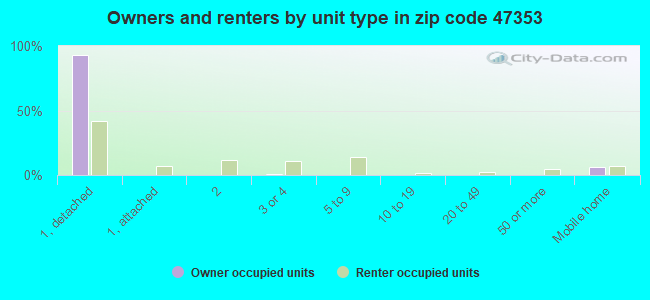
% of renters here:
20%
State:
29%
March 2022 cost of living index in zip code 47353: 85.2 (less than average, U.S. average is 100)
Land area: 124.5 sq. mi. Water area: 2.5 sq. mi.
Population density: 43 people per square mile
(very low).
OSM Map
General Map
Google Map
MSN Map
OSM Map
General Map
Google Map
MSN Map
OSM Map
General Map
Google Map
MSN Map
OSM Map
General Map
Google Map
MSN Map
Please wait while loading the map...
Real estate property taxes paid for housing units in 2022:
This zip code:
0.6% ($1,061)
Indiana:
0.7% ($1,467)
Median real estate property taxes paid for housing units with mortgages in 2022: $1,019 (0.6%) Median real estate property taxes paid for housing units with no mortgage in 2022: $1,177 (0.8%)
Business Search- 14 Million verified businesses
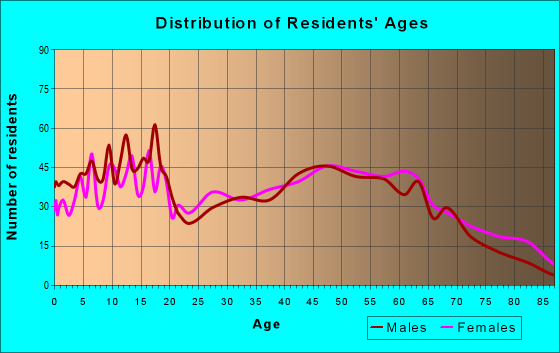
Males: 2,597
(49.0%)
Females: 2,701
(51.0%)
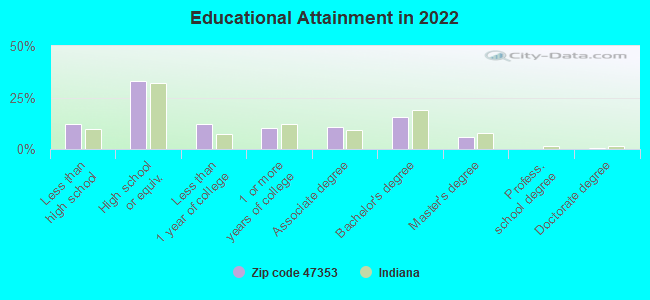
For population 25 years and over in 47353:
High school or higher: 87.8%
Bachelor's degree or higher: 21.7%
Graduate or professional degree: 6.4%
Unemployed: 4.3%
Mean travel time to work (commute): 26.3 minutes
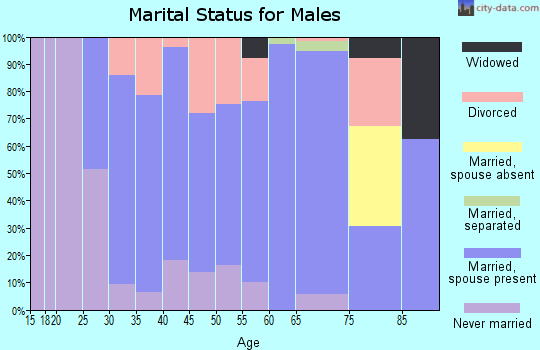
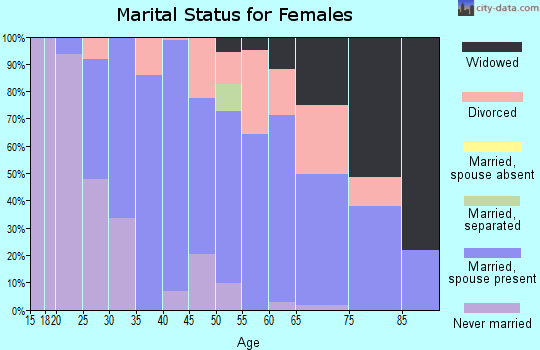
For population 15 years and over in 47353:
Never married: 22.6%
Now married: 62.9%
Separated: 0.6%
Widowed: 4.5%
Divorced: 9.4%
Zip code 47353 compared to state average:
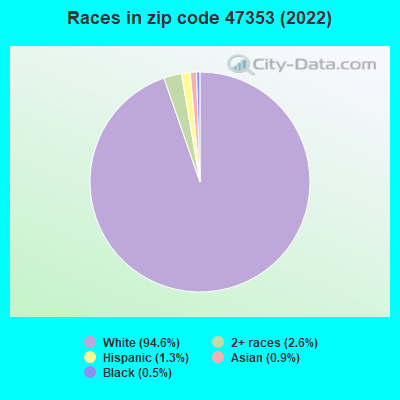
Black race population percentage significantly below state average.
Hispanic race population percentage significantly below state average.
Median age above state average.
Foreign-born population percentage significantly below state average.
Length of stay since moving in significantly above state average.
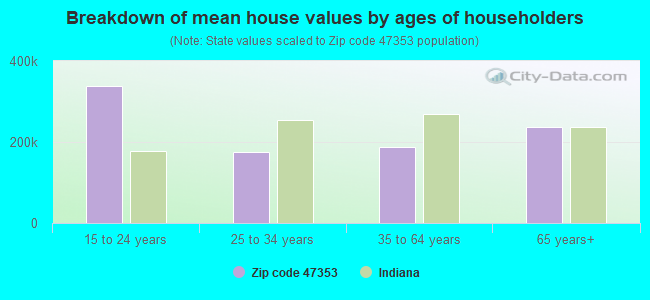
Estimated median house/condo value in 2022: $171,530
47353:
$171,530
Indiana:
$208,700
According to our research of Indiana and other state lists, there was 1 registered sex offender living in 47353 zip code as of April 24, 2024. The ratio of all residents to sex offenders in zip code 47353 is 5,800 to 1. The ratio of registered sex offenders to all residents in this zip code is much lower than the state average.
Median resident age:
This zip code:
43.8 years
Indiana median age:
38.2 years
Average household size:
This zip code:
2.3 people
Indiana:
2.4 people
Averages for the 2020 tax year for zip code 47353, filed in 2021:
Average Adjusted Gross Income (AGI) in 2020: $53,165 (Individual Income Tax Returns)
Here:
$53,165
State:
$64,978
Salary/wage: $46,141 (reported on 79.7% of returns)
Here:
$46,141
State:
$55,245
(% of AGI for various income ranges: 1165.6% for AGIs below $25k, 3646.0% for AGIs $25k-50k, 6656.7% for AGIs $50k-75k, 9708.4% for AGIs $75k-100k, 15852.2% for AGIs $100k-200k)
Taxable interest for individuals: $1,319 (reported on 29.3% of returns)
This zip code:
$1,319
Indiana:
$1,351
(% of AGI for various income ranges: 20.7% for AGIs below $25k, 50.2% for AGIs $25k-50k, 33.0% for AGIs $50k-75k, 131.6% for AGIs $75k-100k, 121.7% for AGIs $100k-200k)
Ordinary dividends: $3,013 (reported on 14.7% of returns)
Here:
$3,013
State:
$5,827
(% of AGI for various income ranges: 18.3% for AGIs below $25k, 27.5% for AGIs $25k-50k, 77.3% for AGIs $50k-75k, 64.2% for AGIs $75k-100k, 253.3% for AGIs $100k-200k)
Net capital gain/loss in AGI: +$6,531 (reported on 14.7% of returns)
Here:
+$6,531
State:
+$17,730
(% of AGI for various income ranges: 19.2% for AGIs below $25k, 40.4% for AGIs $25k-50k, 87.3% for AGIs $50k-75k, 185.8% for AGIs $75k-100k, 564.4% for AGIs $100k-200k)
Profit/loss from business: +$15,222 (reported on 13.5% of returns)
Here:
+$15,222
State:
+$12,144
(% of AGI for various income ranges: 132.4% for AGIs below $25k, 197.5% for AGIs $25k-50k, 233.3% for AGIs $50k-75k, 404.7% for AGIs $75k-100k, 1267.8% for AGIs $100k-200k)
Taxable individual retirement arrangement distribution: $14,362 (reported on 9.0% of returns)
47353:
$14,362
Indiana:
$18,302
(% of AGI for various income ranges: 54.1% for AGIs below $25k, 104.4% for AGIs $25k-50k, 129.7% for AGIs $50k-75k, 350.0% for AGIs $75k-100k, 873.9% for AGIs $100k-200k)
Total itemized deductions: $44,125 (reported on 1.5% of returns)
Here:
$44,125
State:
$35,601
(% of AGI for various income ranges: 980.6% for AGIs $100k-200k)
Charity contributions: $8,167 (reported on 1.1% of returns)
Here:
$8,167
State:
$15,596
(% of AGI for various income ranges: 128.9% for AGIs $75k-100k)
Taxes paid: $7,100 (reported on 1.5% of returns)
47353:
$7,100
State:
$7,542
(% of AGI for various income ranges: 157.8% for AGIs $100k-200k)
Earned income credit: $2,095 (reported on 14.7% of returns)
Here:
$2,095
State:
$2,298
(% of AGI for various income ranges: 83.6% for AGIs below $25k, 67.5% for AGIs $25k-50k)
Percentage of individuals using paid preparers for their 2020 taxes: 95.1%
Here:
95%
State:
94%
(% for various income ranges: 93.7% for AGIs below $25k, 95.3% for AGIs $25k-50k, 95.3% for AGIs $50k-75k, 96.4% for AGIs $75k-100k, 96.8% for AGIs $100k-200k, 100.0% for AGIs over 200k)
Averages for the 2012 tax year for zip code 47353, filed in 2013:
Average Adjusted Gross Income (AGI) in 2012: $42,729 (Individual Income Tax Returns)
Here:
$42,729
State:
$52,932
Salary/wage: $37,142 (reported on 80.9% of returns)
Here:
$37,142
State:
$45,173
(% of AGI for various income ranges: 66.9% for AGIs below $25k, 75.3% for AGIs $25k-50k, 77.4% for AGIs $50k-75k, 73.6% for AGIs $75k-100k, 79.1% for AGIs $100k-200k)
Taxable interest for individuals: $1,455 (reported on 31.7% of returns)
This zip code:
$1,455
Indiana:
$1,311
(% of AGI for various income ranges: 1.8% for AGIs below $25k, 1.1% for AGIs $25k-50k, 1.1% for AGIs $50k-75k, 0.6% for AGIs $75k-100k, 1.4% for AGIs $100k-200k, 0.2% for AGIs over 200k)
Ordinary dividends: $2,092 (reported on 14.5% of returns)
Here:
$2,092
State:
$4,690
(% of AGI for various income ranges: 1.2% for AGIs below $25k, 0.5% for AGIs $25k-50k, 0.7% for AGIs $50k-75k, 0.4% for AGIs $75k-100k, 1.1% for AGIs $100k-200k)
Net capital gain/loss in AGI: +$5,219 (reported on 11.8% of returns)
Here:
+$5,219
State:
+$10,406
(% of AGI for various income ranges: 0.6% for AGIs $25k-50k, 0.7% for AGIs $50k-75k, 0.4% for AGIs $75k-100k, 5.8% for AGIs $100k-200k)
Profit/loss from business: +$11,550 (reported on 16.8% of returns)
Here:
+$11,550
State:
+$11,105
(% of AGI for various income ranges: 8.0% for AGIs below $25k, 6.3% for AGIs $25k-50k, 3.4% for AGIs $50k-75k, 4.1% for AGIs $75k-100k, 4.1% for AGIs $100k-200k)
Taxable individual retirement arrangement distribution: $10,381 (reported on 9.9% of returns)
47353:
$10,381
Indiana:
$13,841
(% of AGI for various income ranges: 3.5% for AGIs below $25k, 2.1% for AGIs $25k-50k, 2.2% for AGIs $50k-75k, 3.4% for AGIs $75k-100k, 2.2% for AGIs $100k-200k)
Total itemized deductions: $17,876 (22% of AGI, reported on 19.1% of returns)
Here:
$17,876
State:
$20,913
Here:
22.1% of AGI
State:
18.2% of AGI
(% of AGI for various income ranges: 6.9% for AGIs below $25k, 6.2% for AGIs $25k-50k, 6.5% for AGIs $50k-75k, 10.0% for AGIs $75k-100k, 10.5% for AGIs $100k-200k, 8.7% for AGIs over 200k)
Charity contributions: $3,503 (reported on 11.5% of returns)
Here:
$3,503
State:
$4,697
(% of AGI for various income ranges: 0.5% for AGIs below $25k, 0.5% for AGIs $25k-50k, 0.6% for AGIs $50k-75k, 1.0% for AGIs $75k-100k, 2.5% for AGIs $100k-200k)
Taxes paid: $5,788 (reported on 19.1% of returns)
47353:
$5,788
State:
$7,456
(% of AGI for various income ranges: 1.2% for AGIs below $25k, 1.4% for AGIs $25k-50k, 1.8% for AGIs $50k-75k, 3.1% for AGIs $75k-100k, 4.5% for AGIs $100k-200k, 4.8% for AGIs over 200k)
Earned income credit: $2,230 (reported on 17.6% of returns)
Here:
$2,230
State:
$2,265
(% of AGI for various income ranges: 5.8% for AGIs below $25k, 1.2% for AGIs $25k-50k)
Percentage of individuals using paid preparers for their 2012 taxes: 65.6%
Here:
66%
State:
53%
(% for various income ranges: 60.0% for AGIs below $25k, 67.7% for AGIs $25k-50k, 71.1% for AGIs $50k-75k, 72.7% for AGIs $75k-100k, 70.6% for AGIs $100k-200k, 66.7% for AGIs over 200k)
Averages for the 2004 tax year for zip code 47353, filed in 2005:
Average Adjusted Gross Income (AGI) in 2004: $36,340 (Individual Income Tax Returns)
Here:
$36,340
State:
$44,790
Salary/wage: $33,206 (reported on 84.1% of returns)
Here:
$33,206
State:
$39,615
(% of AGI for various income ranges: 109.5% for AGIs below $10k, 73.2% for AGIs $10k-25k, 79.0% for AGIs $25k-50k, 83.4% for AGIs $50k-75k, 78.3% for AGIs $75k-100k, 56.2% for AGIs over 100k)
Taxable interest for individuals: $1,753 (reported on 44.1% of returns)
This zip code:
$1,753
Indiana:
$1,535
(% of AGI for various income ranges: 7.8% for AGIs below $10k, 3.7% for AGIs $10k-25k, 1.6% for AGIs $25k-50k, 1.6% for AGIs $50k-75k, 1.6% for AGIs $75k-100k, 2.7% for AGIs over 100k)
Taxable dividends: $2,174 (reported on 19.0% of returns)
Here:
$2,174
State:
$2,998
(% of AGI for various income ranges: 4.1% for AGIs below $10k, 1.5% for AGIs $10k-25k, 0.6% for AGIs $25k-50k, 0.7% for AGIs $50k-75k, 1.1% for AGIs $75k-100k, 2.3% for AGIs over 100k)
Net capital gain/loss: +$7,975 (reported on 16.9% of returns)
Here:
+$7,975
State:
+$8,619
(% of AGI for various income ranges: 1.4% for AGIs below $10k, 1.0% for AGIs $10k-25k, 1.5% for AGIs $25k-50k, 1.4% for AGIs $50k-75k, 3.7% for AGIs $75k-100k, 14.9% for AGIs over 100k)
Profit/loss from business: +$8,522 (reported on 17.1% of returns)
Here:
+$8,522
State:
+$10,071
(% of AGI for various income ranges: 6.1% for AGIs below $10k, 4.6% for AGIs $10k-25k, 6.0% for AGIs $25k-50k, 3.3% for AGIs $50k-75k, 2.4% for AGIs $75k-100k, 2.8% for AGIs over 100k)
Profit/loss from farming: +$3,198 (reported on 6.2% of returns)
Here:
+$3,198
State:
-$2,212
(% of AGI for various income ranges: -7.1% for AGIs below $10k, 1.5% for AGIs $10k-25k, -0.8% for AGIs $25k-50k, 1.3% for AGIs $50k-75k, 2.1% for AGIs $75k-100k)
IRA payment deduction: $3,057 (reported on 2.7% of returns)
47353:
$3,057
Indiana:
$2,840
Total itemized deductions: $14,868 (24% of AGI, reported on 23.7% of returns)
Here:
$14,868
State:
$17,065
Here:
23.9% of AGI
State:
19.5% of AGI
(% of AGI for various income ranges: 8.1% for AGIs below $10k, 7.2% for AGIs $10k-25k, 9.5% for AGIs $25k-50k, 9.7% for AGIs $50k-75k, 11.3% for AGIs $75k-100k, 10.5% for AGIs over 100k)
Charity contributions deductions: $2,372 (4% of AGI, reported on 16.1% of returns)
Here:
$2,372
State:
$3,550
Here:
3.5% of AGI
State:
3.8% of AGI
(% of AGI for various income ranges: 0.7% for AGIs below $10k, 0.6% for AGIs $10k-25k, 0.8% for AGIs $25k-50k, 1.2% for AGIs $50k-75k, 1.3% for AGIs $75k-100k, 1.3% for AGIs over 100k)
Total tax: $4,323 (reported on 75.0% of returns)
47353:
$4,323
State:
$6,914
(% of AGI for various income ranges: 3.8% for AGIs below $10k, 4.2% for AGIs $10k-25k, 6.9% for AGIs $25k-50k, 8.5% for AGIs $50k-75k, 10.8% for AGIs $75k-100k, 15.7% for AGIs over 100k)
Earned income credit: $1,562 (reported on 14.2% of returns)
Here:
$1,562
State:
$1,685
Percentage of individuals using paid preparers for their 2004 taxes: 69.7%
Here:
70%
State:
59%
(% for various income ranges: 62.3% for AGIs below $10k, 72.3% for AGIs $10k-25k, 72.8% for AGIs $25k-50k, 67.0% for AGIs $50k-75k, 73.7% for AGIs $75k-100k, 80.0% for AGIs over 100k)
Likely homosexual households (counted as self-reported same-sex unmarried-partner households)
Lesbian couples: 0.4% of all households
Gay men: 0.0% of all households
Household received Food Stamps/SNAP in the past 12 months: 103 Household did not receive Food Stamps/SNAP in the past 12 months: 2,161
Women who had a birth in the past 12 months: 16 (2 now married, 12 unmarried) Women who did not have a birth in the past 12 months: 1,156 (715 now married, 444 unmarried)
Housing units in zip code 47353 with a mortgage: 1,104 (142 second mortgage, 76 both second mortgage and home equity loan) Houses without a mortgage: 24
Median monthly owner costs for units with a mortgage: $1,123 Median monthly owner costs for units without a mortgage: $477
Residents with income below the poverty level in 2022:
This zip code:
6.9%
Whole state:
12.6%
Residents with income below 50% of the poverty level in 2022:
This zip code:
3.6%
Whole state:
6.3%
Median number of rooms in houses and condos:
Here:
7.0
State:
6.6
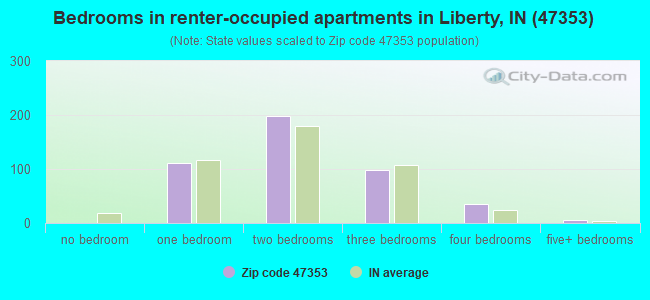
Median number of rooms in apartments:
Here:
4.7
State:
4.3
Notable locations in this zip code not listed on our city pages
Churches in zip code 47353 include: Fourmile Church (A), Hanna Creek Church (B), Mount Pleasant Church (C), Salem Church (D), Sugar Grove Church (E). Display/hide their locations on the map
Cemeteries: West Point Cemetery (1), Railsback Cemetery (2), Sering Cemetery (3), Drook Cemetery (4), Silver Creek Cemetery (5), Keiffer Cemetery (6), Pentecost Cemetery (7). Display/hide their locations on the map
Streams, rivers, and creeks: Sand Run (A), Square Run (B), Turkey Creek (C), Bath Creek (D), Kitchel Creek (E), Richland Creek (F), Harold Creek (G), Salem Branch (H), Goodwins Creek (I). Display/hide their locations on the map
In group quarters: 59 (-1 institutionalized population)
Size of family households: 862 2-persons, 306 3-persons, 353 4-persons, 39 5-persons, 43 6-persons
Size of nonfamily households: 589 1-person, 70 2-persons
669 married couples with children.
148 single-parent households (56 men, 92 women).
97.9% of residents of 47353 zip code speak English at home.
0.7% of residents speak Spanish at home (47% very well, 11% well, 42% not well).
0.5% of residents speak Asian or Pacific Island language at home (14% very well, 86% well).
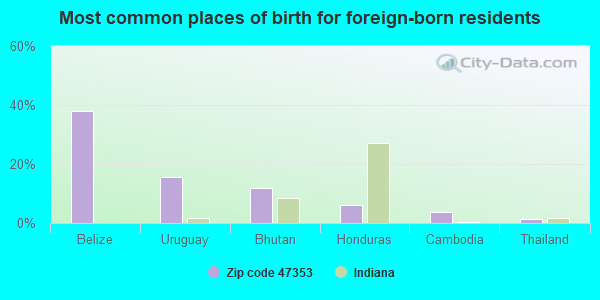
Foreign born population: 83 (1.6%) (28.3% of them are naturalized citizens)
This zip code:
1.6%
Whole state:
6.1%
38%Belize
15%Uruguay
12%Bhutan
6%Honduras
4%Cambodia
1%Thailand
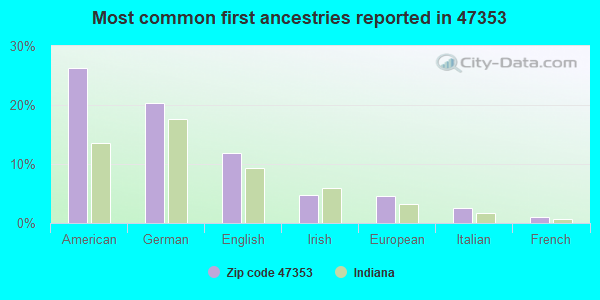
26%American
20%German
12%English
5%Irish
5%European
2%Italian
1%French
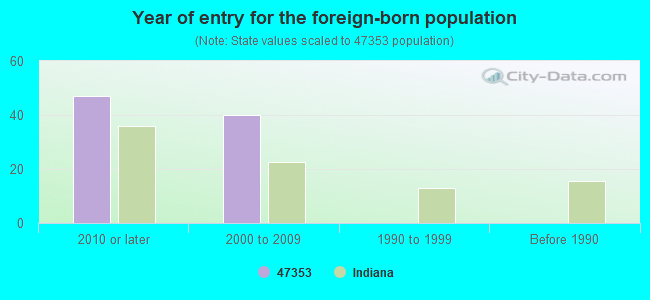
Year of entry for the foreign-born population
472010 or later
402000 to 2009
01990 to 1999
0Before 1990
Facilities with environmental interests located in this zip code:
D & L PAINT CO (215 BROWNSVILLE AVE in LIBERTY, IN)
AIR MINOR (AIRS/AFS) STATE MASTER (Indiana facility tracking) - CRTK-6928, EPCRA National Pollutant Discharge Elimination System NON-MAJOR (Tracking pollutant discharge elimination systems) - permit HAZARDOUS WASTE BIENNIAL REPORTER (Resource Conservation and Recovery Act (tracking hazardous waste)) Large Quantity Generators, more that 1000 kg of hazardous waste/month (Resource Conservation and Recovery Act (tracking hazardous waste)) - notification TRI REPORTER (Tracking of toxic chemicals releasing facilities) Business SIC classification: PAINTS, VARNISHES, LACQUERS, ENAMELS, AND ALLIED PRODUCTS Organizations: BOMBEN, EMANUELE L (CONTACT/OPERATOR)
, UNKNOWN (CONTACT/OPERATOR)
, D&L INDUSTRIAL FINISHES (CONTACT/OWNER)
Alternative names: D & L INDUSTRIAL FINISHERS, D & L INDUSTRIAL FINISHES INC
ROYSTER CLARK INC (3477 E KITCHELL RD in LIBERTY, IN)
STATE MASTER (Indiana facility tracking) - CRTK-21661, EPCRA, CRTK-706, UST-9175, UNDERGROUND STORAGE TANK PROGRAM (Resource Conservation and Recovery Act (tracking hazardous waste)) Organizations: KAISER ESTECH (CONTACT/OWNER)
Alternative names: KAISER AGRICULTURAL CHEMICALS, KAISER ESTECH, LIBERTY, IN 784
ROYSTER CLARK AGRICULTURE (SR 101 S in LIBERTY, IN)
STATE MASTER (Indiana facility tracking) - UST-9181, UNDERGROUND STORAGE TANK PROGRAM (Resource Conservation and Recovery Act (tracking hazardous waste)) Organizations: KAISER ESTECH (CONTACT/OWNER)
Alternative names: KAISER ESTECH
ROYSTER CLARK INC (2281 W SR 44 in LIBERTY, IN)
STATE MASTER (Indiana facility tracking) - CRTK-704, EPCRA (Resource Conservation and Recovery Act (tracking hazardous waste)) Organizations: KAISER ESTECH (CONTACT/OWNER)
Alternative names: KAISER ESTECH
LIBERTY MUNICIPAL WWTP (704 N DEWEY ST in LIBERTY, IN)
STATE MASTER (Indiana facility tracking) - CRTK-6289, EPCRA National Pollutant Discharge Elimination System NON-MAJOR (Tracking pollutant discharge elimination systems) - permit Business SIC classification: SEWERAGE SYSTEMS Organizations: DAVID WOESTE CERT OPER (CONTACT/OPERATOR)
, TOWN COUNCIL PRESIDENT (CONTACT/OWNER)
Alternative names: LIBERTY MUNICIPAL STP
CSX TRANSPORTATION (US 27 in COTTAGEGROVE, IN)
STATE MASTER (Indiana facility tracking) - LUST-199306551, LEAKING STORAGE TANK, UST-19576, UNDERGROUND STORAGE TANK PROGRAM Conditionally Exempt Small Quantity Generators, less than 100 kg/month of hazardous waste (Resource Conservation and Recovery Act (tracking hazardous waste)) - notification Organizations: CSX TRANSPORTATION INC (CONTACT/OWNER)
LIBERTY ELEMENTARY SCHOOL (501 EATON ST in LIBERTY, IN)
(National Center for Education Statistics) - STATE ID-8209 Organizations: UNION CO/CLG CORNER JOINT SCH DIST (SCHOOL DISTRICT)
LIBERTY MILLS INC (RT 4 in LIBERTY, IN)
STATE MASTER (Indiana facility tracking) COMPLIANCE ACTIVITY (Tracking inspections of insecticide, fungicide, and rodenticide, and toxic substances)
Housing units lacking complete plumbing facilities: 4.0% Housing units lacking complete kitchen facilities: 4.9%
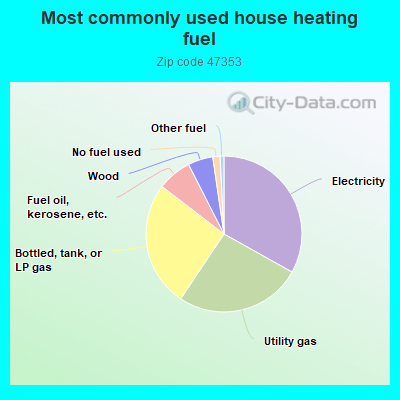
33.2%Electricity
26.3%Utility gas
26.1%Bottled, tank, or LP gas
7.1%Fuel oil, kerosene, etc.
5.2%Wood
1.5%No fuel used
0.8%Other fuel
Population in 1990: 6,126.
Place of birth for U.S.-born residents:
This state: 2,307
Northeast: 195
Midwest: 2,196
South: 435
West: 78
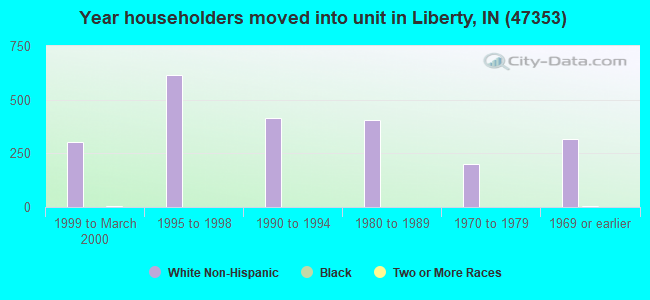
66% of the 47353 zip code residents lived in the same house 5 years ago. Out of people who lived in different houses, 52% lived in this county. Out of people who lived in different counties, 50% lived in Indiana.
89% of the 47353 zip code residents lived in the same house 1 year ago. Out of people who lived in different houses, 69% moved from this county. Out of people who lived in different houses, 17% moved from different county within same state. Out of people who lived in different houses, 12% moved from different state.
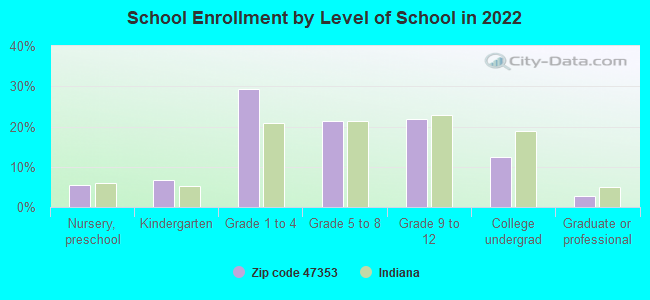
Private vs. public school enrollment:
Students in private schools in grades 1 to 8 (elementary and middle school): 73
Here:
14.7%
Indiana:
14.9%
Students in private schools in grades 9 to 12 (high school):
Here:
0.0%
Indiana:
11.4%
Students in private undergraduate colleges: 4
Here:
3.9%
Indiana:
22.3%
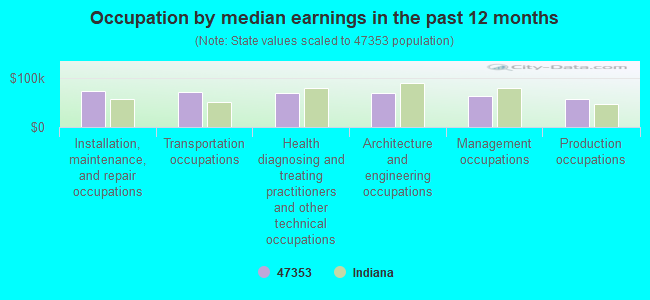
Occupation by median earnings in the past 12 months ($)
72,600Installation, maintenance, and repair occupations
71,150Transportation occupations
68,461Health diagnosing and treating practitioners and other technical occupations
68,314Architecture and engineering occupations
61,757Management occupations
57,511Production occupations
Top industries in this zip code by the number of employees in 2005:
Wholesale Trade: Other Miscellaneous Durable Goods Merchant Wholesalers (20-49: 1)
Health Care and Social Assistance: Services for the Elderly and Persons with Disabilities (20-49: 1)
People in group quarters in 2010:
44 people in nursing facilities/skilled-nursing facilities
18 people in local jails and other municipal confinement facilities
5 people in group homes intended for adults
People in group quarters in 2000:
53 people in nursing homes
13 people in local jails and other confinement facilities (including police lockups)
12 people in homes for the mentally retarded
Fatal accident statistics in 2014:
Fatal accident count: 1
Vehicles involved in fatal accidents: 2
Fatal accidents caused by drunken drivers: 0
Fatalities: 1
Persons involved in fatal accidents: 2
Pedestrians involved in fatal accidents: 0
Fatal accident statistics in 2013:
Fatal accident count: 2
Vehicles involved in fatal accidents: 2
Fatal accidents caused by drunken drivers: 0
Fatalities: 2
Persons involved in fatal accidents: 2
Pedestrians involved in fatal accidents: 1
2003 - 2018 National Fire Incident Reporting System (NFIRS) incidents
According to the data from the years 2003 - 2018 the average number of fire incidents per year is 10. The highest number of reported fire incidents - 25 took place in 2007, and the least - 0 in 2016. The data has a decreasing trend.
When looking into fire subcategories, the most reports belonged to: Structure Fires (44.5%), and Outside Fires (28.7%).
Fire incident types reported to NFIRS in Zip Code 47353


+$3,198
-$2,212
(% of AGI for various income ranges: -7.1% for AGIs below $10k, 1.5% for AGIs $10k-25k, -0.8% for AGIs $25k-50k, 1.3% for AGIs $50k-75k, 2.1% for AGIs $75k-100k) Nearest zip codes: 47003, 47325, 47324, 45003, 47010, 47330.
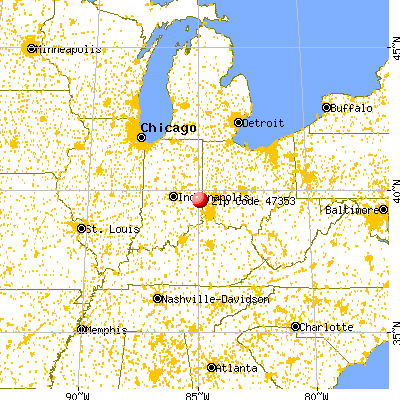


 According to the data from the years 2003 - 2018 the average number of fire incidents per year is 10. The highest number of reported fire incidents - 25 took place in 2007, and the least - 0 in 2016. The data has a decreasing trend.
 When looking into fire subcategories, the most reports belonged to: Structure Fires (44.5%), and Outside Fires (28.7%).