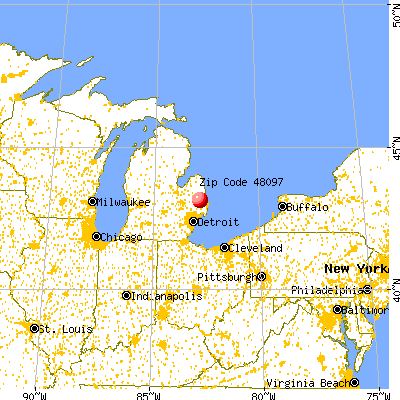
Estimated zip code population in 2022: 5,320 Zip code population in 2010: 5,499 Zip code population in 2000: 5,418
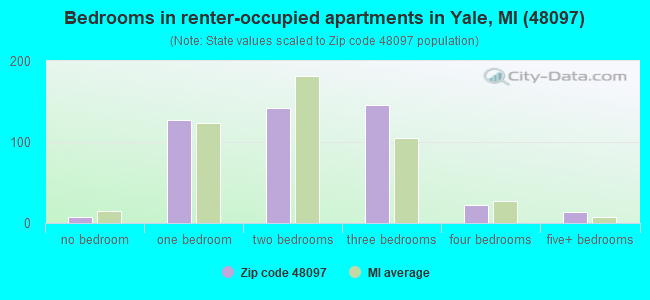
Houses and condos: 2,306 Renter-occupied apartments: 460
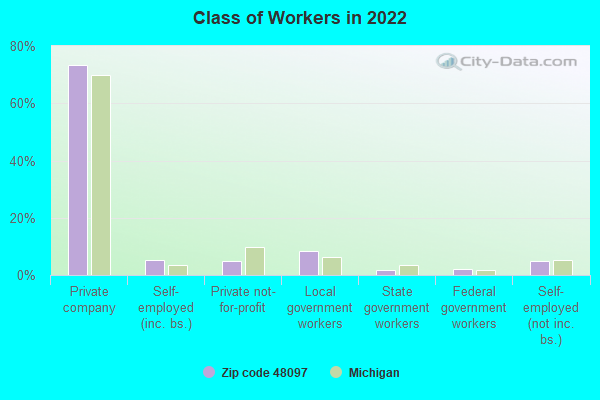
% of renters here:
21%
State:
27%
March 2022 cost of living index in zip code 48097: 90.7 (less than average, U.S. average is 100)
Land area: 76.3 sq. mi. Water area: 0.6 sq. mi.
Population density: 70 people per square mile
(very low).
OSM Map
General Map
Google Map
MSN Map
OSM Map
General Map
Google Map
MSN Map
OSM Map
General Map
Google Map
MSN Map
OSM Map
General Map
Google Map
MSN Map
Please wait while loading the map...
Real estate property taxes paid for housing units in 2022:
This zip code:
1.1% ($2,131)
Michigan:
1.2% ($2,746)
Median real estate property taxes paid for housing units with mortgages in 2022: $2,301 (1.2%) Median real estate property taxes paid for housing units with no mortgage in 2022: $1,875 (1.1%)
Business Search- 14 Million verified businesses
Males: 2,684
(50.5%)
Females: 2,636
(49.5%)
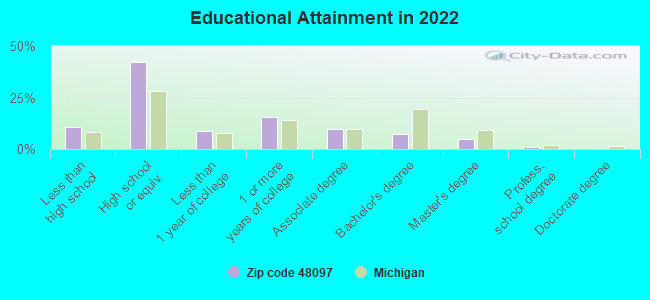
For population 25 years and over in 48097:
High school or higher: 88.9%
Bachelor's degree or higher: 12.9%
Graduate or professional degree: 5.6%
Unemployed: 9.6%
Mean travel time to work (commute): 37.2 minutes
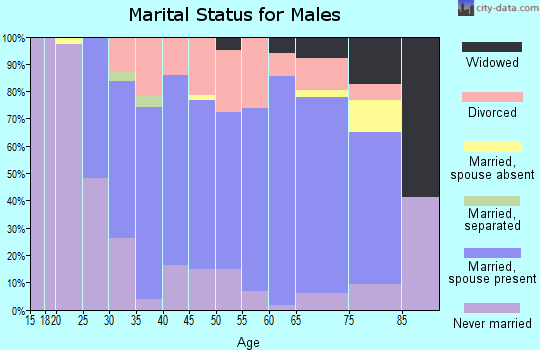
For population 15 years and over in 48097:
Never married: 30.7%
Now married: 49.6%
Separated: 0.7%
Widowed: 7.0%
Divorced: 12.0%
Zip code 48097 compared to state average:
Unemployed percentage above state average.
Black race population percentage significantly below state average.
Hispanic race population percentage below state average.
Foreign-born population percentage significantly below state average.
Percentage of population with a bachelor's degree or higher significantly below state average.
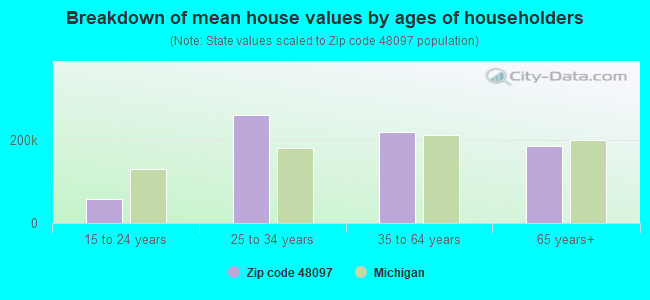
Estimated median house/condo value in 2022: $186,126
48097:
$186,126
Michigan:
$224,400
According to our research of Michigan and other state lists, there were 12 registered sex offenders living in 48097 zip code as of April 23, 2024. The ratio of all residents to sex offenders in zip code 48097 is 439 to 1. The ratio of registered sex offenders to all residents in this zip code is lower than the state average.
Median resident age:
This zip code:
41.9 years
Michigan median age:
40.3 years
Average household size:
This zip code:
2.4 people
Michigan:
2.4 people
Averages for the 2020 tax year for zip code 48097, filed in 2021:
Average Adjusted Gross Income (AGI) in 2020: $50,211 (Individual Income Tax Returns)
Here:
$50,211
State:
$68,945
Salary/wage: $45,944 (reported on 77.5% of returns)
Here:
$45,944
State:
$57,142
(% of AGI for various income ranges: 834.1% for AGIs below $25k, 3218.2% for AGIs $25k-50k, 6072.7% for AGIs $50k-75k, 9250.0% for AGIs $75k-100k, 13512.0% for AGIs $100k-200k)
Taxable interest for individuals: $821 (reported on 26.1% of returns)
This zip code:
$821
Michigan:
$1,630
(% of AGI for various income ranges: 9.8% for AGIs below $25k, 15.3% for AGIs $25k-50k, 37.0% for AGIs $50k-75k, 24.2% for AGIs $75k-100k, 102.5% for AGIs $100k-200k)
Ordinary dividends: $2,303 (reported on 11.9% of returns)
Here:
$2,303
State:
$6,972
(% of AGI for various income ranges: 15.7% for AGIs below $25k, 17.1% for AGIs $25k-50k, 59.0% for AGIs $50k-75k, 48.9% for AGIs $75k-100k, 117.5% for AGIs $100k-200k)
Net capital gain/loss in AGI: +$4,275 (reported on 11.1% of returns)
Here:
+$4,275
State:
+$20,064
(% of AGI for various income ranges: 3.3% for AGIs below $25k, 30.0% for AGIs $25k-50k, 99.3% for AGIs $50k-75k, 102.1% for AGIs $75k-100k, 265.5% for AGIs $100k-200k)
Profit/loss from business: +$7,066 (reported on 12.6% of returns)
Here:
+$7,066
State:
+$11,172
(% of AGI for various income ranges: 103.8% for AGIs below $25k, 106.9% for AGIs $25k-50k, 117.3% for AGIs $50k-75k, 134.2% for AGIs $75k-100k, 227.5% for AGIs $100k-200k)
Taxable individual retirement arrangement distribution: $15,142 (reported on 9.5% of returns)
48097:
$15,142
Michigan:
$19,803
(% of AGI for various income ranges: 58.7% for AGIs below $25k, 74.3% for AGIs $25k-50k, 192.0% for AGIs $50k-75k, 316.8% for AGIs $75k-100k, 853.5% for AGIs $100k-200k)
Total itemized deductions: $26,160 (reported on 2.0% of returns)
Here:
$26,160
State:
$34,117
(% of AGI for various income ranges: 118.4% for AGIs $25k-50k, 352.0% for AGIs $100k-200k)
Charity contributions: $2,633 (reported on 1.2% of returns)
Here:
$2,633
State:
$13,548
(% of AGI for various income ranges: 26.3% for AGIs $50k-75k)
Taxes paid: $7,040 (reported on 2.0% of returns)
48097:
$7,040
State:
$7,972
(% of AGI for various income ranges: 25.5% for AGIs $25k-50k, 111.0% for AGIs $100k-200k)
Earned income credit: $2,261 (reported on 14.2% of returns)
Here:
$2,261
State:
$2,251
(% of AGI for various income ranges: 74.4% for AGIs below $25k, 67.6% for AGIs $25k-50k)
Percentage of individuals using paid preparers for their 2020 taxes: 94.5%
Here:
94%
State:
93%
(% for various income ranges: 93.4% for AGIs below $25k, 93.8% for AGIs $25k-50k, 95.0% for AGIs $50k-75k, 96.2% for AGIs $75k-100k, 96.3% for AGIs $100k-200k, 100.0% for AGIs over 200k)
Averages for the 2012 tax year for zip code 48097, filed in 2013:
Average Adjusted Gross Income (AGI) in 2012: $42,808 (Individual Income Tax Returns)
Here:
$42,808
State:
$55,609
Salary/wage: $38,768 (reported on 82.8% of returns)
Here:
$38,768
State:
$46,782
(% of AGI for various income ranges: 66.5% for AGIs below $25k, 73.4% for AGIs $25k-50k, 78.4% for AGIs $50k-75k, 82.8% for AGIs $75k-100k, 89.4% for AGIs $100k-200k)
Taxable interest for individuals: $1,003 (reported on 28.9% of returns)
This zip code:
$1,003
Michigan:
$1,491
(% of AGI for various income ranges: 1.3% for AGIs below $25k, 0.8% for AGIs $25k-50k, 0.6% for AGIs $50k-75k, 0.3% for AGIs $75k-100k, 0.7% for AGIs $100k-200k)
Ordinary dividends: $1,503 (reported on 14.7% of returns)
Here:
$1,503
State:
$6,225
(% of AGI for various income ranges: 0.9% for AGIs below $25k, 0.7% for AGIs $25k-50k, 0.6% for AGIs $50k-75k, 0.2% for AGIs $75k-100k, 0.5% for AGIs $100k-200k)
Net capital gain/loss in AGI: +$2,471 (reported on 9.1% of returns)
Here:
+$2,471
State:
+$9,326
(% of AGI for various income ranges: 0.5% for AGIs $50k-75k, 0.3% for AGIs $75k-100k, 1.7% for AGIs $100k-200k)
Profit/loss from business: +$8,097 (reported on 12.5% of returns)
Here:
+$8,097
State:
+$11,523
(% of AGI for various income ranges: 6.5% for AGIs below $25k, 2.5% for AGIs $25k-50k, 1.3% for AGIs $50k-75k, 0.2% for AGIs $75k-100k, 3.2% for AGIs $100k-200k)
Taxable individual retirement arrangement distribution: $9,041 (reported on 11.6% of returns)
48097:
$9,041
Michigan:
$15,298
(% of AGI for various income ranges: 4.1% for AGIs below $25k, 1.6% for AGIs $25k-50k, 2.6% for AGIs $50k-75k, 1.8% for AGIs $75k-100k, 3.3% for AGIs $100k-200k)
Total itemized deductions: $17,407 (21% of AGI, reported on 24.6% of returns)
Here:
$17,407
State:
$21,628
Here:
21.3% of AGI
State:
18.4% of AGI
(% of AGI for various income ranges: 6.0% for AGIs below $25k, 6.9% for AGIs $25k-50k, 10.7% for AGIs $50k-75k, 12.2% for AGIs $75k-100k, 14.7% for AGIs $100k-200k)
Charity contributions: $2,324 (reported on 19.4% of returns)
Here:
$2,324
State:
$4,225
(% of AGI for various income ranges: 0.4% for AGIs below $25k, 0.5% for AGIs $25k-50k, 1.0% for AGIs $50k-75k, 1.2% for AGIs $75k-100k, 2.1% for AGIs $100k-200k)
Taxes paid: $5,633 (reported on 24.6% of returns)
48097:
$5,633
State:
$8,327
(% of AGI for various income ranges: 1.2% for AGIs below $25k, 1.5% for AGIs $25k-50k, 3.2% for AGIs $50k-75k, 3.8% for AGIs $75k-100k, 6.0% for AGIs $100k-200k)
Earned income credit: $2,100 (reported on 19.0% of returns)
Here:
$2,100
State:
$2,306
(% of AGI for various income ranges: 5.8% for AGIs below $25k, 1.3% for AGIs $25k-50k)
Percentage of individuals using paid preparers for their 2012 taxes: 62.5%
Here:
62%
State:
57%
(% for various income ranges: 58.8% for AGIs below $25k, 64.8% for AGIs $25k-50k, 63.9% for AGIs $50k-75k, 65.0% for AGIs $75k-100k, 77.8% for AGIs $100k-200k)
Averages for the 2004 tax year for zip code 48097, filed in 2005:
Average Adjusted Gross Income (AGI) in 2004: $40,025 (Individual Income Tax Returns)
Here:
$40,025
State:
$48,204
Salary/wage: $38,528 (reported on 84.9% of returns)
Here:
$38,528
State:
$42,791
(% of AGI for various income ranges: 100.1% for AGIs below $10k, 74.0% for AGIs $10k-25k, 77.3% for AGIs $25k-50k, 86.4% for AGIs $50k-75k, 87.4% for AGIs $75k-100k, 76.5% for AGIs over 100k)
Taxable interest for individuals: $1,110 (reported on 47.3% of returns)
This zip code:
$1,110
Michigan:
$1,725
(% of AGI for various income ranges: 9.8% for AGIs below $10k, 3.3% for AGIs $10k-25k, 1.5% for AGIs $25k-50k, 1.0% for AGIs $50k-75k, 0.7% for AGIs $75k-100k, 0.5% for AGIs over 100k)
Taxable dividends: $1,071 (reported on 18.7% of returns)
Here:
$1,071
State:
$3,420
(% of AGI for various income ranges: 3.9% for AGIs below $10k, 0.9% for AGIs $10k-25k, 0.5% for AGIs $25k-50k, 0.3% for AGIs $50k-75k, 0.4% for AGIs $75k-100k, 0.4% for AGIs over 100k)
Net capital gain/loss: +$5,985 (reported on 14.3% of returns)
Here:
+$5,985
State:
+$8,532
(% of AGI for various income ranges: -4.0% for AGIs below $10k, 0.7% for AGIs $10k-25k, 1.8% for AGIs $25k-50k, 1.2% for AGIs $50k-75k, 1.5% for AGIs $75k-100k, 5.6% for AGIs over 100k)
Profit/loss from business: +$6,481 (reported on 13.5% of returns)
Here:
+$6,481
State:
+$9,547
(% of AGI for various income ranges: 4.3% for AGIs below $10k, 3.0% for AGIs $10k-25k, 2.4% for AGIs $25k-50k, 1.0% for AGIs $50k-75k, 1.3% for AGIs $75k-100k, 3.8% for AGIs over 100k)
IRA payment deduction: $2,855 (reported on 3.0% of returns)
48097:
$2,855
Michigan:
$2,875
(% of AGI for various income ranges: 0.3% for AGIs $10k-25k, 0.3% for AGIs $25k-50k, 0.2% for AGIs $50k-75k, 0.3% for AGIs $75k-100k)
Total itemized deductions: $15,976 (23% of AGI, reported on 34.3% of returns)
Here:
$15,976
State:
$18,509
Here:
23.5% of AGI
State:
20.7% of AGI
(% of AGI for various income ranges: 9.2% for AGIs below $10k, 7.2% for AGIs $10k-25k, 13.2% for AGIs $25k-50k, 15.4% for AGIs $50k-75k, 13.7% for AGIs $75k-100k, 15.0% for AGIs over 100k)
Charity contributions deductions: $1,993 (3% of AGI, reported on 29.7% of returns)
Here:
$1,993
State:
$3,365
Here:
2.8% of AGI
State:
3.6% of AGI
(% of AGI for various income ranges: 0.3% for AGIs below $10k, 0.7% for AGIs $10k-25k, 1.4% for AGIs $25k-50k, 1.4% for AGIs $50k-75k, 1.7% for AGIs $75k-100k, 1.9% for AGIs over 100k)
Total tax: $4,742 (reported on 73.7% of returns)
48097:
$4,742
State:
$7,691
(% of AGI for various income ranges: 3.4% for AGIs below $10k, 3.9% for AGIs $10k-25k, 6.0% for AGIs $25k-50k, 7.6% for AGIs $50k-75k, 10.1% for AGIs $75k-100k, 14.5% for AGIs over 100k)
Earned income credit: $1,644 (reported on 12.4% of returns)
Here:
$1,644
State:
$1,737
Percentage of individuals using paid preparers for their 2004 taxes: 66.7%
Here:
67%
State:
60%
(% for various income ranges: 59.8% for AGIs below $10k, 67.1% for AGIs $10k-25k, 70.9% for AGIs $25k-50k, 69.0% for AGIs $50k-75k, 67.5% for AGIs $75k-100k, 66.2% for AGIs over 100k)
Likely homosexual households (counted as self-reported same-sex unmarried-partner households)
Lesbian couples: 0.1% of all households
Gay men: 0.0% of all households
Household received Food Stamps/SNAP in the past 12 months: 334 Household did not receive Food Stamps/SNAP in the past 12 months: 1,877
Women who had a birth in the past 12 months: 61 (31 now married, 29 unmarried) Women who did not have a birth in the past 12 months: 1,055 (464 now married, 589 unmarried)
Housing units in zip code 48097 with a mortgage: 1,081 (105 second mortgage, 84 both second mortgage and home equity loan) Houses without a mortgage: 30
Median monthly owner costs for units with a mortgage: $1,199 Median monthly owner costs for units without a mortgage: $534
Residents with income below the poverty level in 2022:
This zip code:
16.2%
Whole state:
13.4%
Residents with income below 50% of the poverty level in 2022:
This zip code:
7.7%
Whole state:
6.9%
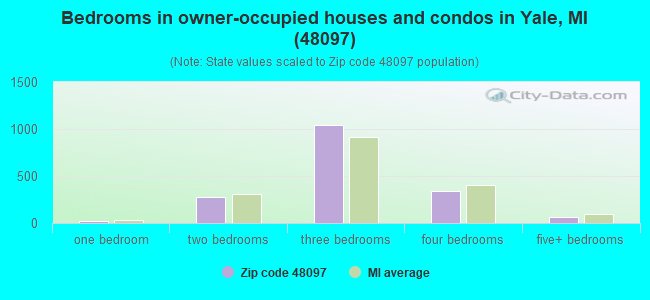
Median number of rooms in houses and condos:
Here:
6.4
State:
6.5
Median number of rooms in apartments:
Here:
4.9
State:
4.3
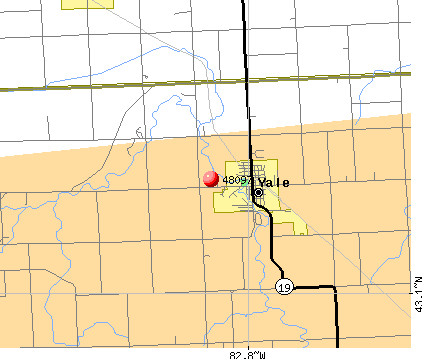
Notable locations in this zip code not listed on our city pages
Notable locations in zip code 48097: Tri - Hospital Emergency Medical Services Station 6 (A), Yale Fire Department (B), Yale Public Library (C), Yale City Police Department (D), Brockway Township Fire Station One (E), Brockway Township Fire Department (F). Display/hide their locations on the map
Churches in zip code 48097 include: Cole Church (A), Sacred Heart Church (B), Trinity Missionary Church (C), Yale United Methodist Church (D), Presbyterian Church (E), Emanuel Redeemer Evangelical Lutheran Church (F). Display/hide their locations on the map
Cemeteries: Sacred Heart Cemetery (1), Moore Cemetery (2), McFadden Cemetery (3), Elmwood Cemetery (4), Lynn Township Cemetery (5). Display/hide their locations on the map
Streams, rivers, and creeks: Meharg Drain (A), Jackson Creek (B), Thompson Drain (C), Thody Drain (D), South Branch Mill Creek (E), Sheehy Drain (F), North Branch Mill Creek (G). Display/hide their locations on the map
Parks in zip code 48097 include: Yale Park (1), Cole United Methodist Church Historical Marker (2), James McColl House Historical Marker (3). Display/hide their locations on the map
In group quarters: 102 (-1 institutionalized population)
Size of family households: 630 2-persons, 349 3-persons, 302 4-persons, 156 5-persons, 34 6-persons, 9 7-or-more-persons
Size of nonfamily households: 561 1-person, 148 2-persons, 8 3-persons
623 married couples with children.
384 single-parent households (169 men, 215 women).
97.1% of residents of 48097 zip code speak English at home.
1.0% of residents speak Spanish at home (67% very well, 33% well).
0.8% of residents speak other Indo-European language at home (93% very well, 7% well).
0.4% of residents speak Asian or Pacific Island language at home (100% very well).
0.2% of residents speak other language at home (12% very well, 62% not well, 25% not at all).
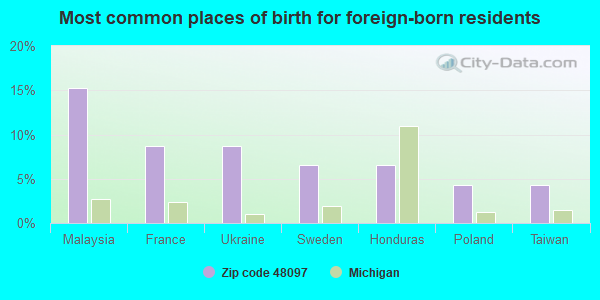
Foreign born population: 92 (1.7%) (65.3% of them are naturalized citizens)
This zip code:
1.7%
Whole state:
6.9%
15%Malaysia
9%France
9%Ukraine
7%Sweden
7%Honduras
4%Poland
4%Taiwan
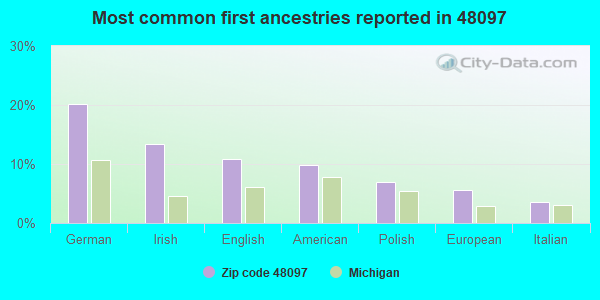
20%German
13%Irish
11%English
10%American
7%Polish
6%European
4%Italian
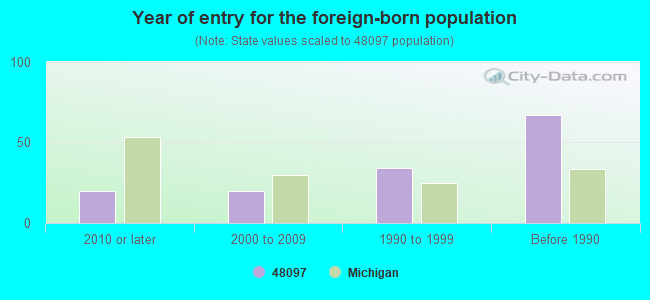
Year of entry for the foreign-born population
202010 or later
202000 to 2009
341990 to 1999
67Before 1990
Private elementary/middle school in in this zip code not listed on the city page:
Facilities with environmental interests located in this zip code:
MI DEPT/ENVIRONMENTAL QUALITY (9 NORTH STREET in YALE, MI)
Conditionally Exempt Small Quantity Generators, less than 100 kg/month of hazardous waste (Resource Conservation and Recovery Act (tracking hazardous waste)) Organizations: TIMOTHY J. BROWN TRUSTEE (CONTACT/OPERATOR)
, MI DEPT/ENVIRONMENTAL QUALITY - RRD (CONTACT/OWNER)
Alternative names: YALE UNITED METHODIST CHURCH
Housing units lacking complete plumbing facilities: 2.1% Housing units lacking complete kitchen facilities: 2.3%
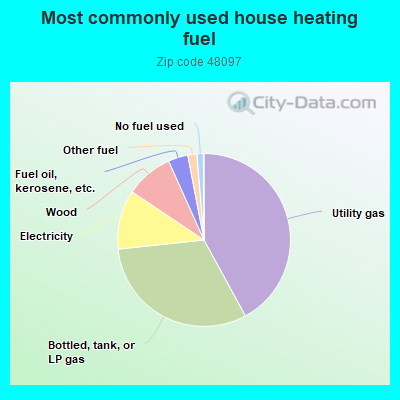
42.1%Utility gas
31.3%Bottled, tank, or LP gas
11.1%Electricity
8.9%Wood
3.7%Fuel oil, kerosene, etc.
1.7%Other fuel
1.2%No fuel used
Population in 1990: 5,665.
Place of birth for U.S.-born residents:
This state: 4,817
Northeast: 35
Midwest: 100
South: 142
West: 62
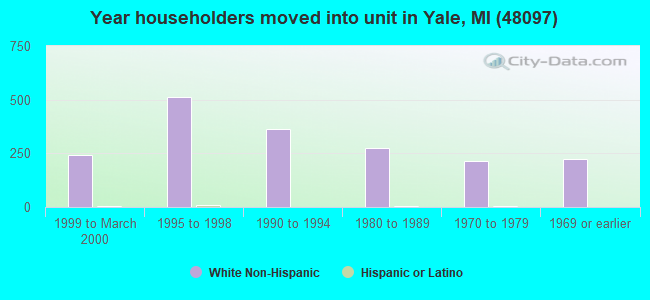
63% of the 48097 zip code residents lived in the same house 5 years ago. Out of people who lived in different houses, 50% lived in this county. Out of people who lived in different counties, 50% lived in Michigan.
93% of the 48097 zip code residents lived in the same house 1 year ago. Out of people who lived in different houses, 47% moved from this county. Out of people who lived in different houses, 45% moved from different county within same state. Out of people who lived in different houses, 4% moved from different state. Out of people who lived in different houses, 4% moved from abroad.
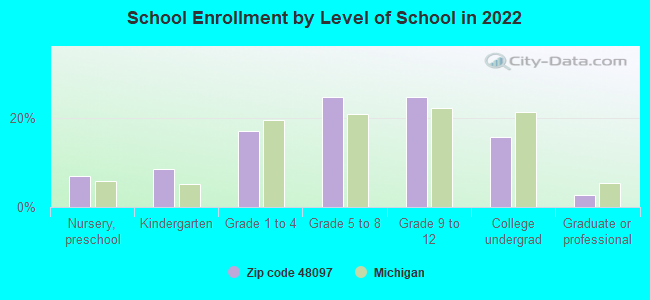
Private vs. public school enrollment:
Students in private schools in grades 1 to 8 (elementary and middle school): 44
Here:
10.6%
Michigan:
12.4%
Students in private schools in grades 9 to 12 (high school): 12
Here:
5.0%
Michigan:
9.8%
Students in private undergraduate colleges: 29
Here:
18.6%
Michigan:
14.9%
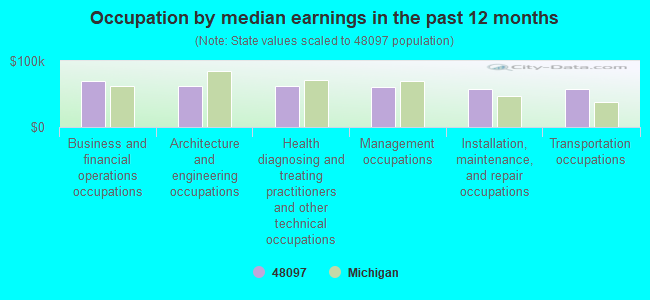
Occupation by median earnings in the past 12 months ($)
69,264Business and financial operations occupations
62,234Architecture and engineering occupations
61,550Health diagnosing and treating practitioners and other technical occupations
61,253Management occupations
58,272Installation, maintenance, and repair occupations
58,271Transportation occupations
Top industries in this zip code by the number of employees in 2005:
Health Care and Social Assistance: Nursing Care Facilities (100-249 employees: 1 establishment)
Accommodation and Food Services: Limited-Service Restaurants (20-49: 1, 5-9: 1)
Professional, Scientific, and Technical Services: Payroll Services (20-49: 1)
Health Care and Social Assistance: Offices of Dentists (5-9: 3, 1-4: 1)
Health Care and Social Assistance: Offices of Physicians (except Mental Health Specialists) (10-19: 1, 5-9: 1)
People in group quarters in 2010:
108 people in nursing facilities/skilled-nursing facilities
15 people in workers' group living quarters and job corps centers
7 people in group homes intended for adults
People in group quarters in 2000:
112 people in nursing homes
6 people in homes for the mentally retarded
4 people in other group homes
Fatal accident statistics in 2014:
Fatal accident count: 2
Vehicles involved in fatal accidents: 3
Fatal accidents caused by drunken drivers: 0
Fatalities: 2
Persons involved in fatal accidents: 4
Pedestrians involved in fatal accidents: 0
Fatal accident statistics in 2013:
Fatal accident count: 2
Vehicles involved in fatal accidents: 2
Fatal accidents caused by drunken drivers: 2
Fatalities: 2
Persons involved in fatal accidents: 2
Pedestrians involved in fatal accidents: 0
Home Mortgage Disclosure Act Aggregated Statistics For Year 2009 (Based on 2 partial tracts)
A) FHA, FSA/RHS & VA Home Purchase Loans
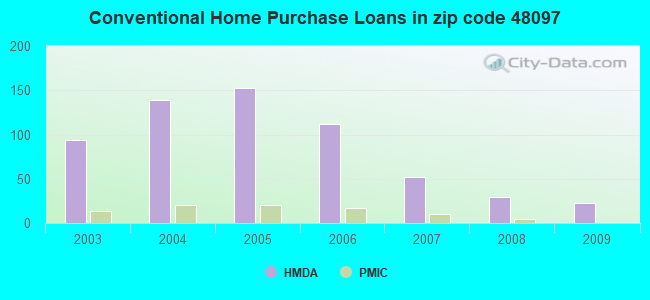
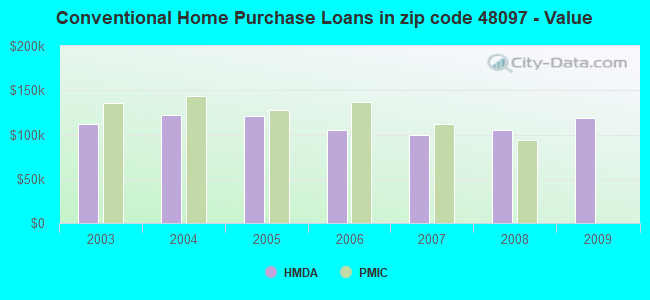
B) Conventional Home Purchase Loans
C) Refinancings
D) Home Improvement Loans
F) Non-occupant Loans on < 5 Family Dwellings (A B C & D)
G) Loans On Manufactured Home Dwelling (A B C & D)
Number
Average Value
Number
Average Value
Number
Average Value
Number
Average Value
Number
Average Value
Number
Average Value
LOANS ORIGINATED
27
$73,371
23
$119,023
117
$118,880
13
$18,709
7
$52,000
10
$106,850
APPLICATIONS APPROVED, NOT ACCEPTED
0
$0
0
$0
17
$113,767
5
$8,722
0
$0
3
$81,633
APPLICATIONS DENIED
15
$87,672
3
$39,140
60
$107,885
10
$36,567
7
$59,429
8
$125,805
APPLICATIONS WITHDRAWN
3
$113,503
2
$12,580
34
$137,152
3
$29,633
3
$48,087
2
$111,545
FILES CLOSED FOR INCOMPLETENESS
2
$57,030
0
$0
12
$113,923
0
$0
0
$0
0
$0
Aggregated Statistics For Year 2008 (Based on 2 partial tracts)
A) FHA, FSA/RHS & VA Home Purchase Loans
B) Conventional Home Purchase Loans
C) Refinancings
D) Home Improvement Loans
F) Non-occupant Loans on < 5 Family Dwellings (A B C & D)
G) Loans On Manufactured Home Dwelling (A B C & D)
Number
Average Value
Number
Average Value
Number
Average Value
Number
Average Value
Number
Average Value
Number
Average Value
LOANS ORIGINATED
22
$104,838
29
$105,387
77
$124,215
8
$14,049
10
$74,980
12
$90,160
APPLICATIONS APPROVED, NOT ACCEPTED
3
$101,763
0
$0
12
$103,300
3
$12,300
2
$65,420
3
$101,763
APPLICATIONS DENIED
7
$86,506
17
$54,565
52
$123,870
15
$80,180
5
$120,102
17
$73,707
APPLICATIONS WITHDRAWN
7
$71,170
3
$77,720
15
$136,764
2
$6,710
2
$46,965
3
$144,817
FILES CLOSED FOR INCOMPLETENESS
0
$0
0
$0
5
$114,734
0
$0
0
$0
2
$67,935
Aggregated Statistics For Year 2007 (Based on 2 partial tracts)
A) FHA, FSA/RHS & VA Home Purchase Loans
B) Conventional Home Purchase Loans
C) Refinancings
D) Home Improvement Loans
E) Loans on Dwellings For 5+ Families
F) Non-occupant Loans on < 5 Family Dwellings (A B C & D)
G) Loans On Manufactured Home Dwelling (A B C & D)
Number
Average Value
Number
Average Value
Number
Average Value
Number
Average Value
Number
Average Value
Number
Average Value
Number
Average Value
LOANS ORIGINATED
20
$111,296
52
$99,225
148
$126,621
37
$29,513
2
$536,770
12
$116,160
22
$122,298
APPLICATIONS APPROVED, NOT ACCEPTED
2
$113,225
5
$83,200
37
$115,423
3
$32,990
0
$0
3
$40,817
7
$62,783
APPLICATIONS DENIED
7
$94,174
35
$93,647
154
$133,571
10
$110,541
0
$0
7
$125,804
22
$76,855
APPLICATIONS WITHDRAWN
7
$110,949
8
$127,692
37
$125,805
2
$71,290
0
$0
2
$138,385
2
$86,385
FILES CLOSED FOR INCOMPLETENESS
0
$0
8
$97,080
10
$114,734
0
$0
0
$0
0
$0
0
$0
Aggregated Statistics For Year 2006 (Based on 2 partial tracts)
A) FHA, FSA/RHS & VA Home Purchase Loans
B) Conventional Home Purchase Loans
C) Refinancings
D) Home Improvement Loans
F) Non-occupant Loans on < 5 Family Dwellings (A B C & D)
G) Loans On Manufactured Home Dwelling (A B C & D)
Number
Average Value
Number
Average Value
Number
Average Value
Number
Average Value
Number
Average Value
Number
Average Value
LOANS ORIGINATED
10
$120,941
112
$104,688
268
$115,484
40
$38,119
13
$91,483
17
$96,796
APPLICATIONS APPROVED, NOT ACCEPTED
2
$75,485
17
$78,048
49
$95,509
8
$91,838
3
$110,710
3
$71,570
APPLICATIONS DENIED
2
$131,675
32
$113,539
178
$143,559
34
$57,870
8
$148,030
8
$111,338
APPLICATIONS WITHDRAWN
2
$78,840
13
$129,676
82
$137,342
3
$92,257
0
$0
3
$103,440
FILES CLOSED FOR INCOMPLETENESS
0
$0
10
$76,322
22
$121,001
2
$83,870
0
$0
0
$0
Aggregated Statistics For Year 2005 (Based on 2 partial tracts)
A) FHA, FSA/RHS & VA Home Purchase Loans
B) Conventional Home Purchase Loans
C) Refinancings
D) Home Improvement Loans
F) Non-occupant Loans on < 5 Family Dwellings (A B C & D)
G) Loans On Manufactured Home Dwelling (A B C & D)
Number
Average Value
Number
Average Value
Number
Average Value
Number
Average Value
Number
Average Value
Number
Average Value
LOANS ORIGINATED
22
$127,635
153
$120,915
206
$127,605
42
$47,047
18
$129,067
18
$101,483
APPLICATIONS APPROVED, NOT ACCEPTED
5
$112,386
23
$119,023
50
$167,270
7
$17,014
3
$75,483
3
$140,900
APPLICATIONS DENIED
5
$98,966
44
$104,113
193
$127,465
25
$57,032
2
$141,740
34
$86,830
APPLICATIONS WITHDRAWN
2
$77,160
29
$106,660
106
$135,774
8
$139,015
3
$140,900
2
$97,290
FILES CLOSED FOR INCOMPLETENESS
0
$0
3
$56,473
55
$145,446
5
$7,716
0
$0
0
$0
Aggregated Statistics For Year 2004 (Based on 2 partial tracts)
A) FHA, FSA/RHS & VA Home Purchase Loans
B) Conventional Home Purchase Loans
C) Refinancings
D) Home Improvement Loans
F) Non-occupant Loans on < 5 Family Dwellings (A B C & D)
G) Loans On Manufactured Home Dwelling (A B C & D)
Number
Average Value
Number
Average Value
Number
Average Value
Number
Average Value
Number
Average Value
Number
Average Value
LOANS ORIGINATED
29
$124,474
139
$122,559
278
$122,987
12
$47,527
15
$97,737
18
$112,199
APPLICATIONS APPROVED, NOT ACCEPTED
7
$129,639
12
$104,278
70
$133,497
3
$11,743
0
$0
5
$128,824
APPLICATIONS DENIED
8
$119,095
39
$94,881
183
$138,198
23
$42,518
10
$120,941
32
$91,838
APPLICATIONS WITHDRAWN
2
$66,255
12
$135,869
149
$132,762
12
$51,860
3
$179,483
5
$55,354
FILES CLOSED FOR INCOMPLETENESS
3
$118,537
3
$68,773
40
$136,205
0
$0
0
$0
2
$122,450
Aggregated Statistics For Year 2003 (Based on 2 partial tracts)
A) FHA, FSA/RHS & VA Home Purchase Loans
B) Conventional Home Purchase Loans
C) Refinancings
D) Home Improvement Loans
E) Loans on Dwellings For 5+ Families
F) Non-occupant Loans on < 5 Family Dwellings (A B C & D)
Detailed PMIC statistics for the following Tracts:6551.00
2002 - 2018 National Fire Incident Reporting System (NFIRS) incidents
According to the data from the years 2002 - 2018 the average number of fire incidents per year is 13. The highest number of reported fires - 32 took place in 2017, and the least - 1 in 2002. The data has a rising trend.
When looking into fire subcategories, the most incidents belonged to: Structure Fires (67.9%), and Outside Fires (22.2%).
Fire incident types reported to NFIRS in Zip Code 48097


 Nearest zip codes: 48454, 48022, 48014, 48006, 48466, 48416.


 (Students: 12, Location: 11089 YALE RD, Grades: KG-8)


 According to the data from the years 2002 - 2018 the average number of fire incidents per year is 13. The highest number of reported fires - 32 took place in 2017, and the least - 1 in 2002. The data has a rising trend.
 When looking into fire subcategories, the most incidents belonged to: Structure Fires (67.9%), and Outside Fires (22.2%).