Estimated zip code population in 2022: 2,739 Zip code population in 2010: 2,626 Zip code population in 2000: 2,517
Houses and condos: 2,030 Renter-occupied apartments: 177
% of renters here:
15%
State:
27%
March 2022 cost of living index in zip code 49453: 82.1 (low, U.S. average is 100)
Land area: 10.9 sq. mi. Water area: 1.0 sq. mi.
Population density: 252 people per square mile
(very low).
OSM Map
General Map
Google Map
MSN Map
OSM Map
General Map
Google Map
MSN Map
OSM Map
General Map
Google Map
MSN Map
OSM Map
General Map
Google Map
MSN Map
Please wait while loading the map...
Real estate property taxes paid for housing units in 2022:
This zip code:
1.3% ($6,229)
Michigan:
1.2% ($2,746)
Median real estate property taxes paid for housing units with mortgages in 2022: $6,235 (1.1%) Median real estate property taxes paid for housing units with no mortgage in 2022: $6,250 (1.4%)
Business Search- 14 Million verified businesses
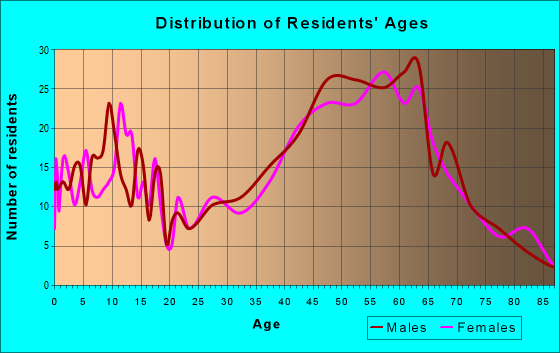
Males: 1,484
(54.2%)
Females: 1,254
(45.8%)
For population 25 years and over in 49453:
High school or higher: 98.7%
Bachelor's degree or higher: 51.7%
Graduate or professional degree: 22.4%
Unemployed: 1.2%
Mean travel time to work (commute): 27.1 minutes
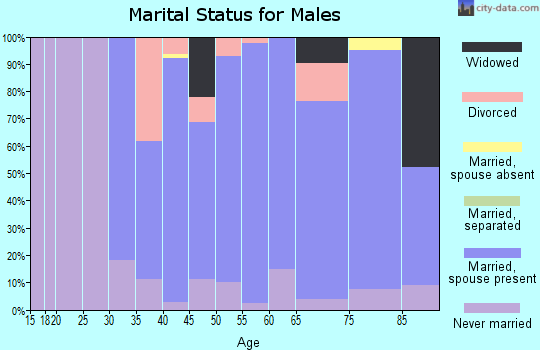
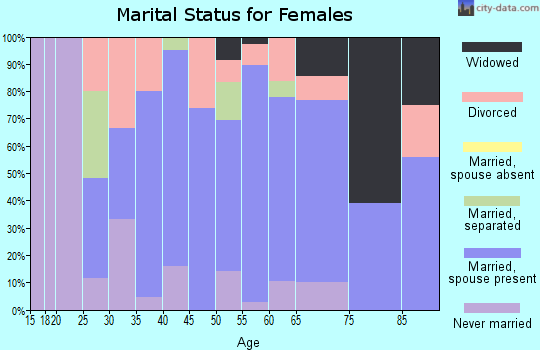
For population 15 years and over in 49453:
Never married: 24.9%
Now married: 59.0%
Separated: 0.0%
Widowed: 5.3%
Divorced: 10.8%
Zip code 49453 compared to state average:
Median house value above state average.
Unemployed percentage significantly below state average.
Black race population percentage significantly below state average.
Median age significantly above state average.
Foreign-born population percentage below state average.
Renting percentage below state average.
Length of stay since moving in significantly below state average.
House age below state average.
Percentage of population with a bachelor's degree or higher above state average.
Estimated median house/condo value in 2022: $494,774
49453:
$494,774
Michigan:
$224,400
According to our research of Michigan and other state lists, there were 5 registered sex offenders living in 49453 zip code as of April 19, 2024. The ratio of all residents to sex offenders in zip code 49453 is 538 to 1. The ratio of registered sex offenders to all residents in this zip code is lower than the state average.
Median resident age:
This zip code:
51.6 years
Michigan median age:
40.3 years
Average household size:
This zip code:
2.3 people
Michigan:
2.4 people
Averages for the 2020 tax year for zip code 49453, filed in 2021:
Average Adjusted Gross Income (AGI) in 2020: $111,929 (Individual Income Tax Returns)
Here:
$111,929
State:
$68,945
Salary/wage: $80,261 (reported on 71.8% of returns)
Here:
$80,261
State:
$57,142
(% of AGI for various income ranges: 965.0% for AGIs below $25k, 2968.0% for AGIs $25k-50k, 5859.2% for AGIs $50k-75k, 7196.7% for AGIs $75k-100k, 15833.8% for AGIs $100k-200k, 104534.0% for AGIs over 200k)
Taxable interest for individuals: $2,261 (reported on 46.0% of returns)
This zip code:
$2,261
Michigan:
$1,630
(% of AGI for various income ranges: 41.2% for AGIs below $25k, 63.5% for AGIs $25k-50k, 90.0% for AGIs $50k-75k, 84.4% for AGIs $75k-100k, 308.8% for AGIs $100k-200k, 1728.0% for AGIs over 200k)
Ordinary dividends: $9,753 (reported on 36.8% of returns)
Here:
$9,753
State:
$6,972
(% of AGI for various income ranges: 49.4% for AGIs below $25k, 182.5% for AGIs $25k-50k, 290.0% for AGIs $50k-75k, 491.1% for AGIs $75k-100k, 1237.5% for AGIs $100k-200k, 5878.0% for AGIs over 200k)
Net capital gain/loss in AGI: +$31,429 (reported on 35.6% of returns)
Here:
+$31,429
State:
+$20,064
(% of AGI for various income ranges: 10.3% for AGIs below $25k, 93.5% for AGIs $25k-50k, 274.2% for AGIs $50k-75k, 902.2% for AGIs $75k-100k, 2461.2% for AGIs $100k-200k, 28370.0% for AGIs over 200k)
Profit/loss from business: +$21,991 (reported on 19.5% of returns)
Here:
+$21,991
State:
+$11,172
(% of AGI for various income ranges: 90.0% for AGIs below $25k, 216.0% for AGIs $25k-50k, 382.5% for AGIs $50k-75k, 857.8% for AGIs $75k-100k, 990.0% for AGIs $100k-200k, 7848.0% for AGIs over 200k)
Taxable individual retirement arrangement distribution: $27,013 (reported on 17.8% of returns)
49453:
$27,013
Michigan:
$19,803
(% of AGI for various income ranges: 122.1% for AGIs below $25k, 235.5% for AGIs $25k-50k, 510.0% for AGIs $50k-75k, 1107.8% for AGIs $75k-100k, 2096.9% for AGIs $100k-200k, 5048.0% for AGIs over 200k)
Self-employed (Keogh) retirement plans: $30,233 (reported on 1.7% of returns)
49453:
$30,233
Michigan:
$25,132
(% of AGI for various income ranges: 566.9% for AGIs $100k-200k)
Total itemized deductions: $31,486 (reported on 16.7% of returns)
Here:
$31,486
State:
$34,117
(% of AGI for various income ranges: 359.0% for AGIs $25k-50k, 440.0% for AGIs $50k-75k, 1056.7% for AGIs $75k-100k, 1721.9% for AGIs $100k-200k, 8358.0% for AGIs over 200k)
Charity contributions: $8,920 (reported on 14.4% of returns)
Here:
$8,920
State:
$13,548
(% of AGI for various income ranges: 86.0% for AGIs $25k-50k, 96.7% for AGIs $75k-100k, 371.9% for AGIs $100k-200k, 2752.0% for AGIs over 200k)
Taxes paid: $8,728 (reported on 16.7% of returns)
49453:
$8,728
State:
$7,972
(% of AGI for various income ranges: 93.5% for AGIs $25k-50k, 155.0% for AGIs $50k-75k, 257.8% for AGIs $75k-100k, 501.2% for AGIs $100k-200k, 2248.0% for AGIs over 200k)
Earned income credit: $2,067 (reported on 6.9% of returns)
Here:
$2,067
State:
$2,251
(% of AGI for various income ranges: 47.6% for AGIs below $25k, 43.0% for AGIs $25k-50k)
Percentage of individuals using paid preparers for their 2020 taxes: 94.3%
Here:
94%
State:
93%
(% for various income ranges: 92.2% for AGIs below $25k, 96.6% for AGIs $25k-50k, 94.7% for AGIs $50k-75k, 93.8% for AGIs $75k-100k, 94.3% for AGIs $100k-200k, 95.8% for AGIs over 200k)
Averages for the 2012 tax year for zip code 49453, filed in 2013:
Average Adjusted Gross Income (AGI) in 2012: $85,216 (Individual Income Tax Returns)
Here:
$85,216
State:
$55,609
Salary/wage: $62,330 (reported on 74.8% of returns)
Here:
$62,330
State:
$46,782
(% of AGI for various income ranges: 62.8% for AGIs below $25k, 64.3% for AGIs $25k-50k, 63.4% for AGIs $50k-75k, 62.3% for AGIs $75k-100k, 62.4% for AGIs $100k-200k, 44.4% for AGIs over 200k)
Taxable interest for individuals: $3,332 (reported on 45.7% of returns)
This zip code:
$3,332
Michigan:
$1,491
(% of AGI for various income ranges: 1.8% for AGIs below $25k, 1.0% for AGIs $25k-50k, 1.5% for AGIs $50k-75k, 1.7% for AGIs $75k-100k, 1.6% for AGIs $100k-200k, 2.1% for AGIs over 200k)
Ordinary dividends: $11,632 (reported on 33.1% of returns)
Here:
$11,632
State:
$6,225
(% of AGI for various income ranges: 3.7% for AGIs below $25k, 2.5% for AGIs $25k-50k, 1.5% for AGIs $50k-75k, 1.6% for AGIs $75k-100k, 3.5% for AGIs $100k-200k, 6.8% for AGIs over 200k)
Net capital gain/loss in AGI: +$15,283 (reported on 31.1% of returns)
Here:
+$15,283
State:
+$9,326
(% of AGI for various income ranges: 0.7% for AGIs $25k-50k, 0.2% for AGIs $50k-75k, 0.6% for AGIs $75k-100k, 3.7% for AGIs $100k-200k, 10.4% for AGIs over 200k)
Profit/loss from business: +$11,711 (reported on 23.2% of returns)
Here:
+$11,711
State:
+$11,523
(% of AGI for various income ranges: 8.9% for AGIs below $25k, 7.9% for AGIs $25k-50k, 8.7% for AGIs $50k-75k, 5.2% for AGIs $75k-100k, 3.1% for AGIs $100k-200k, 0.2% for AGIs over 200k)
Taxable individual retirement arrangement distribution: $20,058 (reported on 17.2% of returns)
49453:
$20,058
Michigan:
$15,298
(% of AGI for various income ranges: 5.9% for AGIs below $25k, 6.0% for AGIs $25k-50k, 5.6% for AGIs $50k-75k, 4.1% for AGIs $75k-100k, 5.4% for AGIs $100k-200k, 2.5% for AGIs over 200k)
Self-employment retirement plans: $19,533 (reported on 2.0% of returns)
49453:
$19,533
Michigan:
$20,834
Total itemized deductions: $27,142 (18% of AGI, reported on 47.0% of returns)
Here:
$27,142
State:
$21,628
Here:
18.2% of AGI
State:
18.4% of AGI
(% of AGI for various income ranges: 21.0% for AGIs below $25k, 19.8% for AGIs $25k-50k, 17.3% for AGIs $50k-75k, 18.2% for AGIs $75k-100k, 17.2% for AGIs $100k-200k, 11.1% for AGIs over 200k)
Charity contributions: $4,184 (reported on 41.7% of returns)
Here:
$4,184
State:
$4,225
(% of AGI for various income ranges: 1.7% for AGIs below $25k, 1.7% for AGIs $25k-50k, 2.0% for AGIs $50k-75k, 2.4% for AGIs $75k-100k, 2.7% for AGIs $100k-200k, 1.7% for AGIs over 200k)
Taxes paid: $11,968 (reported on 47.0% of returns)
49453:
$11,968
State:
$8,327
(% of AGI for various income ranges: 5.7% for AGIs below $25k, 5.9% for AGIs $25k-50k, 6.4% for AGIs $50k-75k, 7.1% for AGIs $75k-100k, 7.5% for AGIs $100k-200k, 6.3% for AGIs over 200k)
Earned income credit: $1,675 (reported on 13.2% of returns)
Here:
$1,675
State:
$2,306
(% of AGI for various income ranges: 4.3% for AGIs below $25k, 0.7% for AGIs $25k-50k)
Percentage of individuals using paid preparers for their 2012 taxes: 65.6%
Here:
66%
State:
57%
(% for various income ranges: 58.2% for AGIs below $25k, 67.9% for AGIs $25k-50k, 70.0% for AGIs $50k-75k, 66.7% for AGIs $75k-100k, 68.2% for AGIs $100k-200k, 81.8% for AGIs over 200k)
Averages for the 2004 tax year for zip code 49453, filed in 2005:
Average Adjusted Gross Income (AGI) in 2004: $62,058 (Individual Income Tax Returns)
Here:
$62,058
State:
$48,204
Salary/wage: $47,616 (reported on 79.7% of returns)
Here:
$47,616
State:
$42,791
(% of AGI for various income ranges: 159.2% for AGIs below $10k, 70.8% for AGIs $10k-25k, 85.5% for AGIs $25k-50k, 71.9% for AGIs $50k-75k, 67.6% for AGIs $75k-100k, 49.2% for AGIs over 100k)
Taxable interest for individuals: $2,583 (reported on 53.0% of returns)
This zip code:
$2,583
Michigan:
$1,725
(% of AGI for various income ranges: 12.4% for AGIs below $10k, 2.8% for AGIs $10k-25k, 1.5% for AGIs $25k-50k, 1.9% for AGIs $50k-75k, 0.7% for AGIs $75k-100k, 2.5% for AGIs over 100k)
Taxable dividends: $4,039 (reported on 34.9% of returns)
Here:
$4,039
State:
$3,420
(% of AGI for various income ranges: 9.2% for AGIs below $10k, 3.0% for AGIs $10k-25k, 2.0% for AGIs $25k-50k, 2.2% for AGIs $50k-75k, 1.2% for AGIs $75k-100k, 2.4% for AGIs over 100k)
Net capital gain/loss: +$13,416 (reported on 30.4% of returns)
Here:
+$13,416
State:
+$8,532
(% of AGI for various income ranges: -0.7% for AGIs below $10k, -0.4% for AGIs $10k-25k, 2.3% for AGIs $25k-50k, 2.1% for AGIs $50k-75k, 4.6% for AGIs $75k-100k, 9.8% for AGIs over 100k)
Profit/loss from business: +$9,092 (reported on 20.7% of returns)
Here:
+$9,092
State:
+$9,547
(% of AGI for various income ranges: 35.3% for AGIs below $10k, 2.0% for AGIs $10k-25k, 1.4% for AGIs $25k-50k, 3.9% for AGIs $50k-75k, 3.8% for AGIs $75k-100k, 2.6% for AGIs over 100k)
IRA payment deduction: $2,627 (reported on 3.5% of returns)
49453:
$2,627
Michigan:
$2,875
(% of AGI for various income ranges: 2.8% for AGIs below $10k, 0.4% for AGIs $25k-50k, 0.2% for AGIs $50k-75k, 0.4% for AGIs $75k-100k)
Self-employed pension: $11,933 (reported on 1.0% of returns)
Here:
$11,933
Michigan:
$13,826
Total itemized deductions: $21,647 (19% of AGI, reported on 44.2% of returns)
Here:
$21,647
State:
$18,509
Here:
19.2% of AGI
State:
20.7% of AGI
(% of AGI for various income ranges: 53.8% for AGIs below $10k, 15.1% for AGIs $10k-25k, 19.2% for AGIs $25k-50k, 19.7% for AGIs $50k-75k, 19.7% for AGIs $75k-100k, 12.1% for AGIs over 100k)
Charity contributions deductions: $4,239 (4% of AGI, reported on 39.5% of returns)
Here:
$4,239
State:
$3,365
Here:
3.5% of AGI
State:
3.6% of AGI
(% of AGI for various income ranges: 1.8% for AGIs below $10k, 1.5% for AGIs $10k-25k, 1.9% for AGIs $25k-50k, 2.7% for AGIs $50k-75k, 2.6% for AGIs $75k-100k, 3.0% for AGIs over 100k)
Total tax: $12,123 (reported on 76.1% of returns)
49453:
$12,123
State:
$7,691
(% of AGI for various income ranges: 6.8% for AGIs below $10k, 5.4% for AGIs $10k-25k, 7.2% for AGIs $25k-50k, 9.1% for AGIs $50k-75k, 11.2% for AGIs $75k-100k, 19.8% for AGIs over 100k)
Earned income credit: $1,320 (reported on 10.2% of returns)
Here:
$1,320
State:
$1,737
Percentage of individuals using paid preparers for their 2004 taxes: 67.3%
Here:
67%
State:
60%
(% for various income ranges: 60.9% for AGIs below $10k, 63.0% for AGIs $10k-25k, 66.2% for AGIs $25k-50k, 75.0% for AGIs $50k-75k, 70.2% for AGIs $75k-100k, 78.5% for AGIs over 100k)
Likely homosexual households (counted as self-reported same-sex unmarried-partner households)
Lesbian couples: 0.5% of all households
Gay men: 1.3% of all households
Household received Food Stamps/SNAP in the past 12 months: 54 Household did not receive Food Stamps/SNAP in the past 12 months: 1,141
Women who had a birth in the past 12 months: 8 (0 now married, 8 unmarried) Women who did not have a birth in the past 12 months: 411 (263 now married, 146 unmarried)
Housing units in zip code 49453 with a mortgage: 488 (69 second mortgage, 66 both second mortgage and home equity loan) Houses without a mortgage: 5
Median monthly owner costs for units with a mortgage: $2,312 Median monthly owner costs for units without a mortgage: $927
Residents with income below the poverty level in 2022:
This zip code:
4.9%
Whole state:
13.4%
Residents with income below 50% of the poverty level in 2022:
This zip code:
0.6%
Whole state:
6.9%
Median number of rooms in houses and condos:
Here:
6.7
State:
6.5
Median number of rooms in apartments:
Here:
2.7
State:
4.3
Notable locations in this zip code not listed on our city pages
Notable locations in zip code 49453: Gleasons Marina (A), Singapore Yacht Club (B), Tower Marine (C), Oval Beach (D), Old Saugatuck Light House (E), Saugatuck Yacht Club (F), Schippas Marina (G), Camp Grey (H), Ravines Golf Course (I), Clearbrook Golf Course (J), Laketown Golf and Conference Center (K), Pottawattomie Gun Club (L), Saugatuck Township Fire District (M). Display/hide their locations on the map
Churches in zip code 49453 include: All Saints Episcopal Church (A), Saugatuck Christian Reformed Church (B), Saugatuck United Methodist Church (C), First Congregational Church (D). Display/hide their locations on the map
Parks in zip code 49453 include: River Bluff Park (1), Allegan Road Historical Marker (2), Gordon W Lloyd Historical Marker (3), All Saints Episcopal Church Historical Marker (4), First Congregational Church Historical Marker (5), Singapore, Michigan Historical Marker (6). Display/hide their locations on the map
Size of family households: 416 2-persons, 125 3-persons, 105 4-persons, 98 5-persons
Size of nonfamily households: 318 1-person, 133 2-persons, 10 3-persons
390 married couples with children.
34 single-parent households (20 men, 14 women).
96.4% of residents of 49453 zip code speak English at home.
2.8% of residents speak Spanish at home (57% very well, 43% well).
0.1% of residents speak other Indo-European language at home (100% very well).
1.0% of residents speak Asian or Pacific Island language at home (44% very well, 56% not well).
Foreign born population: 86 (3.2%) (51.9% of them are naturalized citizens)
This zip code:
3.2%
Whole state:
6.9%
39%Honduras
20%Malaysia
17%Greece
13%Japan
2%Germany
20%German
16%European
11%Dutch
7%Irish
6%English
5%Italian
2%American
Year of entry for the foreign-born population
92010 or later
02000 to 2009
371990 to 1999
82Before 1990
Facilities with environmental interests located in this zip code:
BOAT SHOP THE (3295 BLUE STAR HWY in SAUGATUCK, MI)
(Resource Conservation and Recovery Act (tracking hazardous waste)) Organizations: HAMLIN THOMAS LEE (CONTACT/OWNER)
MI DEPT/ENVIRONMENTAL QUALITY (STATE ROUTE 89 & 66TH in SAUGATUCK, MI)
(Resource Conservation and Recovery Act (tracking hazardous waste)) Alternative names: MI DEPT/DEQ
EVEHART TRUCKING (I-96 S MM 42.5 in SAUGATUCK, MI)
(Resource Conservation and Recovery Act (tracking hazardous waste))
BLAKE VALLEAU (2500 63RD ST in SAUGATUCK, MI)
COMPLIANCE ACTIVITY (Tracking inspections of insecticide, fungicide, and rodenticide, and toxic substances)
86.6%Utility gas
7.3%Electricity
3.6%Other fuel
0.9%No fuel used
0.7%Bottled, tank, or LP gas
0.6%Fuel oil, kerosene, etc.
0.5%Wood
Population in 1990: 3,870.
Place of birth for U.S.-born residents:
This state: 1,640
Northeast: 117
Midwest: 479
South: 221
West: 158
56% of the 49453 zip code residents lived in the same house 5 years ago. Out of people who lived in different houses, 50% lived in this county. Out of people who lived in different counties, 50% lived in Michigan.
92% of the 49453 zip code residents lived in the same house 1 year ago. Out of people who lived in different houses, 16% moved from this county. Out of people who lived in different houses, 23% moved from different county within same state. Out of people who lived in different houses, 69% moved from different state.
Private vs. public school enrollment:
Students in private schools in grades 1 to 8 (elementary and middle school): 4
Here:
2.6%
Michigan:
12.4%
Students in private schools in grades 9 to 12 (high school): 25
Here:
28.8%
Michigan:
9.8%
Students in private undergraduate colleges: 2
Here:
5.3%
Michigan:
14.9%
Occupation by median earnings in the past 12 months ($)
135,654Business and financial operations occupations
131,894Health diagnosing and treating practitioners and other technical occupations
115,977Legal occupations
98,476Management occupations
64,920Education, training, and library occupations
48,678Construction and extraction occupations
Top industries in this zip code by the number of employees in 2005:
Detailed PMIC statistics for the following Tracts:0308.00
2002 - 2018 National Fire Incident Reporting System (NFIRS) incidents
According to the data from the years 2002 - 2018 the average number of fire incidents per year is 20. The highest number of reported fire incidents - 40 took place in 2012, and the least - 7 in 2009. The data has a rising trend.
When looking into fire subcategories, the most incidents belonged to: Structure Fires (41.8%), and Outside Fires (31.6%).
Fire incident types reported to NFIRS in Zip Code 49453


 Nearest zip codes: 49406, 49408, 49434, 49423, 49424, 49419.


 According to the data from the years 2002 - 2018 the average number of fire incidents per year is 20. The highest number of reported fire incidents - 40 took place in 2012, and the least - 7 in 2009. The data has a rising trend.
 When looking into fire subcategories, the most incidents belonged to: Structure Fires (41.8%), and Outside Fires (31.6%).