Estimated zip code population in 2022: 39,804 Zip code population in 2010: 35,459 Zip code population in 2000: 39,734
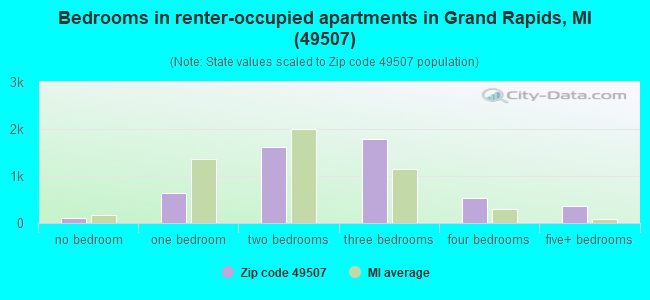
Houses and condos: 13,791 Renter-occupied apartments: 5,050
% of renters here:
38%
State:
27%
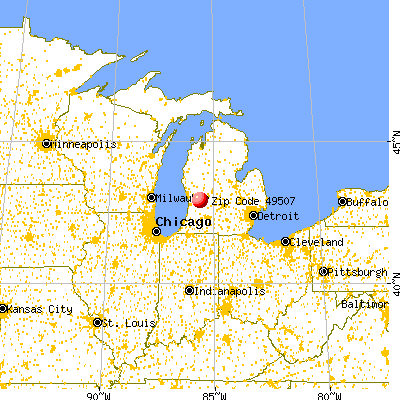
March 2022 cost of living index in zip code 49507: 85.6 (less than average, U.S. average is 100)
Land area: 5.5 sq. mi. Water area: 0.0 sq. mi.
Population density: 7,214 people per square mile
(high).
OSM Map
General Map
Google Map
MSN Map
OSM Map
General Map
Google Map
MSN Map
OSM Map
General Map
Google Map
MSN Map
OSM Map
General Map
Google Map
MSN Map
Please wait while loading the map...
Real estate property taxes paid for housing units in 2022:
This zip code:
0.9% ($1,697)
Michigan:
1.2% ($2,746)
Median real estate property taxes paid for housing units with mortgages in 2022: $1,920 (1.0%) Median real estate property taxes paid for housing units with no mortgage in 2022: $1,410 (0.9%)
Averages for the 2020 tax year for zip code 49507, filed in 2021:
Average Adjusted Gross Income (AGI) in 2020: $38,739 (Individual Income Tax Returns)
Here:
$38,739
State:
$68,945
Salary/wage: $35,650 (reported on 87.3% of returns)
Here:
$35,650
State:
$57,142
(% of AGI for various income ranges: 1160.1% for AGIs below $25k, 3690.5% for AGIs $25k-50k, 6806.5% for AGIs $50k-75k, 10262.4% for AGIs $75k-100k, 18476.6% for AGIs $100k-200k, 66590.0% for AGIs over 200k)
Taxable interest for individuals: $360 (reported on 17.4% of returns)
This zip code:
$360
Michigan:
$1,630
(% of AGI for various income ranges: 3.2% for AGIs below $25k, 3.2% for AGIs $25k-50k, 12.3% for AGIs $50k-75k, 25.8% for AGIs $75k-100k, 61.8% for AGIs $100k-200k, 180.0% for AGIs over 200k)
Ordinary dividends: $2,160 (reported on 6.9% of returns)
Here:
$2,160
State:
$6,972
(% of AGI for various income ranges: 5.4% for AGIs below $25k, 5.4% for AGIs $25k-50k, 28.4% for AGIs $50k-75k, 43.1% for AGIs $75k-100k, 151.8% for AGIs $100k-200k, 1550.0% for AGIs over 200k)
Net capital gain/loss in AGI: +$4,449 (reported on 6.1% of returns)
Here:
+$4,449
State:
+$20,064
(% of AGI for various income ranges: 2.2% for AGIs below $25k, 5.9% for AGIs $25k-50k, 32.1% for AGIs $50k-75k, 99.6% for AGIs $75k-100k, 251.4% for AGIs $100k-200k, 5906.7% for AGIs over 200k)
Profit/loss from business: +$7,889 (reported on 15.4% of returns)
Here:
+$7,889
State:
+$11,172
(% of AGI for various income ranges: 85.0% for AGIs below $25k, 95.0% for AGIs $25k-50k, 203.9% for AGIs $50k-75k, 361.5% for AGIs $75k-100k, 991.8% for AGIs $100k-200k, 3180.0% for AGIs over 200k)
Taxable individual retirement arrangement distribution: $12,071 (reported on 3.4% of returns)
49507:
$12,071
Michigan:
$19,803
(% of AGI for various income ranges: 18.9% for AGIs below $25k, 30.8% for AGIs $25k-50k, 93.3% for AGIs $50k-75k, 163.1% for AGIs $75k-100k, 381.8% for AGIs $100k-200k)
Self-employed (Keogh) retirement plans: $12,200 (reported on 0.1% of returns)
49507:
$12,200
Michigan:
$25,132
(% of AGI for various income ranges: 4.6% for AGIs below $25k)
Total itemized deductions: $25,580 (reported on 3.0% of returns)
Here:
$25,580
State:
$34,117
(% of AGI for various income ranges: 22.8% for AGIs below $25k, 60.6% for AGIs $25k-50k, 148.0% for AGIs $50k-75k, 243.9% for AGIs $75k-100k, 641.4% for AGIs $100k-200k, 5650.0% for AGIs over 200k)
Charity contributions: $10,846 (reported on 2.1% of returns)
Here:
$10,846
State:
$13,548
(% of AGI for various income ranges: 1.7% for AGIs below $25k, 8.7% for AGIs $25k-50k, 27.4% for AGIs $50k-75k, 50.9% for AGIs $75k-100k, 264.4% for AGIs $100k-200k, 3916.7% for AGIs over 200k)
Taxes paid: $5,971 (reported on 3.0% of returns)
49507:
$5,971
State:
$7,972
(% of AGI for various income ranges: 1.9% for AGIs below $25k, 9.2% for AGIs $25k-50k, 38.6% for AGIs $50k-75k, 75.2% for AGIs $75k-100k, 210.0% for AGIs $100k-200k, 1043.3% for AGIs over 200k)
Earned income credit: $2,585 (reported on 27.2% of returns)
Here:
$2,585
State:
$2,251
(% of AGI for various income ranges: 133.6% for AGIs below $25k, 104.5% for AGIs $25k-50k, 1.7% for AGIs $50k-75k)
Percentage of individuals using paid preparers for their 2020 taxes: 93.7%
Here:
94%
State:
93%
(% for various income ranges: 93.9% for AGIs below $25k, 93.8% for AGIs $25k-50k, 92.8% for AGIs $50k-75k, 93.7% for AGIs $75k-100k, 93.3% for AGIs $100k-200k, 100.0% for AGIs over 200k)
Averages for the 2012 tax year for zip code 49507, filed in 2013:
Average Adjusted Gross Income (AGI) in 2012: $30,007 (Individual Income Tax Returns)
Here:
$30,007
State:
$55,609
Salary/wage: $28,251 (reported on 88.3% of returns)
Here:
$28,251
State:
$46,782
(% of AGI for various income ranges: 80.0% for AGIs below $25k, 89.8% for AGIs $25k-50k, 85.2% for AGIs $50k-75k, 86.6% for AGIs $75k-100k, 81.8% for AGIs $100k-200k, 37.6% for AGIs over 200k)
Taxable interest for individuals: $774 (reported on 15.9% of returns)
This zip code:
$774
Michigan:
$1,491
(% of AGI for various income ranges: 0.2% for AGIs below $25k, 0.2% for AGIs $25k-50k, 0.3% for AGIs $50k-75k, 0.3% for AGIs $75k-100k, 0.4% for AGIs $100k-200k, 4.1% for AGIs over 200k)
Ordinary dividends: $2,007 (reported on 6.5% of returns)
Here:
$2,007
State:
$6,225
(% of AGI for various income ranges: 0.4% for AGIs below $25k, 0.2% for AGIs $25k-50k, 0.5% for AGIs $50k-75k, 0.6% for AGIs $75k-100k, 1.2% for AGIs $100k-200k)
Net capital gain/loss in AGI: +$1,294 (reported on 4.4% of returns)
Here:
+$1,294
State:
+$9,326
(% of AGI for various income ranges: 0.5% for AGIs $75k-100k, 1.2% for AGIs $100k-200k)
Profit/loss from business: +$7,484 (reported on 14.5% of returns)
Here:
+$7,484
State:
+$11,523
(% of AGI for various income ranges: 9.9% for AGIs below $25k, 1.7% for AGIs $25k-50k, 1.8% for AGIs $50k-75k, 1.7% for AGIs $75k-100k, 2.6% for AGIs $100k-200k)
Taxable individual retirement arrangement distribution: $9,794 (reported on 4.4% of returns)
49507:
$9,794
Michigan:
$15,298
(% of AGI for various income ranges: 1.1% for AGIs below $25k, 1.3% for AGIs $25k-50k, 1.7% for AGIs $50k-75k, 1.5% for AGIs $75k-100k, 2.6% for AGIs $100k-200k)
Total itemized deductions: $15,404 (23% of AGI, reported on 16.8% of returns)
Here:
$15,404
State:
$21,628
Here:
23.0% of AGI
State:
18.4% of AGI
(% of AGI for various income ranges: 3.2% for AGIs below $25k, 7.0% for AGIs $25k-50k, 11.2% for AGIs $50k-75k, 12.6% for AGIs $75k-100k, 14.4% for AGIs $100k-200k, 13.0% for AGIs over 200k)
Charity contributions: $3,937 (reported on 13.3% of returns)
Here:
$3,937
State:
$4,225
(% of AGI for various income ranges: 0.4% for AGIs below $25k, 1.1% for AGIs $25k-50k, 2.3% for AGIs $50k-75k, 3.0% for AGIs $75k-100k, 3.9% for AGIs $100k-200k, 2.5% for AGIs over 200k)
Taxes paid: $5,317 (reported on 16.7% of returns)
49507:
$5,317
State:
$8,327
(% of AGI for various income ranges: 0.6% for AGIs below $25k, 2.1% for AGIs $25k-50k, 4.0% for AGIs $50k-75k, 4.8% for AGIs $75k-100k, 5.9% for AGIs $100k-200k, 5.2% for AGIs over 200k)
Earned income credit: $2,736 (reported on 36.3% of returns)
Here:
$2,736
State:
$2,306
(% of AGI for various income ranges: 12.2% for AGIs below $25k, 1.8% for AGIs $25k-50k)
Percentage of individuals using paid preparers for their 2012 taxes: 50.1%
Here:
50%
State:
57%
(% for various income ranges: 49.1% for AGIs below $25k, 53.1% for AGIs $25k-50k, 48.6% for AGIs $50k-75k, 47.5% for AGIs $75k-100k, 51.4% for AGIs $100k-200k, 66.7% for AGIs over 200k)
Averages for the 2004 tax year for zip code 49507, filed in 2005:
Average Adjusted Gross Income (AGI) in 2004: $28,888 (Individual Income Tax Returns)
Here:
$28,888
State:
$48,204
Salary/wage: $28,094 (reported on 91.0% of returns)
Here:
$28,094
State:
$42,791
(% of AGI for various income ranges: 85.4% for AGIs below $10k, 86.1% for AGIs $10k-25k, 92.0% for AGIs $25k-50k, 90.0% for AGIs $50k-75k, 89.2% for AGIs $75k-100k, 76.5% for AGIs over 100k)
Taxable interest for individuals: $916 (reported on 22.1% of returns)
This zip code:
$916
Michigan:
$1,725
(% of AGI for various income ranges: 1.9% for AGIs below $10k, 0.6% for AGIs $10k-25k, 0.3% for AGIs $25k-50k, 0.8% for AGIs $50k-75k, 0.4% for AGIs $75k-100k, 2.0% for AGIs over 100k)
Taxable dividends: $1,348 (reported on 9.6% of returns)
Here:
$1,348
State:
$3,420
(% of AGI for various income ranges: 1.0% for AGIs below $10k, 0.4% for AGIs $10k-25k, 0.3% for AGIs $25k-50k, 0.3% for AGIs $50k-75k, 0.6% for AGIs $75k-100k, 1.1% for AGIs over 100k)
Net capital gain/loss: +$1,832 (reported on 6.5% of returns)
Here:
+$1,832
State:
+$8,532
(% of AGI for various income ranges: -0.2% for AGIs below $10k, 0.2% for AGIs $10k-25k, 0.0% for AGIs $25k-50k, 0.2% for AGIs $50k-75k, 0.7% for AGIs $75k-100k, 2.7% for AGIs over 100k)
Profit/loss from business: +$6,539 (reported on 11.5% of returns)
Here:
+$6,539
State:
+$9,547
(% of AGI for various income ranges: 10.2% for AGIs below $10k, 4.1% for AGIs $10k-25k, 1.6% for AGIs $25k-50k, 1.7% for AGIs $50k-75k, 1.7% for AGIs $75k-100k, 3.5% for AGIs over 100k)
IRA payment deduction: $2,188 (reported on 1.2% of returns)
49507:
$2,188
Michigan:
$2,875
(% of AGI for various income ranges: 0.1% for AGIs $10k-25k, 0.1% for AGIs $25k-50k, 0.1% for AGIs $50k-75k, 0.1% for AGIs $75k-100k)
Self-employed pension: $8,233 (reported on 0.2% of returns)
Here:
$8,233
Michigan:
$13,826
Total itemized deductions: $13,168 (25% of AGI, reported on 27.9% of returns)
Here:
$13,168
State:
$18,509
Here:
25.3% of AGI
State:
20.7% of AGI
(% of AGI for various income ranges: 5.6% for AGIs below $10k, 5.8% for AGIs $10k-25k, 12.8% for AGIs $25k-50k, 15.5% for AGIs $50k-75k, 17.3% for AGIs $75k-100k, 17.0% for AGIs over 100k)
Charity contributions deductions: $3,386 (6% of AGI, reported on 23.0% of returns)
Here:
$3,386
State:
$3,365
Here:
6.2% of AGI
State:
3.6% of AGI
(% of AGI for various income ranges: 0.6% for AGIs below $10k, 0.8% for AGIs $10k-25k, 2.1% for AGIs $25k-50k, 3.2% for AGIs $50k-75k, 4.5% for AGIs $75k-100k, 6.2% for AGIs over 100k)
Total tax: $3,433 (reported on 57.3% of returns)
49507:
$3,433
State:
$7,691
(% of AGI for various income ranges: 2.3% for AGIs below $10k, 2.6% for AGIs $10k-25k, 5.3% for AGIs $25k-50k, 8.4% for AGIs $50k-75k, 9.9% for AGIs $75k-100k, 15.3% for AGIs over 100k)
Earned income credit: $2,013 (reported on 33.5% of returns)
Here:
$2,013
State:
$1,737
Percentage of individuals using paid preparers for their 2004 taxes: 60.3%
Here:
60%
State:
60%
(% for various income ranges: 58.2% for AGIs below $10k, 68.1% for AGIs $10k-25k, 58.2% for AGIs $25k-50k, 51.9% for AGIs $50k-75k, 51.3% for AGIs $75k-100k, 57.3% for AGIs over 100k)
Likely homosexual households (counted as self-reported same-sex unmarried-partner households)
Lesbian couples: 0.0% of all households
Gay men: 0.4% of all households
Household received Food Stamps/SNAP in the past 12 months: 3,105 Household did not receive Food Stamps/SNAP in the past 12 months: 10,431
Women who had a birth in the past 12 months: 730 (373 now married, 349 unmarried) Women who did not have a birth in the past 12 months: 10,286 (3,297 now married, 7,005 unmarried)
Housing units in zip code 49507 with a mortgage: 5,157 (391 second mortgage, 38 home equity loan, 295 both second mortgage and home equity loan) Houses without a mortgage: 176
Median monthly owner costs for units with a mortgage: $1,137 Median monthly owner costs for units without a mortgage: $452
Residents with income below the poverty level in 2022:
This zip code:
27.5%
Whole state:
13.4%
Residents with income below 50% of the poverty level in 2022:
This zip code:
12.7%
Whole state:
6.9%
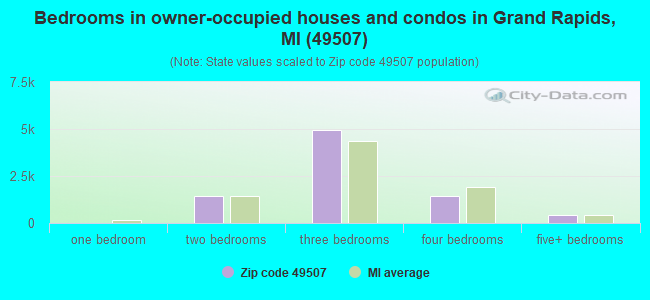
Median number of rooms in houses and condos:
Here:
6.5
State:
6.5
Median number of rooms in apartments:
Here:
5.2
State:
4.3
Notable locations in this zip code not listed on our city pages
Notable locations in zip code 49507: Grand Rapids Fire Department Division Street Station (A), Madison Square Library (B), Seymour Library (C), Grand Rapids Fire Department Kalamazoo Avenue Station (D). Display/hide their locations on the map
Churches in zip code 49507 include: Fuller Avenue Christian Church (A), Oakdale Park Christian Church (B), Oakdale United Methodist Church (C), Our Lady of Sorrows Church (D), Macedonia Church (E), New Life Church of God in Christ (F), Korean Grace Christian Reformed Church (G), Living Water Church of God in Christ (H), Living Word Christian Church (I). Display/hide their locations on the map
Parks in zip code 49507 include: South Field (1), Saint Andrew's Cemetery Historical Marker (2), MacKay Jaycees Park (3), Campus Park (4), Plaster Creek Family Park (5), Garfield Park (6). Display/hide their locations on the map
4,401 married couples with children.
5,161 single-parent households (772 men, 4,389 women).
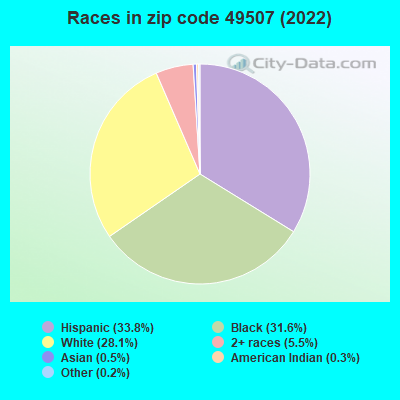
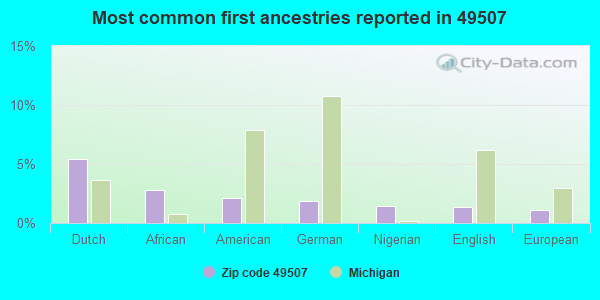
71.0% of residents of 49507 zip code speak English at home.
24.6% of residents speak Spanish at home (45% very well, 17% well, 26% not well, 11% not at all).
1.1% of residents speak other Indo-European language at home (46% very well, 51% well, 2% not well).
0.4% of residents speak Asian or Pacific Island language at home (35% very well, 51% well, 14% not well).
4.0% of residents speak other language at home (25% very well, 21% well, 38% not well, 15% not at all).
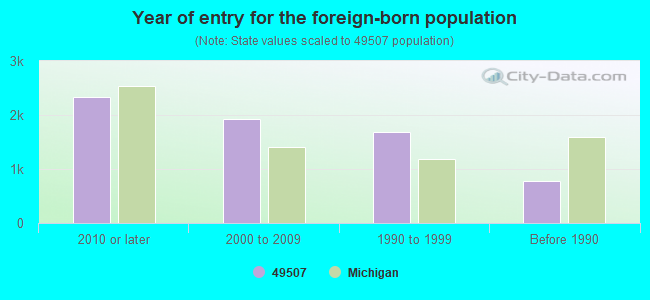
Foreign born population: 5,947 (14.9%) (22.7% of them are naturalized citizens)
Major facilities with environmental interests located in this zip code:
GUARDSMAN PRODUCTS INCORPORATED (1350 STEELE AVENUE SW in GRAND RAPIDS, MI)
AIR SYNTHETIC MINOR (AIRS/AFS) (Integrated Compliance Information System) - ICIS-05-1990-0025, FORMAL ENFORCEMENT ACTION, ICIS-05-1987-0042, COMPLIANCE ACTIVITY (Tracking inspections of insecticide, fungicide, and rodenticide, and toxic substances) (Resource Conservation and Recovery Act (tracking hazardous waste)) TRI REPORTER (Tracking of toxic chemicals releasing facilities) Business SIC classification: PLASTICS MATERIALS, SYNTHETIC RESINS, AND NONVULCANIZABLE ELASTOMERS; PAINTS, VARNISHES, LACQUERS, ENAMELS, AND ALLIED PRODUCTS Alternative names: COOK COMPOSITS, LILLY IND. INC.
ADVANCE PLATING & FINISHING (1529 S. DIVISION in GRAND RAPIDS, MI)
AIR MINOR (AIRS/AFS) HAZARDOUS WASTE BIENNIAL REPORTER (Resource Conservation and Recovery Act (tracking hazardous waste)) Large Quantity Generators, more that 1000 kg of hazardous waste/month (Resource Conservation and Recovery Act (tracking hazardous waste)) TRI REPORTER (Tracking of toxic chemicals releasing facilities) Business SIC and NAICS classification: ELECTROPLATING, PLATING, POLISHING, ANODIZING, AND COLORING Organizations: MARCUS STEPHENSON (CONTACT/OPERATOR)
ALEXANDER SCHOOL (1010 ALEXANDER SE in GRAND RAPIDS, MI)
(Geographic Names Information System) (National Center for Education Statistics) - STATE ID-00050 Organizations: GRAND RAPIDS PUBLIC SCHOOLS (SCHOOL DISTRICT)
ALGER SCHOOL (921 ALGER STREET SE in GRAND RAPIDS, MI)
(Geographic Names Information System) (National Center for Education Statistics) - STATE ID-00051 Organizations: GRAND RAPIDS PUBLIC SCHOOLS (SCHOOL DISTRICT)
DICKINSON SCHOOL (448 DICKINSON SE in GRAND RAPIDS, MI)
(Geographic Names Information System) (National Center for Education Statistics) - STATE ID-00917 Organizations: GRAND RAPIDS PUBLIC SCHOOLS (SCHOOL DISTRICT)
APEX RACK AND COATING CO (739 COTTAGE GROVE SE in GRAND RAPIDS, MI)
AIR MINOR (AIRS/AFS) (Resource Conservation and Recovery Act (tracking hazardous waste)) Business SIC classification: COATING, ENGRAVING, AND ALLIED SERVICES
GAST PB AND SONS CO INC (1515 MADISON AVE SE in GRAND RAPIDS, MI)
COMPLIANCE ACTIVITY (Tracking inspections of insecticide, fungicide, and rodenticide, and toxic substances) (Resource Conservation and Recovery Act (tracking hazardous waste)) Alternative names: P B GAST & SONS CO INC
BARCLAY AYERS AND BERTSCH CO (1655 STEELE SW in GRAND RAPIDS, MI)
(Resource Conservation and Recovery Act (tracking hazardous waste)) Organizations: BERTSCH JOHN R (CONTACT/OWNER)
BENTELER AUTOMOTIVE CORPORATION (320 HALL STREET SOUTHWEST in GRAND RAPIDS, MI)
CRITERIA AND HAZARDOUS AIR POLLUTANT INVENTORY (Inventory of air pollution sources) Small Quantity Generators, between 100 kg and 1000 kg of hazardous waste/month (Resource Conservation and Recovery Act (tracking hazardous waste)) TRI REPORTER (Tracking of toxic chemicals releasing facilities) Business SIC classification: FABRICATED METAL PRODUCTS Business NAICS classification: ALL OTHER MOTOR VEHICLE PARTS MANUFACTURING. Organizations: BENTELER CORP (CONTACT/OWNER)
Alternative names: BENTELER STAMPING
DIVERSIFIED INDUSTRIAL ENTERPRISES INC (1620 COLLEGE AVENUE SE in GRAND RAPIDS, MI)
(Resource Conservation and Recovery Act (tracking hazardous waste)) TRI REPORTER (Tracking of toxic chemicals releasing facilities) Business SIC classification: PLASTICS BOTTLES; PLASTICS PRODUCTS Business NAICS classification: ALL OTHER PLASTICS PRODUCT MANUFACTURING. Alternative names: WALRON INDUSTRIES
EXIDE BATTERY SALES INCO ELEC CORP (2690 S DIVISION AVE in GRAND RAPIDS, MI)
(Resource Conservation and Recovery Act (tracking hazardous waste)) Organizations: INCO ELECTRIC CORPORATION (CONTACT/OPERATOR)
ADVANCE PLATING (1555 MARSHALL SE in GRAND RAPIDS, MI)
(Resource Conservation and Recovery Act (tracking hazardous waste)) Business NAICS classification: ELECTROPLATING, PLATING, POLISHING, ANODIZING, AND COLORING.
AMERICAN DRY CLEANERS (413 HALL ST SE in GRAND RAPIDS, MI)
(Resource Conservation and Recovery Act (tracking hazardous waste))
Housing units lacking complete plumbing facilities: 0.7% Housing units lacking complete kitchen facilities: 0.7%
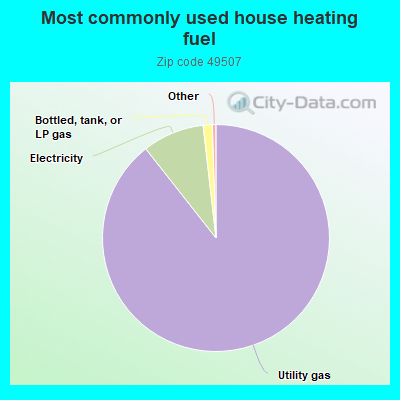
89.4%Utility gas
8.8%Electricity
1.3%Bottled, tank, or LP gas
Population in 1990: 37,681. Population change in the 1990s: +2,053 (+5.4%).
Place of birth for U.S.-born residents:
This state: 26,495
Northeast: 602
Midwest: 2,015
South: 2,848
West: 1,058
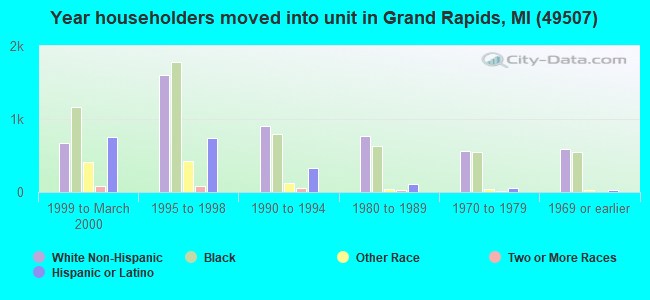
57% of the 49507 zip code residents lived in the same house 5 years ago. Out of people who lived in different houses, 74% lived in this county. Out of people who lived in different counties, 50% lived in Michigan.
88% of the 49507 zip code residents lived in the same house 1 year ago. Out of people who lived in different houses, 61% moved from this county. Out of people who lived in different houses, 19% moved from different county within same state. Out of people who lived in different houses, 17% moved from different state. Out of people who lived in different houses, 2% moved from abroad.
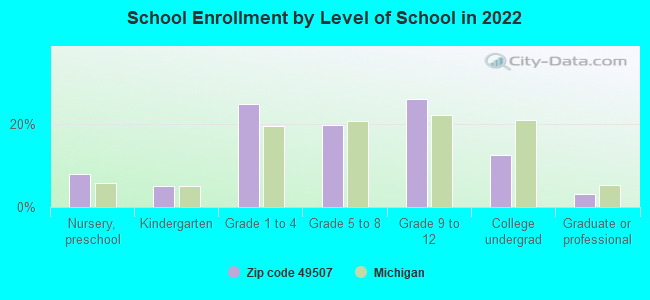
Private vs. public school enrollment:
Students in private schools in grades 1 to 8 (elementary and middle school): 551
Here:
11.3%
Michigan:
12.4%
Students in private schools in grades 9 to 12 (high school): 186
Here:
6.6%
Michigan:
9.8%
Students in private undergraduate colleges: 148
Here:
10.7%
Michigan:
14.9%
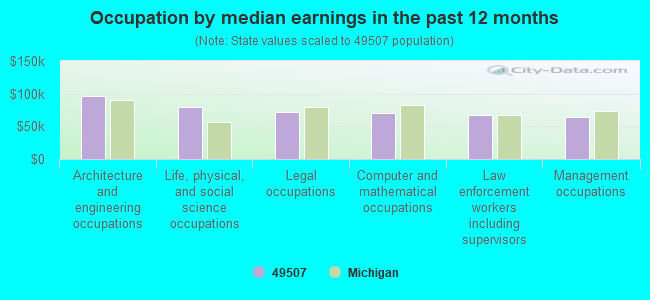
Occupation by median earnings in the past 12 months ($)
96,569Architecture and engineering occupations
79,524Life, physical, and social science occupations
71,307Legal occupations
69,705Computer and mathematical occupations
68,066Law enforcement workers including supervisors
64,656Management occupations
Companies with federal contracts located in this zip code (GRAND RAPIDS, MI):
PRECISION AEROSPACE CORP (704 CROFTON ST SE; small business) : $1,651,306 in 14 contractsfrom 2000 to 2006
Contracts for Wire, Nonelectrical, Plate, Sheet, Strip, Foil; and Leaf, Miscellaneous Electrical and Electronic Components, Plate, Sheet, Strip, and Foil; Nonferrous Base Metal, and moreby Navy, Defense Logistics Agency Signed by year:2000: $490,306; 2001: $97,634; 2002: $0; 2003: $213,561; 2004: $661,568; 2005: $138,560; 2006: $49,677.
Biggest contracts:
$592,800 with Navy for Wire, Nonelectrical. Signed on 2004-09-09. Completion date: 2005-03-09.
$490,306 with Navy for Plate, Sheet, Strip, Foil; and Leaf. Signed on 2000-09-20. Completion date: 2002-08-20.
$97,500 with Navy for Miscellaneous Electrical and Electronic Components. Signed on 2005-09-22. Completion date: 2006-10-31.
$93,561 with Navy for Plate, Sheet, Strip, and Foil; Nonferrous Base Metal. Signed on 2003-09-30. Completion date: 2004-02-27.
ABOVE & BEYOND CLEANING SERVIC (1119 BURTON STREET; small business) : $143,569 in 6 contractsfrom 2002 to 2005
Contracts for Custodial Janitorial Services by Navy Signed by year:2000: $0; 2001: $0; 2002: $34,337; 2003: $34,887; 2004: $36,831; 2005: $37,514; 2006: $0.
Biggest contracts:
$37,514 with Navy for Custodial Janitorial Services. Signed on 2005-11-15. Completion date: 2003-09-30.
$36,831, same as above.Signed on 2004-10-26. Completion date: 2003-09-30.
$34,998, same as above.Signed on 2003-10-01. Completion date: 2003-09-30.
$34,337, same as above.Signed on 2002-11-14. Completion date: 2003-09-30.
IEQ INDUSTRIES (2322 JEFFERSON DR SE; small business) : $50,960 in 2 contractsfrom 2000 to 2004
$37,505 with Navy for Hose, Pipe, Tube, Lubrication, and Railing Fittings. Signed on 2004-09-21. Completion date: 2004-09-30.
$13,455 with Navy for Maintenance, Repair or Alteration of Real Property -- Other Utilities. Taking place in IL. Signed on 2000-07-21. Completion date: 2000-08-30.
BUR-MAC CO INC (1555 JEFFERSON AVE SE; small business)
$3,960 with Defense Logistics Agency for Hardware, Commercial. Signed on 2004-10-27. Completion date: 2004-12-27.
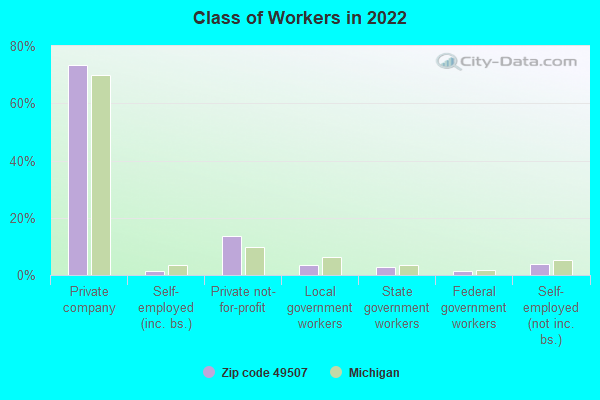
Top industries in this zip code by the number of employees in 2005:
Wholesale Trade: Piece Goods, Notions, and Other Dry Goods Merchant Wholesalers (250-499 employees: 1 establishment)
Wholesale Trade: Motor Vehicle Supplies and New Parts Merchant Wholesalers (100-249: 1, 20-49: 2)
Other Services (except Public Administration): Religious Organizations (50-99: 1, 10-19: 5, 5-9: 8, 1-4: 11)
Health Care and Social Assistance: Vocational Rehabilitation Services (100-249: 1, 20-49: 1, 5-9: 1, 1-4: 1)
Administrative and Support and Waste Management and Remediation Services: Janitorial Services (50-99: 1, 20-49: 2, 10-19: 1, 5-9: 2, 1-4: 5)
People in group quarters in 2010:
267 people in workers' group living quarters and job corps centers
110 people in correctional residential facilities
93 people in residential treatment centers for adults
26 people in emergency and transitional shelters (with sleeping facilities) for people experiencing homelessness
18 people in group homes intended for adults
People in group quarters in 2000:
193 people in job corps and vocational training facilities
97 people in homes or halfway houses for drug/alcohol abuse
75 people in other noninstitutional group quarters
39 people in halfway houses
28 people in state prisons
16 people in homes for the mentally ill
Fatal accident statistics in 2014:
Fatal accident count: 1
Vehicles involved in fatal accidents: 1
Fatal accidents caused by drunken drivers: 1
Fatalities: 1
Persons involved in fatal accidents: 1
Pedestrians involved in fatal accidents: 0
Fatal accident statistics in 2013:
Fatal accident count: 1
Vehicles involved in fatal accidents: 1
Fatal accidents caused by drunken drivers: 0
Fatalities: 1
Persons involved in fatal accidents: 2
Pedestrians involved in fatal accidents: 1
Home Mortgage Disclosure Act Aggregated Statistics For Year 2009 (Based on 8 full and 16 partial tracts)
A) FHA, FSA/RHS & VA Home Purchase Loans
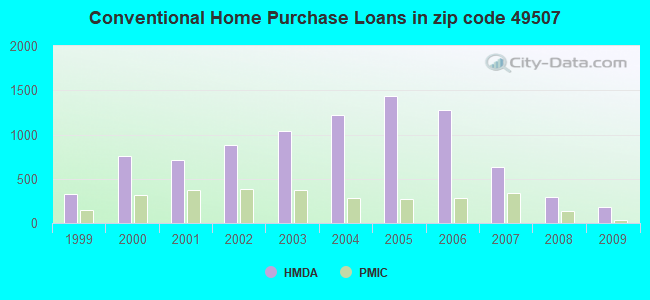
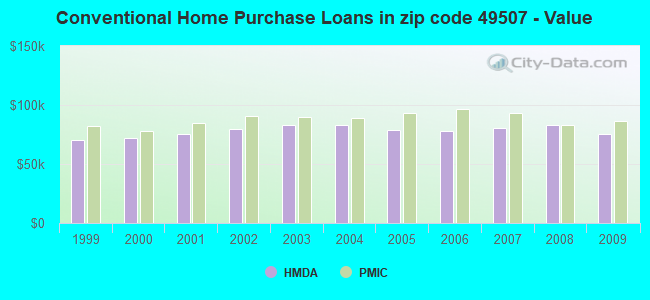
B) Conventional Home Purchase Loans
C) Refinancings
D) Home Improvement Loans
F) Non-occupant Loans on < 5 Family Dwellings (A B C & D)
G) Loans On Manufactured Home Dwelling (A B C & D)
Number
Average Value
Number
Average Value
Number
Average Value
Number
Average Value
Number
Average Value
Number
Average Value
LOANS ORIGINATED
281
$83,527
178
$75,578
627
$92,808
47
$43,621
151
$58,379
0
$0
APPLICATIONS APPROVED, NOT ACCEPTED
19
$73,143
5
$56,400
83
$100,829
4
$16,565
8
$60,806
0
$0
APPLICATIONS DENIED
81
$73,102
49
$52,739
329
$88,085
76
$22,057
73
$56,855
1
$75,180
APPLICATIONS WITHDRAWN
47
$75,635
22
$58,325
182
$92,895
10
$28,565
14
$56,789
0
$0
FILES CLOSED FOR INCOMPLETENESS
5
$122,170
6
$74,377
60
$92,596
3
$44,430
9
$67,188
0
$0
Aggregated Statistics For Year 2008 (Based on 8 full and 16 partial tracts)
A) FHA, FSA/RHS & VA Home Purchase Loans
B) Conventional Home Purchase Loans
C) Refinancings
D) Home Improvement Loans
E) Loans on Dwellings For 5+ Families
F) Non-occupant Loans on < 5 Family Dwellings (A B C & D)
G) Loans On Manufactured Home Dwelling (A B C & D)
Number
Average Value
Number
Average Value
Number
Average Value
Number
Average Value
Number
Average Value
Number
Average Value
Number
Average Value
LOANS ORIGINATED
202
$86,709
289
$82,932
618
$85,015
123
$27,090
1
$310,600
257
$66,070
0
$0
APPLICATIONS APPROVED, NOT ACCEPTED
25
$87,691
23
$62,040
105
$95,304
12
$41,476
0
$0
23
$67,551
1
$39,480
APPLICATIONS DENIED
65
$81,082
130
$60,934
675
$92,468
151
$36,413
0
$0
175
$59,534
3
$37,000
APPLICATIONS WITHDRAWN
19
$80,409
42
$78,759
159
$94,145
23
$29,446
0
$0
33
$68,669
0
$0
FILES CLOSED FOR INCOMPLETENESS
8
$67,581
23
$113,570
41
$91,702
12
$30,916
0
$0
5
$66,230
0
$0
Aggregated Statistics For Year 2007 (Based on 8 full and 16 partial tracts)
A) FHA, FSA/RHS & VA Home Purchase Loans
B) Conventional Home Purchase Loans
C) Refinancings
D) Home Improvement Loans
E) Loans on Dwellings For 5+ Families
F) Non-occupant Loans on < 5 Family Dwellings (A B C & D)
G) Loans On Manufactured Home Dwelling (A B C & D)
Number
Average Value
Number
Average Value
Number
Average Value
Number
Average Value
Number
Average Value
Number
Average Value
Number
Average Value
LOANS ORIGINATED
93
$96,259
628
$80,796
939
$85,538
189
$33,291
3
$636,937
327
$70,726
0
$0
APPLICATIONS APPROVED, NOT ACCEPTED
7
$80,636
100
$78,600
282
$84,255
32
$41,848
0
$0
97
$83,673
0
$0
APPLICATIONS DENIED
55
$99,018
315
$81,905
1,310
$88,096
308
$32,731
2
$74,590
296
$79,264
3
$47,563
APPLICATIONS WITHDRAWN
18
$105,464
122
$80,368
369
$89,724
17
$45,401
0
$0
82
$73,068
0
$0
FILES CLOSED FOR INCOMPLETENESS
5
$60,712
49
$91,341
169
$97,719
25
$24,263
0
$0
43
$80,121
0
$0
Aggregated Statistics For Year 2006 (Based on 8 full and 16 partial tracts)
A) FHA, FSA/RHS & VA Home Purchase Loans
B) Conventional Home Purchase Loans
C) Refinancings
D) Home Improvement Loans
E) Loans on Dwellings For 5+ Families
F) Non-occupant Loans on < 5 Family Dwellings (A B C & D)
G) Loans On Manufactured Home Dwelling (A B C & D)
Number
Average Value
Number
Average Value
Number
Average Value
Number
Average Value
Number
Average Value
Number
Average Value
Number
Average Value
LOANS ORIGINATED
142
$98,560
1,272
$77,759
1,465
$80,472
271
$31,409
2
$851,830
514
$70,685
2
$36,215
APPLICATIONS APPROVED, NOT ACCEPTED
4
$116,545
279
$69,051
408
$81,188
44
$36,009
0
$0
132
$64,857
0
$0
APPLICATIONS DENIED
42
$96,396
673
$80,480
1,608
$88,736
391
$33,742
2
$10,490,240
396
$79,421
7
$32,986
APPLICATIONS WITHDRAWN
23
$96,625
276
$80,196
746
$93,682
46
$53,935
0
$0
149
$78,000
0
$0
FILES CLOSED FOR INCOMPLETENESS
9
$105,940
66
$86,431
278
$95,741
7
$54,166
0
$0
32
$82,215
0
$0
Aggregated Statistics For Year 2005 (Based on 8 full and 16 partial tracts)
A) FHA, FSA/RHS & VA Home Purchase Loans
B) Conventional Home Purchase Loans
C) Refinancings
D) Home Improvement Loans
E) Loans on Dwellings For 5+ Families
F) Non-occupant Loans on < 5 Family Dwellings (A B C & D)
G) Loans On Manufactured Home Dwelling (A B C & D)
Number
Average Value
Number
Average Value
Number
Average Value
Number
Average Value
Number
Average Value
Number
Average Value
Number
Average Value
LOANS ORIGINATED
166
$95,807
1,434
$78,807
2,067
$82,740
280
$28,681
0
$0
629
$72,957
1
$4,630
APPLICATIONS APPROVED, NOT ACCEPTED
9
$84,482
278
$75,476
455
$83,743
63
$40,637
0
$0
75
$73,070
0
$0
APPLICATIONS DENIED
31
$92,728
608
$73,627
1,987
$89,073
459
$32,420
2
$7,557,440
286
$72,743
14
$41,549
APPLICATIONS WITHDRAWN
31
$96,628
341
$84,371
1,213
$94,013
99
$107,663
0
$0
144
$95,718
0
$0
FILES CLOSED FOR INCOMPLETENESS
7
$85,906
68
$83,521
332
$92,670
15
$32,482
0
$0
16
$75,640
1
$83,620
Aggregated Statistics For Year 2004 (Based on 8 full and 16 partial tracts)
A) FHA, FSA/RHS & VA Home Purchase Loans
B) Conventional Home Purchase Loans
C) Refinancings
D) Home Improvement Loans
E) Loans on Dwellings For 5+ Families
F) Non-occupant Loans on < 5 Family Dwellings (A B C & D)
G) Loans On Manufactured Home Dwelling (A B C & D)
Number
Average Value
Number
Average Value
Number
Average Value
Number
Average Value
Number
Average Value
Number
Average Value
Number
Average Value
LOANS ORIGINATED
337
$93,686
1,223
$83,292
2,136
$79,593
320
$33,426
4
$132,805
563
$70,231
6
$74,048
APPLICATIONS APPROVED, NOT ACCEPTED
30
$86,469
265
$77,932
561
$82,953
54
$34,066
4
$201,425
111
$68,537
0
$0
APPLICATIONS DENIED
69
$86,812
425
$76,448
1,913
$78,611
483
$27,222
0
$0
224
$71,479
18
$45,114
APPLICATIONS WITHDRAWN
18
$90,233
152
$97,151
731
$85,867
60
$49,060
0
$0
58
$70,437
2
$87,960
FILES CLOSED FOR INCOMPLETENESS
6
$86,623
49
$91,748
465
$89,140
18
$44,711
0
$0
34
$69,023
0
$0
Aggregated Statistics For Year 2003 (Based on 8 full and 16 partial tracts)
A) FHA, FSA/RHS & VA Home Purchase Loans
B) Conventional Home Purchase Loans
C) Refinancings
D) Home Improvement Loans
E) Loans on Dwellings For 5+ Families
F) Non-occupant Loans on < 5 Family Dwellings (A B C & D)
Number
Average Value
Number
Average Value
Number
Average Value
Number
Average Value
Number
Average Value
Number
Average Value
LOANS ORIGINATED
509
$90,474
1,035
$83,052
3,641
$79,954
254
$27,539
2
$229,960
519
$69,547
APPLICATIONS APPROVED, NOT ACCEPTED
24
$80,750
155
$80,673
677
$78,407
61
$16,936
0
$0
99
$68,015
APPLICATIONS DENIED
63
$85,150
272
$71,671
1,827
$71,941
423
$17,383
0
$0
202
$60,629
APPLICATIONS WITHDRAWN
49
$81,290
109
$91,466
887
$79,812
45
$35,891
0
$0
57
$69,553
FILES CLOSED FOR INCOMPLETENESS
34
$90,354
54
$72,097
329
$82,358
10
$21,616
1
$172,320
37
$65,174
Aggregated Statistics For Year 2002 (Based on 8 full and 16 partial tracts)
A) FHA, FSA/RHS & VA Home Purchase Loans
B) Conventional Home Purchase Loans
C) Refinancings
D) Home Improvement Loans
E) Loans on Dwellings For 5+ Families
F) Non-occupant Loans on < 5 Family Dwellings (A B C & D)
Number
Average Value
Number
Average Value
Number
Average Value
Number
Average Value
Number
Average Value
Number
Average Value
LOANS ORIGINATED
522
$83,896
877
$79,536
2,980
$77,140
291
$19,429
4
$298,490
432
$55,978
APPLICATIONS APPROVED, NOT ACCEPTED
14
$88,789
87
$74,927
497
$69,475
58
$16,094
0
$0
51
$55,996
APPLICATIONS DENIED
66
$85,544
166
$67,990
1,418
$66,259
405
$10,155
2
$34,260
107
$53,678
APPLICATIONS WITHDRAWN
48
$74,709
93
$77,523
800
$74,366
35
$17,756
0
$0
36
$48,008
FILES CLOSED FOR INCOMPLETENESS
12
$96,361
60
$94,111
255
$78,830
5
$11,190
0
$0
24
$67,282
Aggregated Statistics For Year 2001 (Based on 8 full and 16 partial tracts)
A) FHA, FSA/RHS & VA Home Purchase Loans
B) Conventional Home Purchase Loans
C) Refinancings
D) Home Improvement Loans
E) Loans on Dwellings For 5+ Families
F) Non-occupant Loans on < 5 Family Dwellings (A B C & D)
Number
Average Value
Number
Average Value
Number
Average Value
Number
Average Value
Number
Average Value
Number
Average Value
LOANS ORIGINATED
572
$80,964
711
$75,477
2,379
$70,935
444
$16,186
2
$269,460
294
$51,861
APPLICATIONS APPROVED, NOT ACCEPTED
33
$80,939
98
$69,412
369
$62,046
98
$14,535
0
$0
45
$52,889
APPLICATIONS DENIED
67
$68,299
230
$56,093
1,720
$57,235
806
$12,173
0
$0
172
$47,878
APPLICATIONS WITHDRAWN
28
$68,344
54
$69,045
656
$62,397
56
$24,797
0
$0
47
$45,277
FILES CLOSED FOR INCOMPLETENESS
17
$75,834
23
$65,403
180
$69,533
4
$29,018
0
$0
22
$61,940
Aggregated Statistics For Year 2000 (Based on 8 full and 16 partial tracts)
A) FHA, FSA/RHS & VA Home Purchase Loans
B) Conventional Home Purchase Loans
C) Refinancings
D) Home Improvement Loans
F) Non-occupant Loans on < 5 Family Dwellings (A B C & D)
Number
Average Value
Number
Average Value
Number
Average Value
Number
Average Value
Number
Average Value
LOANS ORIGINATED
678
$74,519
753
$71,696
1,020
$50,836
440
$14,281
248
$44,067
APPLICATIONS APPROVED, NOT ACCEPTED
32
$77,847
86
$61,513
340
$50,623
145
$20,559
54
$38,496
APPLICATIONS DENIED
56
$66,484
263
$54,821
1,239
$45,455
813
$12,698
160
$40,277
APPLICATIONS WITHDRAWN
57
$70,722
88
$59,626
425
$54,439
32
$33,687
45
$48,290
FILES CLOSED FOR INCOMPLETENESS
11
$67,102
25
$57,806
221
$65,171
8
$24,586
12
$82,792
Aggregated Statistics For Year 1999 (Based on 5 full and 8 partial tracts)
A) FHA, FSA/RHS & VA Home Purchase Loans
B) Conventional Home Purchase Loans
C) Refinancings
D) Home Improvement Loans
F) Non-occupant Loans on < 5 Family Dwellings (A B C & D)
2002 - 2018 National Fire Incident Reporting System (NFIRS) incidents
Based on the data from the years 2002 - 2018 the average number of fires per year is 170. The highest number of reported fires - 254 took place in 2007, and the least - 120 in 2015. The data has a decreasing trend.
When looking into fire subcategories, the most incidents belonged to: Structure Fires (50.8%), and Mobile Property/Vehicle Fires (24.1%).
Fire incident types reported to NFIRS in Zip Code 49507


 Nearest zip codes: 49503, 49506, 49509, 49548, 49508, 49505.
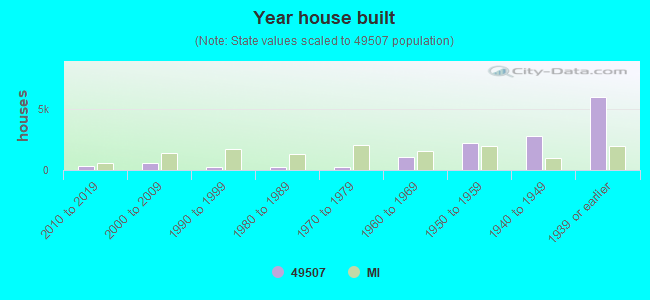


 Based on the data from the years 2002 - 2018 the average number of fires per year is 170. The highest number of reported fires - 254 took place in 2007, and the least - 120 in 2015. The data has a decreasing trend.
 When looking into fire subcategories, the most incidents belonged to: Structure Fires (50.8%), and Mobile Property/Vehicle Fires (24.1%).