Estimated zip code population in 2022: 577 Zip code population in 2010: 680 Zip code population in 2000: 615
Houses and condos: 192 Renter-occupied apartments: 22
% of renters here:
11%
State:
28%
March 2022 cost of living index in zip code 50001: 85.8 (less than average, U.S. average is 100)
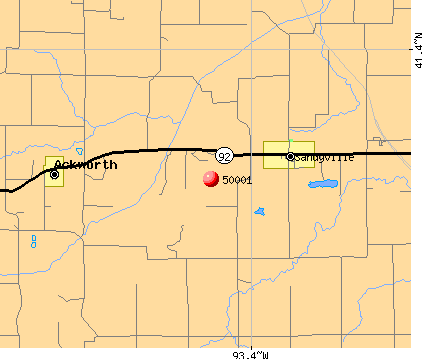
Land area: 24.0 sq. mi. Water area: 0.3 sq. mi.
Population density: 24 people per square mile
(very low).
OSM Map
General Map
Google Map
MSN Map
OSM Map
General Map
Google Map
MSN Map
OSM Map
General Map
Google Map
MSN Map
OSM Map
General Map
Google Map
MSN Map
Please wait while loading the map...
Real estate property taxes paid for housing units in 2022:
This zip code:
0.8% ($3,094)
Iowa:
1.4% ($2,724)
Median real estate property taxes paid for housing units with mortgages in 2022: $4,424 (1.7%) Median real estate property taxes paid for housing units with no mortgage in 2022: $2,241 (1.0%)
Estimated median house/condo value in 2022: $378,163
50001:
$378,163
Iowa:
$194,600
According to our research of Iowa and other state lists, there was 1 registered sex offender living in 50001 zip code as of April 23, 2024. The ratio of all residents to sex offenders in zip code 50001 is 583 to 1. The ratio of registered sex offenders to all residents in this zip code is lower than the state average.
Median resident age:
This zip code:
39.1 years
Iowa median age:
38.9 years
Average household size:
This zip code:
2.9 people
Iowa:
2.3 people
Averages for the 2020 tax year for zip code 50001, filed in 2021:
Average Adjusted Gross Income (AGI) in 2020: $74,745 (Individual Income Tax Returns)
Here:
$74,745
State:
$71,087
Salary/wage: $64,469 (reported on 83.9% of returns)
Here:
$64,469
State:
$57,361
(% of AGI for various income ranges: 813.3% for AGIs below $25k, 3456.0% for AGIs $25k-50k, 5105.0% for AGIs $50k-75k, 9410.0% for AGIs $75k-100k, 21244.0% for AGIs $100k-200k)
Taxable interest for individuals: $300 (reported on 41.9% of returns)
This zip code:
$300
Iowa:
$1,633
(% of AGI for various income ranges: 16.7% for AGIs below $25k, 22.5% for AGIs $50k-75k, 40.0% for AGIs $100k-200k)
Ordinary dividends: $733 (reported on 19.4% of returns)
Here:
$733
State:
$5,432
(% of AGI for various income ranges: 60.0% for AGIs $25k-50k, 28.0% for AGIs $100k-200k)
Net capital gain/loss in AGI: +$960 (reported on 16.1% of returns)
Here:
+$960
State:
+$15,243
(% of AGI for various income ranges: 54.0% for AGIs $25k-50k, 42.0% for AGIs $100k-200k)
Profit/loss from business: +$15,775 (reported on 12.9% of returns)
Here:
+$15,775
State:
+$11,763
(% of AGI for various income ranges: 3155.0% for AGIs $75k-100k)
Taxable individual retirement arrangement distribution: $13,733 (reported on 9.7% of returns)
50001:
$13,733
Iowa:
$17,324
(% of AGI for various income ranges: 1030.0% for AGIs $50k-75k)
Earned income credit: $1,900 (reported on 12.9% of returns)
Here:
$1,900
State:
$2,195
(% of AGI for various income ranges: 126.7% for AGIs below $25k)
Percentage of individuals using paid preparers for their 2020 taxes: 93.5%
Here:
94%
State:
95%
(% for various income ranges: 87.5% for AGIs below $25k, 100.0% for AGIs $25k-50k, 100.0% for AGIs $50k-75k, 100.0% for AGIs $75k-100k, 88.9% for AGIs $100k-200k)
Averages for the 2012 tax year for zip code 50001, filed in 2013:
Average Adjusted Gross Income (AGI) in 2012: $56,400 (Individual Income Tax Returns)
Here:
$56,400
State:
$58,860
Salary/wage: $55,126 (reported on 82.1% of returns)
Here:
$55,126
State:
$46,659
(% of AGI for various income ranges: 73.4% for AGIs below $25k, 70.1% for AGIs $25k-50k, 71.3% for AGIs $50k-75k, 90.8% for AGIs $75k-100k, 84.5% for AGIs $100k-200k)
Taxable interest for individuals: $370 (reported on 35.7% of returns)
This zip code:
$370
Iowa:
$1,537
(% of AGI for various income ranges: 1.5% for AGIs below $25k, 0.2% for AGIs $50k-75k, 0.2% for AGIs $100k-200k)
Ordinary dividends: $843 (reported on 25.0% of returns)
Here:
$843
State:
$4,542
Profit/loss from business: +$7,120 (reported on 17.9% of returns)
Here:
+$7,120
State:
+$10,509
Total itemized deductions: $18,540 (21% of AGI, reported on 35.7% of returns)
Here:
$18,540
State:
$21,278
Here:
20.9% of AGI
State:
18.9% of AGI
(% of AGI for various income ranges: 28.2% for AGIs $25k-50k, 14.5% for AGIs $75k-100k, 14.1% for AGIs $100k-200k)
Charity contributions: $3,129 (reported on 25.0% of returns)
Here:
$3,129
State:
$4,044
Taxes paid: $7,480 (reported on 35.7% of returns)
50001:
$7,480
State:
$8,846
(% of AGI for various income ranges: 8.9% for AGIs $25k-50k, 6.2% for AGIs $75k-100k, 6.3% for AGIs $100k-200k)
Earned income credit: $2,233 (reported on 10.7% of returns)
Here:
$2,233
State:
$2,098
(% of AGI for various income ranges: 6.0% for AGIs below $25k)
Percentage of individuals using paid preparers for their 2012 taxes: 75.0%
Here:
75%
State:
65%
(% for various income ranges: 77.8% for AGIs below $25k, 80.0% for AGIs $25k-50k, 66.7% for AGIs $50k-75k, 100.0% for AGIs $75k-100k, 60.0% for AGIs $100k-200k)
Averages for the 2004 tax year for zip code 50001, filed in 2005:
Average Adjusted Gross Income (AGI) in 2004: $49,525 (Individual Income Tax Returns)
Here:
$49,525
State:
$43,875
Salary/wage: $45,700 (reported on 87.9% of returns)
Here:
$45,700
State:
$38,265
(% of AGI for various income ranges: 85.5% for AGIs below $10k, 76.0% for AGIs $10k-25k, 85.5% for AGIs $25k-50k, 86.4% for AGIs $50k-75k, 79.5% for AGIs $75k-100k, 75.7% for AGIs over 100k)
Taxable interest for individuals: $412 (reported on 44.9% of returns)
This zip code:
$412
Iowa:
$1,768
(% of AGI for various income ranges: 1.3% for AGIs $10k-25k, 0.5% for AGIs $25k-50k, 0.2% for AGIs $50k-75k, 0.3% for AGIs $75k-100k, 0.4% for AGIs over 100k)
Taxable dividends: $263 (reported on 28.7% of returns)
Here:
$263
State:
$2,510
(% of AGI for various income ranges: 1.2% for AGIs below $10k, 0.4% for AGIs $25k-50k, 0.1% for AGIs $50k-75k, 0.2% for AGIs $75k-100k, 0.0% for AGIs over 100k)
Net capital gain/loss: +$2,942 (reported on 19.6% of returns)
Here:
+$2,942
State:
+$6,139
Profit/loss from business: +$1,906 (reported on 12.1% of returns)
Here:
+$1,906
State:
+$8,574
Total itemized deductions: $17,406 (22% of AGI, reported on 38.1% of returns)
Here:
$17,406
State:
$16,976
Here:
21.8% of AGI
State:
20.8% of AGI
(% of AGI for various income ranges: 11.1% for AGIs $25k-50k, 14.6% for AGIs $50k-75k, 13.9% for AGIs $75k-100k, 17.7% for AGIs over 100k)
Charity contributions deductions: $1,915 (2% of AGI, reported on 30.9% of returns)
Here:
$1,915
State:
$3,089
Here:
2.4% of AGI
State:
3.6% of AGI
(% of AGI for various income ranges: 1.5% for AGIs $25k-50k, 1.5% for AGIs $50k-75k, 0.6% for AGIs $75k-100k, 1.8% for AGIs over 100k)
Total tax: $6,090 (reported on 80.0% of returns)
50001:
$6,090
State:
$6,177
(% of AGI for various income ranges: 1.7% for AGIs below $10k, 4.5% for AGIs $10k-25k, 6.9% for AGIs $25k-50k, 8.2% for AGIs $50k-75k, 11.0% for AGIs $75k-100k, 14.1% for AGIs over 100k)
Earned income credit: $955 (reported on 8.3% of returns)
Here:
$955
State:
$1,540
Percentage of individuals using paid preparers for their 2004 taxes: 74.3%
Here:
74%
State:
70%
(% for various income ranges: 65.1% for AGIs below $10k, 68.8% for AGIs $10k-25k, 79.3% for AGIs $25k-50k, 82.7% for AGIs $50k-75k, 72.7% for AGIs $75k-100k, 75.0% for AGIs over 100k)
Household received Food Stamps/SNAP in the past 12 months: 15 Household did not receive Food Stamps/SNAP in the past 12 months: 180
Women who had a birth in the past 12 months: 12 (12 now married, 0 unmarried) Women who did not have a birth in the past 12 months: 129 (56 now married, 73 unmarried)
Housing units in zip code 50001 with a mortgage: 101 (1 second mortgage) Median monthly owner costs for units with a mortgage: $1,687 Median monthly owner costs for units without a mortgage: $536
Residents with income below the poverty level in 2022:
This zip code:
6.8%
Whole state:
11.0%
Residents with income below 50% of the poverty level in 2022:
This zip code:
2.6%
Whole state:
5.5%
Median number of rooms in houses and condos:
Here:
6.5
State:
6.8
Median number of rooms in apartments:
Here:
5.2
State:
4.2
Notable locations in this zip code not listed on our city pages
Size of family households: 39 2-persons, 47 3-persons, 11 4-persons, 31 5-persons, 11 6-persons
Size of nonfamily households: 53 1-person
126 married couples with children.
24 single-parent households (8 men, 16 women).
99.1% of residents of 50001 zip code speak English at home.
0.2% of residents speak Spanish at home (100% very well).
Foreign born population: 0 (0.0%)
:
0.0%
Whole state:
6.0%
44%German
26%American
15%Irish
5%Danish
3%English
2%French
1%Dutch
Facilities with environmental interests located in this zip code:
M & J FARM GARAGE (1843 KEOKUK AVE in ACKWORTH, IA)
(Resource Conservation and Recovery Act (tracking hazardous waste)) Business NAICS classification: GENERAL AUTOMOTIVE REPAIR.
RIVERSIDE CONTRACTING, INC. (7 1/2 MILES WEST OF DIXON in DIXON, MT) . Tribal Land
ENFORCEMENT/COMPLIANCE ACTIVITY (Integrated Compliance Information System) Business SIC classification: HIGHWAY AND STREET CONSTRUCTION, EXCEPT ELEVATED HIGHWAYS
JIM PHILLIPS AUTO SALVAGE (6634 UNION ST in ACKWORTH, IA)
COMPLIANCE ACTIVITY (Tracking inspections of insecticide, fungicide, and rodenticide, and toxic substances)
86.2%Bottled, tank, or LP gas
10.6%Electricity
3.2%Utility gas
0.5%Wood
Population in 1990: 491. Population change in the 1990s: +124 (+25.3%).
Place of birth for U.S.-born residents:
This state: 444
Northeast: 8
Midwest: 82
South: 23
West: 17
61% of the 50001 zip code residents lived in the same house 5 years ago. Out of people who lived in different houses, 50% lived in this county. Out of people who lived in different counties, 50% lived in Iowa.
99% of the 50001 zip code residents lived in the same house 1 year ago. Out of people who lived in different houses, 120% moved from this county.
Private vs. public school enrollment:
Students in private schools in grades 1 to 8 (elementary and middle school): 13
Here:
18.7%
Iowa:
10.6%
Students in private schools in grades 9 to 12 (high school):
Here:
0.0%
Iowa:
7.9%
Students in private undergraduate colleges: 11
Here:
35.4%
Iowa:
23.9%
Occupation by median earnings in the past 12 months ($)
86,266Health diagnosing and treating practitioners and other technical occupations
73,482Installation, maintenance, and repair occupations
71,235Office and administrative support occupations
69,635Business and financial operations occupations
66,126Construction and extraction occupations
62,360Management occupations
Top industries in this zip code by the number of employees in 2005:
Construction: Commercial and Institutional Building Construction (5-9 employees: 1 establishment)
Real Estate and Rental and Leasing: Lessors of Miniwarehouses and Self-Storage Units (1-4: 1)
Real Estate and Rental and Leasing: Lessors of Other Real Estate Property (1-4: 1)
Construction: New Single-Family Housing Construction (except Operative Builders) (1-4: 1)
Construction: Drywall and Insulation Contractors (1-4: 1)
Other Services (except Public Administration): Religious Organizations (1-4: 1)
Health Care and Social Assistance: Offices of Dentists (1-4: 1)
Construction: All Other Specialty Trade Contractors (1-4: 1)
Home Mortgage Disclosure Act Aggregated Statistics For Year 2009 (Based on 4 partial tracts)
A) FHA, FSA/RHS & VA Home Purchase Loans
B) Conventional Home Purchase Loans
C) Refinancings
D) Home Improvement Loans
F) Non-occupant Loans on < 5 Family Dwellings (A B C & D)
G) Loans On Manufactured Home Dwelling (A B C & D)
Number
Average Value
Number
Average Value
Number
Average Value
Number
Average Value
Number
Average Value
Number
Average Value
LOANS ORIGINATED
4
$132,925
8
$184,750
47
$170,809
5
$58,368
3
$108,370
3
$99,813
APPLICATIONS APPROVED, NOT ACCEPTED
0
$0
0
$0
6
$153,005
0
$0
0
$0
0
$0
APPLICATIONS DENIED
2
$151,905
1
$81,350
18
$155,401
2
$46,730
0
$0
0
$0
APPLICATIONS WITHDRAWN
0
$0
1
$81,010
10
$156,339
1
$23,170
0
$0
1
$47,660
FILES CLOSED FOR INCOMPLETENESS
1
$113,420
0
$0
0
$0
0
$0
0
$0
0
$0
Aggregated Statistics For Year 2008 (Based on 4 partial tracts)
A) FHA, FSA/RHS & VA Home Purchase Loans
B) Conventional Home Purchase Loans
C) Refinancings
D) Home Improvement Loans
F) Non-occupant Loans on < 5 Family Dwellings (A B C & D)
G) Loans On Manufactured Home Dwelling (A B C & D)
Number
Average Value
Number
Average Value
Number
Average Value
Number
Average Value
Number
Average Value
Number
Average Value
LOANS ORIGINATED
4
$144,175
12
$174,208
26
$151,630
7
$90,946
2
$73,970
2
$89,940
APPLICATIONS APPROVED, NOT ACCEPTED
0
$0
2
$143,830
3
$151,810
0
$0
0
$0
0
$0
APPLICATIONS DENIED
0
$0
2
$97,120
18
$138,668
5
$47,866
1
$16,550
1
$60,570
APPLICATIONS WITHDRAWN
0
$0
2
$156,955
6
$121,878
1
$21,980
0
$0
0
$0
FILES CLOSED FOR INCOMPLETENESS
0
$0
0
$0
1
$212,830
0
$0
0
$0
0
$0
Aggregated Statistics For Year 2007 (Based on 4 partial tracts)
A) FHA, FSA/RHS & VA Home Purchase Loans
B) Conventional Home Purchase Loans
C) Refinancings
D) Home Improvement Loans
F) Non-occupant Loans on < 5 Family Dwellings (A B C & D)
G) Loans On Manufactured Home Dwelling (A B C & D)
Number
Average Value
Number
Average Value
Number
Average Value
Number
Average Value
Number
Average Value
Number
Average Value
LOANS ORIGINATED
1
$107,570
18
$138,142
23
$115,891
4
$37,112
2
$129,865
1
$136,160
APPLICATIONS APPROVED, NOT ACCEPTED
0
$0
1
$166,490
6
$148,220
1
$63,820
0
$0
0
$0
APPLICATIONS DENIED
0
$0
7
$96,871
19
$126,790
6
$49,665
1
$87,720
2
$39,685
APPLICATIONS WITHDRAWN
0
$0
1
$129,090
6
$145,738
1
$100,290
0
$0
0
$0
FILES CLOSED FOR INCOMPLETENESS
0
$0
1
$187,950
4
$153,458
1
$64,030
0
$0
0
$0
Aggregated Statistics For Year 2006 (Based on 4 partial tracts)
A) FHA, FSA/RHS & VA Home Purchase Loans
B) Conventional Home Purchase Loans
C) Refinancings
D) Home Improvement Loans
F) Non-occupant Loans on < 5 Family Dwellings (A B C & D)
G) Loans On Manufactured Home Dwelling (A B C & D)
Number
Average Value
Number
Average Value
Number
Average Value
Number
Average Value
Number
Average Value
Number
Average Value
LOANS ORIGINATED
2
$99,355
18
$142,442
38
$129,602
8
$34,029
1
$102,580
2
$83,745
APPLICATIONS APPROVED, NOT ACCEPTED
0
$0
5
$107,690
5
$107,796
0
$0
0
$0
0
$0
APPLICATIONS DENIED
0
$0
3
$127,470
20
$111,264
3
$40,423
0
$0
0
$0
APPLICATIONS WITHDRAWN
0
$0
4
$128,135
12
$115,587
1
$25,440
1
$31,120
0
$0
FILES CLOSED FOR INCOMPLETENESS
0
$0
1
$83,080
6
$166,947
0
$0
0
$0
0
$0
Aggregated Statistics For Year 2005 (Based on 4 partial tracts)
A) FHA, FSA/RHS & VA Home Purchase Loans
B) Conventional Home Purchase Loans
C) Refinancings
D) Home Improvement Loans
F) Non-occupant Loans on < 5 Family Dwellings (A B C & D)
G) Loans On Manufactured Home Dwelling (A B C & D)
Number
Average Value
Number
Average Value
Number
Average Value
Number
Average Value
Number
Average Value
Number
Average Value
LOANS ORIGINATED
2
$162,440
22
$125,671
37
$130,535
9
$55,687
3
$161,877
3
$68,357
APPLICATIONS APPROVED, NOT ACCEPTED
0
$0
2
$107,975
7
$140,916
1
$20,620
0
$0
1
$47,660
APPLICATIONS DENIED
0
$0
6
$101,242
23
$110,733
3
$47,860
1
$62,150
2
$53,190
APPLICATIONS WITHDRAWN
0
$0
2
$109,945
11
$125,309
0
$0
0
$0
1
$68,190
FILES CLOSED FOR INCOMPLETENESS
0
$0
1
$65,720
7
$136,291
1
$22,910
0
$0
0
$0
Aggregated Statistics For Year 2004 (Based on 4 partial tracts)
A) FHA, FSA/RHS & VA Home Purchase Loans
B) Conventional Home Purchase Loans
C) Refinancings
D) Home Improvement Loans
F) Non-occupant Loans on < 5 Family Dwellings (A B C & D)
G) Loans On Manufactured Home Dwelling (A B C & D)
Number
Average Value
Number
Average Value
Number
Average Value
Number
Average Value
Number
Average Value
Number
Average Value
LOANS ORIGINATED
1
$183,640
20
$134,394
36
$106,384
6
$37,588
2
$67,700
3
$62,663
APPLICATIONS APPROVED, NOT ACCEPTED
0
$0
3
$112,963
8
$124,435
1
$9,990
0
$0
1
$50,450
APPLICATIONS DENIED
0
$0
2
$141,675
19
$115,606
3
$27,963
1
$22,730
2
$70,825
APPLICATIONS WITHDRAWN
0
$0
3
$154,413
8
$149,868
0
$0
0
$0
0
$0
FILES CLOSED FOR INCOMPLETENESS
0
$0
1
$108,300
6
$135,982
0
$0
0
$0
0
$0
Aggregated Statistics For Year 2003 (Based on 4 partial tracts)
A) FHA, FSA/RHS & VA Home Purchase Loans
B) Conventional Home Purchase Loans
C) Refinancings
D) Home Improvement Loans
F) Non-occupant Loans on < 5 Family Dwellings (A B C & D)
Number
Average Value
Number
Average Value
Number
Average Value
Number
Average Value
Number
Average Value
LOANS ORIGINATED
2
$112,375
20
$126,013
69
$113,932
6
$16,508
3
$60,547
APPLICATIONS APPROVED, NOT ACCEPTED
0
$0
1
$270,660
6
$116,545
1
$58,080
0
$0
APPLICATIONS DENIED
0
$0
2
$135,645
19
$121,525
3
$17,837
0
$0
APPLICATIONS WITHDRAWN
0
$0
2
$150,300
10
$126,361
0
$0
0
$0
FILES CLOSED FOR INCOMPLETENESS
0
$0
2
$140,070
5
$125,344
0
$0
0
$0
Aggregated Statistics For Year 2002 (Based on 4 partial tracts)
A) FHA, FSA/RHS & VA Home Purchase Loans
B) Conventional Home Purchase Loans
C) Refinancings
D) Home Improvement Loans
F) Non-occupant Loans on < 5 Family Dwellings (A B C & D)
Number
Average Value
Number
Average Value
Number
Average Value
Number
Average Value
Number
Average Value
LOANS ORIGINATED
1
$224,770
19
$114,245
59
$122,182
8
$29,360
1
$74,480
APPLICATIONS APPROVED, NOT ACCEPTED
0
$0
3
$112,763
8
$114,002
1
$12,250
0
$0
APPLICATIONS DENIED
0
$0
5
$83,884
19
$144,603
2
$12,515
0
$0
APPLICATIONS WITHDRAWN
0
$0
2
$153,450
14
$109,036
0
$0
0
$0
FILES CLOSED FOR INCOMPLETENESS
0
$0
1
$39,720
5
$119,938
0
$0
0
$0
Aggregated Statistics For Year 2001 (Based on 4 partial tracts)
A) FHA, FSA/RHS & VA Home Purchase Loans
B) Conventional Home Purchase Loans
C) Refinancings
D) Home Improvement Loans
F) Non-occupant Loans on < 5 Family Dwellings (A B C & D)
Number
Average Value
Number
Average Value
Number
Average Value
Number
Average Value
Number
Average Value
LOANS ORIGINATED
2
$124,770
13
$112,001
52
$108,126
9
$16,143
0
$0
APPLICATIONS APPROVED, NOT ACCEPTED
0
$0
2
$124,855
6
$104,140
1
$14,200
1
$29,470
APPLICATIONS DENIED
0
$0
3
$79,340
14
$85,254
3
$16,347
0
$0
APPLICATIONS WITHDRAWN
0
$0
1
$74,900
10
$97,603
2
$61,300
0
$0
FILES CLOSED FOR INCOMPLETENESS
0
$0
0
$0
3
$128,733
0
$0
0
$0
Aggregated Statistics For Year 2000 (Based on 4 partial tracts)
A) FHA, FSA/RHS & VA Home Purchase Loans
B) Conventional Home Purchase Loans
C) Refinancings
D) Home Improvement Loans
F) Non-occupant Loans on < 5 Family Dwellings (A B C & D)
Number
Average Value
Number
Average Value
Number
Average Value
Number
Average Value
Number
Average Value
LOANS ORIGINATED
2
$85,705
15
$101,359
16
$82,118
7
$25,391
0
$0
APPLICATIONS APPROVED, NOT ACCEPTED
0
$0
3
$76,470
6
$82,408
1
$37,220
0
$0
APPLICATIONS DENIED
0
$0
10
$58,618
11
$85,434
3
$26,623
1
$40,020
APPLICATIONS WITHDRAWN
0
$0
3
$128,820
9
$91,316
1
$28,800
0
$0
FILES CLOSED FOR INCOMPLETENESS
0
$0
0
$0
3
$81,913
0
$0
0
$0
Aggregated Statistics For Year 1999 (Based on 2 partial tracts)


 Nearest zip codes: 50166, 50047, 50118, 50125, 50225, 50252.