Estimated zip code population in 2022: 2,023 Zip code population in 2010: 1,582 Zip code population in 2000: 1,529
Houses and condos: 757 Renter-occupied apartments: 44
% of renters here:
6%
State:
28%
March 2022 cost of living index in zip code 50166: 82.9 (low, U.S. average is 100)
Land area: 62.6 sq. mi. Water area: 0.1 sq. mi.
Population density: 32 people per square mile
(very low).
OSM Map
General Map
Google Map
MSN Map
OSM Map
General Map
Google Map
MSN Map
OSM Map
General Map
Google Map
MSN Map
OSM Map
General Map
Google Map
MSN Map
Please wait while loading the map...
Real estate property taxes paid for housing units in 2022:
This zip code:
1.0% ($2,242)
Iowa:
1.4% ($2,724)
Median real estate property taxes paid for housing units with mortgages in 2022: $2,098 (0.9%) Median real estate property taxes paid for housing units with no mortgage in 2022: $2,595 (1.3%)
Business Search- 14 Million verified businesses
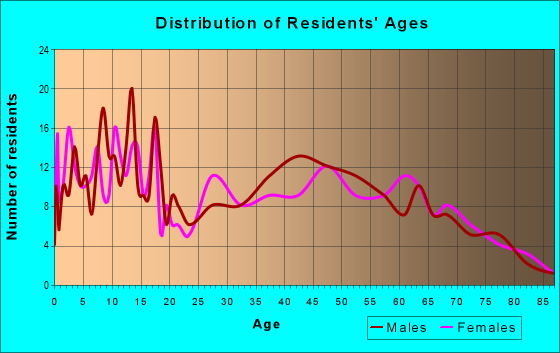
Males: 1,025
(50.7%)
Females: 997
(49.3%)
For population 25 years and over in 50166:
High school or higher: 95.1%
Bachelor's degree or higher: 18.7%
Graduate or professional degree: 4.7%
Unemployed: 1.0%
Mean travel time to work (commute): 36.2 minutes
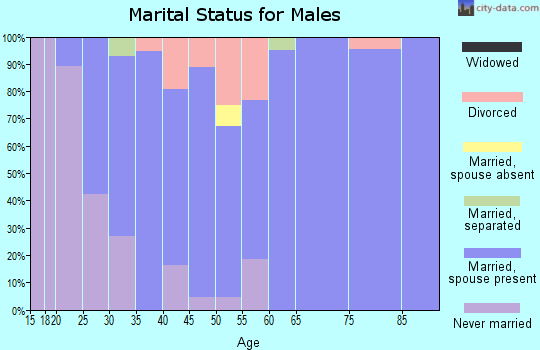
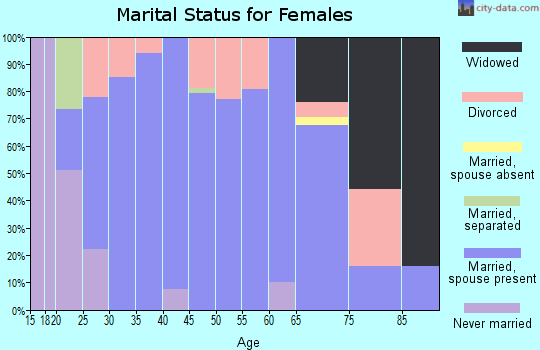
For population 15 years and over in 50166:
Never married: 28.7%
Now married: 62.3%
Separated: 0.2%
Widowed: 2.0%
Divorced: 6.9%
Zip code 50166 compared to state average:
Unemployed percentage significantly below state average.
Black race population percentage significantly below state average.
Median age above state average.
Renting percentage significantly below state average.
Length of stay since moving in significantly below state average.
Number of college students above state average.
Percentage of population with a bachelor's degree or higher below state average.
Estimated median house/condo value in 2022: $215,389
50166:
$215,389
Iowa:
$194,600
According to our research of Iowa and other state lists, there were 2 registered sex offenders living in 50166 zip code as of April 25, 2024. The ratio of all residents to sex offenders in zip code 50166 is 827 to 1. The ratio of registered sex offenders to all residents in this zip code is lower than the state average.
Median resident age:
This zip code:
43.3 years
Iowa median age:
38.9 years
Average household size:
This zip code:
2.7 people
Iowa:
2.3 people
Averages for the 2020 tax year for zip code 50166, filed in 2021:
Average Adjusted Gross Income (AGI) in 2020: $66,658 (Individual Income Tax Returns)
Here:
$66,658
State:
$71,087
Salary/wage: $63,953 (reported on 84.1% of returns)
Here:
$63,953
State:
$57,361
(% of AGI for various income ranges: 1200.8% for AGIs below $25k, 3494.6% for AGIs $25k-50k, 6590.0% for AGIs $50k-75k, 9481.4% for AGIs $75k-100k, 17882.0% for AGIs $100k-200k)
Taxable interest for individuals: $528 (reported on 36.2% of returns)
This zip code:
$528
Iowa:
$1,633
(% of AGI for various income ranges: 15.0% for AGIs below $25k, 42.3% for AGIs $25k-50k, 25.0% for AGIs $50k-75k, 14.3% for AGIs $75k-100k, 24.0% for AGIs $100k-200k)
Ordinary dividends: $1,392 (reported on 17.4% of returns)
Here:
$1,392
State:
$5,432
(% of AGI for various income ranges: 25.8% for AGIs below $25k, 79.0% for AGIs $50k-75k, 57.0% for AGIs $100k-200k)
Net capital gain/loss in AGI: +$2,750 (reported on 14.5% of returns)
Here:
+$2,750
State:
+$15,243
(% of AGI for various income ranges: 36.9% for AGIs $25k-50k, 128.0% for AGIs $50k-75k, 99.0% for AGIs $100k-200k)
Profit/loss from business: +$11,345 (reported on 15.9% of returns)
Here:
+$11,345
State:
+$11,763
(% of AGI for various income ranges: 237.5% for AGIs below $25k, 304.0% for AGIs $50k-75k, 659.0% for AGIs $100k-200k)
Taxable individual retirement arrangement distribution: $8,600 (reported on 8.7% of returns)
50166:
$8,600
Iowa:
$17,324
(% of AGI for various income ranges: 223.1% for AGIs $25k-50k, 322.9% for AGIs $75k-100k)
Earned income credit: $2,283 (reported on 8.7% of returns)
Here:
$2,283
State:
$2,195
(% of AGI for various income ranges: 67.5% for AGIs below $25k, 43.1% for AGIs $25k-50k)
Percentage of individuals using paid preparers for their 2020 taxes: 100.0%
Here:
100%
State:
95%
(% for various income ranges: 100.0% for AGIs below $25k, 100.0% for AGIs $25k-50k, 100.0% for AGIs $50k-75k, 100.0% for AGIs $75k-100k, 100.0% for AGIs $100k-200k)
Averages for the 2012 tax year for zip code 50166, filed in 2013:
Average Adjusted Gross Income (AGI) in 2012: $52,736 (Individual Income Tax Returns)
Here:
$52,736
State:
$58,860
Salary/wage: $46,532 (reported on 89.4% of returns)
Here:
$46,532
State:
$46,659
(% of AGI for various income ranges: 70.0% for AGIs below $25k, 84.3% for AGIs $25k-50k, 82.9% for AGIs $50k-75k, 89.5% for AGIs $75k-100k, 67.9% for AGIs $100k-200k)
Taxable interest for individuals: $576 (reported on 31.8% of returns)
This zip code:
$576
Iowa:
$1,537
(% of AGI for various income ranges: 1.3% for AGIs below $25k, 0.8% for AGIs $25k-50k, 0.1% for AGIs $50k-75k, 0.3% for AGIs $75k-100k)
Ordinary dividends: $1,162 (reported on 19.7% of returns)
Here:
$1,162
State:
$4,542
(% of AGI for various income ranges: 2.1% for AGIs below $25k, 0.2% for AGIs $25k-50k, 0.7% for AGIs $50k-75k, 0.3% for AGIs $100k-200k)
Net capital gain/loss in AGI: +$3,975 (reported on 12.1% of returns)
Here:
+$3,975
State:
+$11,802
(% of AGI for various income ranges: 0.2% for AGIs $25k-50k, 3.9% for AGIs $75k-100k)
Profit/loss from business: +$8,667 (reported on 18.2% of returns)
Here:
+$8,667
State:
+$10,509
(% of AGI for various income ranges: 12.1% for AGIs below $25k, 4.1% for AGIs $25k-50k, 1.6% for AGIs $50k-75k, 4.4% for AGIs $75k-100k)
Taxable individual retirement arrangement distribution: $9,657 (reported on 10.6% of returns)
50166:
$9,657
Iowa:
$11,773
Total itemized deductions: $19,224 (22% of AGI, reported on 31.8% of returns)
Here:
$19,224
State:
$21,278
Here:
22.2% of AGI
State:
18.9% of AGI
(% of AGI for various income ranges: 9.3% for AGIs below $25k, 7.2% for AGIs $25k-50k, 9.8% for AGIs $50k-75k, 10.1% for AGIs $75k-100k, 16.8% for AGIs $100k-200k)
Charity contributions: $2,119 (reported on 24.2% of returns)
Here:
$2,119
State:
$4,044
(% of AGI for various income ranges: 1.4% for AGIs $25k-50k, 1.0% for AGIs $50k-75k, 0.7% for AGIs $75k-100k, 1.2% for AGIs $100k-200k)
Taxes paid: $6,814 (reported on 31.8% of returns)
50166:
$6,814
State:
$8,846
(% of AGI for various income ranges: 2.0% for AGIs below $25k, 2.1% for AGIs $25k-50k, 3.0% for AGIs $50k-75k, 4.5% for AGIs $75k-100k, 6.2% for AGIs $100k-200k)
Earned income credit: $1,780 (reported on 15.2% of returns)
Here:
$1,780
State:
$2,098
(% of AGI for various income ranges: 3.6% for AGIs below $25k, 1.3% for AGIs $25k-50k)
Percentage of individuals using paid preparers for their 2012 taxes: 72.7%
Here:
73%
State:
65%
(% for various income ranges: 68.2% for AGIs below $25k, 70.6% for AGIs $25k-50k, 72.7% for AGIs $50k-75k, 77.8% for AGIs $75k-100k, 85.7% for AGIs $100k-200k)
Averages for the 2004 tax year for zip code 50166, filed in 2005:
Average Adjusted Gross Income (AGI) in 2004: $42,392 (Individual Income Tax Returns)
Here:
$42,392
State:
$43,875
Salary/wage: $40,411 (reported on 85.8% of returns)
Here:
$40,411
State:
$38,265
(% of AGI for various income ranges: 81.0% for AGIs below $10k, 66.7% for AGIs $10k-25k, 80.5% for AGIs $25k-50k, 93.7% for AGIs $50k-75k, 86.3% for AGIs $75k-100k, 54.0% for AGIs over 100k)
Taxable interest for individuals: $804 (reported on 46.9% of returns)
This zip code:
$804
Iowa:
$1,768
(% of AGI for various income ranges: 6.4% for AGIs below $10k, 2.6% for AGIs $10k-25k, 1.3% for AGIs $25k-50k, 0.1% for AGIs $50k-75k, 0.5% for AGIs $75k-100k, 0.8% for AGIs over 100k)
Taxable dividends: $1,465 (reported on 23.7% of returns)
Here:
$1,465
State:
$2,510
(% of AGI for various income ranges: 1.4% for AGIs below $10k, 1.2% for AGIs $10k-25k, 1.0% for AGIs $25k-50k, 0.2% for AGIs $50k-75k, 0.2% for AGIs $75k-100k, 2.7% for AGIs over 100k)
Net capital gain/loss: +$5,083 (reported on 19.9% of returns)
Here:
+$5,083
State:
+$6,139
(% of AGI for various income ranges: 2.9% for AGIs below $10k, 1.5% for AGIs $10k-25k, 0.9% for AGIs $25k-50k, 1.8% for AGIs $50k-75k, 0.5% for AGIs $75k-100k, 10.4% for AGIs over 100k)
Profit/loss from business: +$5,398 (reported on 19.3% of returns)
Here:
+$5,398
State:
+$8,574
(% of AGI for various income ranges: 17.0% for AGIs below $10k, 8.2% for AGIs $10k-25k, 4.3% for AGIs $25k-50k, 0.7% for AGIs $50k-75k, 1.3% for AGIs $75k-100k)
IRA payment deduction: $3,087 (reported on 3.5% of returns)
50166:
$3,087
Iowa:
$2,970
Total itemized deductions: $14,896 (23% of AGI, reported on 33.3% of returns)
Here:
$14,896
State:
$16,976
Here:
22.9% of AGI
State:
20.8% of AGI
(% of AGI for various income ranges: 11.3% for AGIs $10k-25k, 10.5% for AGIs $25k-50k, 10.9% for AGIs $50k-75k, 15.2% for AGIs $75k-100k, 12.5% for AGIs over 100k)
Charity contributions deductions: $1,874 (3% of AGI, reported on 26.2% of returns)
Here:
$1,874
State:
$3,089
Here:
2.8% of AGI
State:
3.6% of AGI
(% of AGI for various income ranges: 3.9% for AGIs below $10k, 0.7% for AGIs $25k-50k, 1.3% for AGIs $50k-75k, 1.0% for AGIs $75k-100k, 2.2% for AGIs over 100k)
Total tax: $4,271 (reported on 79.0% of returns)
50166:
$4,271
State:
$6,177
(% of AGI for various income ranges: 3.3% for AGIs below $10k, 3.9% for AGIs $10k-25k, 5.9% for AGIs $25k-50k, 6.9% for AGIs $50k-75k, 9.1% for AGIs $75k-100k, 16.3% for AGIs over 100k)
Earned income credit: $1,486 (reported on 10.6% of returns)
Here:
$1,486
State:
$1,540
Percentage of individuals using paid preparers for their 2004 taxes: 77.7%
Here:
78%
State:
70%
(% for various income ranges: 59.3% for AGIs below $10k, 74.2% for AGIs $10k-25k, 87.2% for AGIs $25k-50k, 79.7% for AGIs $50k-75k, 77.6% for AGIs $75k-100k, 95.7% for AGIs over 100k)
Household received Food Stamps/SNAP in the past 12 months: 27 Household did not receive Food Stamps/SNAP in the past 12 months: 731
Women who had a birth in the past 12 months: 18 (18 now married, 0 unmarried) Women who did not have a birth in the past 12 months: 569 (236 now married, 333 unmarried)
Housing units in zip code 50166 with a mortgage: 460 (49 second mortgage, 2 home equity loan, 40 both second mortgage and home equity loan) Houses without a mortgage: 3
Median monthly owner costs for units with a mortgage: $1,435 Median monthly owner costs for units without a mortgage: $645
Residents with income below the poverty level in 2022:
This zip code:
4.6%
Whole state:
11.0%
Residents with income below 50% of the poverty level in 2022:
This zip code:
0.3%
Whole state:
5.5%
Median number of rooms in houses and condos:
Here:
6.7
State:
6.8
Median number of rooms in apartments:
Here:
5.7
State:
4.2
Notable locations in this zip code not listed on our city pages
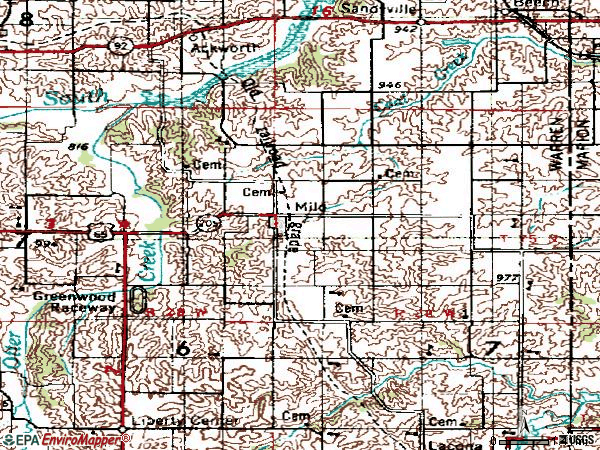
Notable locations in zip code 50166: Rosemount (A), Schonberg (B), Prairie View Preserve and Butterfly Garden (C), Motor (D), Milo Fire and Emergency Medical Services (E), Milo Public Library (F), Milo City Hall (G). Display/hide their locations on the map
Churches in zip code 50166 include: Green Plain Church (A), Saint Marys Church (B), Motor Church (C), Saint Augustine Catholic Church (D), Milo United Methodist Church (E), Christian Union Church (F). Display/hide their locations on the map
Cemeteries: Belmont Cemetery (1), Goodes Chapel Cemetery (2), Rosemount Cemetery (3), Highland Cemetery (4), Liberty Center Cemetery (5), Motor Cemetery (6), Highland Cemetery (7). Display/hide their locations on the map
Size of family households: 283 2-persons, 116 3-persons, 111 4-persons, 38 5-persons, 3 6-persons, 38 7-or-more-persons
Size of nonfamily households: 144 1-person, 17 2-persons
286 married couples with children.
40 single-parent households (36 men, 4 women).
91.8% of residents of 50166 zip code speak English at home.
7.1% of residents speak Spanish at home (44% very well, 19% well, 19% not well, 18% not at all).
Foreign born population: 83 (4.2%) (31.1% of them are naturalized citizens)
This zip code:
4.2%
Whole state:
6.0%
72%El Salvador
30%Honduras
25%German
11%American
9%Norwegian
9%Irish
8%Dutch
7%English
5%Italian
Year of entry for the foreign-born population
362010 or later
02000 to 2009
471990 to 1999
0Before 1990
Facilities with environmental interests located in this zip code:
COUNTRY PROPANE (1913 S23 HIGHWAY in MILO, IA)
AIR MINOR (AIRS/AFS) Business SIC classification: PLUMBING, HEATING AND AIR-CONDITIONING Alternative names: COUNTRY PROPANE HEATING & COOLING
OHNEMUS CYCLE & AUTO (1933 S 23 HWY in MILO, IA)
Conditionally Exempt Small Quantity Generators, less than 100 kg/month of hazardous waste (Resource Conservation and Recovery Act (tracking hazardous waste)) Business NAICS classification: GENERAL AUTOMOTIVE REPAIR.
Housing units lacking complete plumbing facilities: 0.2% Housing units lacking complete kitchen facilities: 1.1%
51.4%Bottled, tank, or LP gas
37.6%Utility gas
9.9%Electricity
1.1%Fuel oil, kerosene, etc.
Population in 1990: 1,705.
Place of birth for U.S.-born residents:
This state: 1,705
Northeast: 14
Midwest: 100
South: 63
West: 60
66% of the 50166 zip code residents lived in the same house 5 years ago. Out of people who lived in different houses, 63% lived in this county. Out of people who lived in different counties, 50% lived in Iowa.
95% of the 50166 zip code residents lived in the same house 1 year ago. Out of people who lived in different houses, 5% moved from this county. Out of people who lived in different houses, 54% moved from different county within same state. Out of people who lived in different houses, 2% moved from different state. Out of people who lived in different houses, 49% moved from abroad.
Private vs. public school enrollment:
Students in private schools in grades 1 to 8 (elementary and middle school): 13
Here:
9.3%
Iowa:
10.6%
Students in private schools in grades 9 to 12 (high school): 19
Here:
21.2%
Iowa:
7.9%
Students in private undergraduate colleges: 237
Here:
83.0%
Iowa:
23.9%
Occupation by median earnings in the past 12 months ($)
129,913Transportation occupations
103,769Management occupations
63,697Construction and extraction occupations
63,384Installation, maintenance, and repair occupations
54,636Community and social service occupations
52,549Health diagnosing and treating practitioners and other technical occupations
Top industries in this zip code by the number of employees in 2005:
Other Services (except Public Administration): Religious Organizations (1-4 employees: 4 establishments)
Wholesale Trade: Farm and Garden Machinery and Equipment Merchant Wholesalers (1-4: 1)
Administrative and Support and Waste Management and Remediation Services: Exterminating and Pest Control Services (1-4: 1)
Fatal accident statistics in 2013:
Fatal accident count: 1
Vehicles involved in fatal accidents: 1
Fatal accidents caused by drunken drivers: 0
Fatalities: 1
Persons involved in fatal accidents: 2
Pedestrians involved in fatal accidents: 1
Fatal accident statistics in 2010:
Fatal accident count: 1
Vehicles involved in fatal accidents: 2
Fatal accidents caused by drunken drivers: 0
Fatalities: 1
Persons involved in fatal accidents: 2
Pedestrians involved in fatal accidents: 0
Home Mortgage Disclosure Act Aggregated Statistics For Year 2009 (Based on 2 partial tracts)
A) FHA, FSA/RHS & VA Home Purchase Loans
B) Conventional Home Purchase Loans
C) Refinancings
D) Home Improvement Loans
F) Non-occupant Loans on < 5 Family Dwellings (A B C & D)
G) Loans On Manufactured Home Dwelling (A B C & D)
Number
Average Value
Number
Average Value
Number
Average Value
Number
Average Value
Number
Average Value
Number
Average Value
LOANS ORIGINATED
7
$111,141
13
$152,310
89
$165,149
13
$41,205
4
$81,448
6
$105,577
APPLICATIONS APPROVED, NOT ACCEPTED
0
$0
1
$158,360
11
$168,251
2
$23,375
0
$0
1
$136,900
APPLICATIONS DENIED
2
$182,215
2
$82,520
31
$174,767
3
$31,323
0
$0
1
$176,490
APPLICATIONS WITHDRAWN
2
$113,290
0
$0
18
$161,464
0
$0
0
$0
0
$0
FILES CLOSED FOR INCOMPLETENESS
0
$0
0
$0
3
$152,800
0
$0
0
$0
0
$0
Aggregated Statistics For Year 2008 (Based on 2 partial tracts)
A) FHA, FSA/RHS & VA Home Purchase Loans
B) Conventional Home Purchase Loans
C) Refinancings
D) Home Improvement Loans
F) Non-occupant Loans on < 5 Family Dwellings (A B C & D)
G) Loans On Manufactured Home Dwelling (A B C & D)
Number
Average Value
Number
Average Value
Number
Average Value
Number
Average Value
Number
Average Value
Number
Average Value
LOANS ORIGINATED
8
$126,941
18
$156,536
46
$149,540
11
$53,597
6
$97,705
4
$92,180
APPLICATIONS APPROVED, NOT ACCEPTED
1
$218,470
0
$0
9
$131,546
1
$91,110
0
$0
1
$217,990
APPLICATIONS DENIED
1
$92,060
3
$83,953
49
$137,775
9
$39,326
1
$95,880
2
$143,340
APPLICATIONS WITHDRAWN
0
$0
3
$135,150
14
$145,758
1
$42,930
1
$44,840
0
$0
FILES CLOSED FOR INCOMPLETENESS
0
$0
1
$108,760
1
$260,440
1
$46,750
0
$0
0
$0
Aggregated Statistics For Year 2007 (Based on 2 partial tracts)
A) FHA, FSA/RHS & VA Home Purchase Loans
B) Conventional Home Purchase Loans
C) Refinancings
D) Home Improvement Loans
F) Non-occupant Loans on < 5 Family Dwellings (A B C & D)
G) Loans On Manufactured Home Dwelling (A B C & D)
Number
Average Value
Number
Average Value
Number
Average Value
Number
Average Value
Number
Average Value
Number
Average Value
LOANS ORIGINATED
2
$115,435
49
$144,560
53
$148,563
15
$41,340
6
$207,972
5
$98,930
APPLICATIONS APPROVED, NOT ACCEPTED
0
$0
3
$92,537
7
$100,239
0
$0
0
$0
1
$56,290
APPLICATIONS DENIED
0
$0
7
$101,806
47
$108,249
13
$47,847
1
$148,820
4
$100,648
APPLICATIONS WITHDRAWN
0
$0
2
$109,235
15
$120,777
1
$82,040
0
$0
0
$0
FILES CLOSED FOR INCOMPLETENESS
0
$0
2
$123,545
7
$118,433
0
$0
0
$0
0
$0
Aggregated Statistics For Year 2006 (Based on 2 partial tracts)
A) FHA, FSA/RHS & VA Home Purchase Loans
B) Conventional Home Purchase Loans
C) Refinancings
D) Home Improvement Loans
F) Non-occupant Loans on < 5 Family Dwellings (A B C & D)
G) Loans On Manufactured Home Dwelling (A B C & D)
Number
Average Value
Number
Average Value
Number
Average Value
Number
Average Value
Number
Average Value
Number
Average Value
LOANS ORIGINATED
1
$117,340
39
$115,997
62
$105,663
17
$18,744
3
$77,593
7
$77,410
APPLICATIONS APPROVED, NOT ACCEPTED
0
$0
6
$123,067
17
$127,135
2
$20,990
0
$0
1
$172,670
APPLICATIONS DENIED
0
$0
9
$121,900
41
$99,065
7
$30,460
1
$107,330
5
$74,984
APPLICATIONS WITHDRAWN
0
$0
3
$106,690
21
$96,059
1
$76,800
0
$0
1
$30,050
FILES CLOSED FOR INCOMPLETENESS
0
$0
0
$0
9
$90,789
1
$23,370
0
$0
0
$0
Aggregated Statistics For Year 2005 (Based on 2 partial tracts)
A) FHA, FSA/RHS & VA Home Purchase Loans
B) Conventional Home Purchase Loans
C) Refinancings
D) Home Improvement Loans
F) Non-occupant Loans on < 5 Family Dwellings (A B C & D)
G) Loans On Manufactured Home Dwelling (A B C & D)
Number
Average Value
Number
Average Value
Number
Average Value
Number
Average Value
Number
Average Value
Number
Average Value
LOANS ORIGINATED
4
$133,798
43
$116,987
73
$120,295
12
$28,779
4
$52,708
6
$105,258
APPLICATIONS APPROVED, NOT ACCEPTED
0
$0
7
$116,660
14
$118,773
0
$0
0
$0
1
$84,430
APPLICATIONS DENIED
1
$106,850
10
$97,833
46
$114,553
14
$50,699
0
$0
3
$63,600
APPLICATIONS WITHDRAWN
0
$0
11
$118,383
26
$108,940
1
$81,090
0
$0
1
$103,990
FILES CLOSED FOR INCOMPLETENESS
0
$0
0
$0
9
$121,529
0
$0
0
$0
0
$0
Aggregated Statistics For Year 2004 (Based on 2 partial tracts)
A) FHA, FSA/RHS & VA Home Purchase Loans
B) Conventional Home Purchase Loans
C) Refinancings
D) Home Improvement Loans
F) Non-occupant Loans on < 5 Family Dwellings (A B C & D)
G) Loans On Manufactured Home Dwelling (A B C & D)
Number
Average Value
Number
Average Value
Number
Average Value
Number
Average Value
Number
Average Value
Number
Average Value
LOANS ORIGINATED
1
$198,430
29
$118,362
53
$107,136
11
$25,758
2
$78,945
3
$63,440
APPLICATIONS APPROVED, NOT ACCEPTED
0
$0
10
$135,420
9
$129,797
0
$0
0
$0
0
$0
APPLICATIONS DENIED
1
$105,420
13
$95,473
26
$97,308
3
$26,870
0
$0
1
$56,760
APPLICATIONS WITHDRAWN
1
$166,470
8
$73,816
21
$129,517
2
$42,455
0
$0
0
$0
FILES CLOSED FOR INCOMPLETENESS
0
$0
3
$120,680
7
$120,817
0
$0
0
$0
0
$0
Aggregated Statistics For Year 2003 (Based on 2 partial tracts)
A) FHA, FSA/RHS & VA Home Purchase Loans
B) Conventional Home Purchase Loans
C) Refinancings
D) Home Improvement Loans
F) Non-occupant Loans on < 5 Family Dwellings (A B C & D)
Number
Average Value
Number
Average Value
Number
Average Value
Number
Average Value
Number
Average Value
LOANS ORIGINATED
3
$140,237
29
$118,066
123
$110,691
12
$17,689
2
$84,670
APPLICATIONS APPROVED, NOT ACCEPTED
0
$0
4
$116,150
15
$101,251
1
$59,150
0
$0
APPLICATIONS DENIED
0
$0
4
$109,472
39
$110,297
7
$31,277
0
$0
APPLICATIONS WITHDRAWN
0
$0
4
$82,880
21
$87,450
0
$0
0
$0
FILES CLOSED FOR INCOMPLETENESS
0
$0
6
$85,860
10
$120,395
0
$0
0
$0
Aggregated Statistics For Year 2002 (Based on 2 partial tracts)
A) FHA, FSA/RHS & VA Home Purchase Loans
B) Conventional Home Purchase Loans
C) Refinancings
D) Home Improvement Loans
F) Non-occupant Loans on < 5 Family Dwellings (A B C & D)
Number
Average Value
Number
Average Value
Number
Average Value
Number
Average Value
Number
Average Value
LOANS ORIGINATED
3
$106,053
43
$112,639
99
$110,356
15
$18,317
4
$75,842
APPLICATIONS APPROVED, NOT ACCEPTED
0
$0
6
$91,187
17
$105,726
1
$48,180
0
$0
APPLICATIONS DENIED
0
$0
11
$95,834
28
$119,676
7
$22,829
0
$0
APPLICATIONS WITHDRAWN
0
$0
3
$98,580
23
$103,447
1
$58,670
0
$0
FILES CLOSED FOR INCOMPLETENESS
0
$0
6
$75,923
10
$130,460
1
$71,550
0
$0
Aggregated Statistics For Year 2001 (Based on 2 partial tracts)
A) FHA, FSA/RHS & VA Home Purchase Loans
B) Conventional Home Purchase Loans
C) Refinancings
D) Home Improvement Loans
F) Non-occupant Loans on < 5 Family Dwellings (A B C & D)
Number
Average Value
Number
Average Value
Number
Average Value
Number
Average Value
Number
Average Value
LOANS ORIGINATED
3
$93,650
30
$94,653
67
$90,096
10
$16,552
3
$72,347
APPLICATIONS APPROVED, NOT ACCEPTED
0
$0
3
$105,417
7
$76,320
0
$0
0
$0
APPLICATIONS DENIED
0
$0
8
$67,258
31
$73,689
4
$16,932
0
$0
APPLICATIONS WITHDRAWN
1
$88,250
5
$94,636
15
$96,386
0
$0
0
$0
FILES CLOSED FOR INCOMPLETENESS
0
$0
1
$112,570
4
$120,920
0
$0
0
$0
Aggregated Statistics For Year 2000 (Based on 2 partial tracts)
A) FHA, FSA/RHS & VA Home Purchase Loans
B) Conventional Home Purchase Loans
C) Refinancings
D) Home Improvement Loans
Number
Average Value
Number
Average Value
Number
Average Value
Number
Average Value
LOANS ORIGINATED
5
$92,348
23
$103,385
24
$80,653
12
$20,948
APPLICATIONS APPROVED, NOT ACCEPTED
0
$0
2
$147,395
6
$72,822
5
$22,896
APPLICATIONS DENIED
0
$0
9
$48,496
13
$73,568
8
$9,242
APPLICATIONS WITHDRAWN
0
$0
3
$87,927
10
$60,865
0
$0
FILES CLOSED FOR INCOMPLETENESS
0
$0
0
$0
5
$77,656
0
$0
Aggregated Statistics For Year 1999 (Based on 1 partial tract)
A) FHA, FSA/RHS & VA Home Purchase Loans
B) Conventional Home Purchase Loans
C) Refinancings
D) Home Improvement Loans
F) Non-occupant Loans on < 5 Family Dwellings (A B C & D)
Detailed PMIC statistics for the following Tracts:0211.00
2002 - 2018 National Fire Incident Reporting System (NFIRS) incidents
Based on the data from the years 2002 - 2018 the average number of fires per year is 7. The highest number of fire incidents - 37 took place in 2003, and the least - 0 in 2006. The data has a dropping trend.
When looking into fire subcategories, the most incidents belonged to: Outside Fires (52.8%), and Structure Fires (36.8%).
Fire incident types reported to NFIRS in Zip Code 50166


 Nearest zip codes: 50001, 50139, 50125, 50047, 50225, 50118.


 Based on the data from the years 2002 - 2018 the average number of fires per year is 7. The highest number of fire incidents - 37 took place in 2003, and the least - 0 in 2006. The data has a dropping trend.
 When looking into fire subcategories, the most incidents belonged to: Outside Fires (52.8%), and Structure Fires (36.8%).