Estimated zip code population in 2022: 37,942 Zip code population in 2010: 32,788 Zip code population in 2000: 19,827
Houses and condos: 14,332 Renter-occupied apartments: 1,843
% of renters here:
13%
State:
28%
March 2022 cost of living index in zip code 55311: 115.0 (more than average, U.S. average is 100)
Land area: 16.4 sq. mi. Water area: 0.9 sq. mi.
Population density: 2,313 people per square mile
(low).
OSM Map
General Map
Google Map
MSN Map
OSM Map
General Map
Google Map
MSN Map
OSM Map
General Map
Google Map
MSN Map
OSM Map
General Map
Google Map
MSN Map
Please wait while loading the map...
Real estate property taxes paid for housing units in 2022:
This zip code:
1.1% ($5,052)
Minnesota:
1.0% ($3,087)
Median real estate property taxes paid for housing units with mortgages in 2022: $5,067 (1.0%) Median real estate property taxes paid for housing units with no mortgage in 2022: $4,984 (1.1%)
Estimated median house/condo value in 2022: $479,908
55311:
$479,908
Minnesota:
$314,600
Median resident age:
This zip code:
41.7 years
Minnesota median age:
39.0 years
Average household size:
This zip code:
2.7 people
Minnesota:
2.4 people
Averages for the 2020 tax year for zip code 55311, filed in 2021:
Average Adjusted Gross Income (AGI) in 2020: $135,448 (Individual Income Tax Returns)
Here:
$135,448
State:
$82,178
Salary/wage: $115,970 (reported on 85.9% of returns)
Here:
$115,970
State:
$67,438
(% of AGI for various income ranges: 1072.3% for AGIs below $25k, 3700.9% for AGIs $25k-50k, 6700.9% for AGIs $50k-75k, 9277.3% for AGIs $75k-100k, 20252.4% for AGIs $100k-200k, 92177.0% for AGIs over 200k)
Taxable interest for individuals: $1,756 (reported on 44.0% of returns)
This zip code:
$1,756
Minnesota:
$1,814
(% of AGI for various income ranges: 16.6% for AGIs below $25k, 36.5% for AGIs $25k-50k, 43.9% for AGIs $50k-75k, 65.5% for AGIs $75k-100k, 105.5% for AGIs $100k-200k, 817.4% for AGIs over 200k)
Ordinary dividends: $5,579 (reported on 39.0% of returns)
Here:
$5,579
State:
$6,928
(% of AGI for various income ranges: 40.4% for AGIs below $25k, 87.0% for AGIs $25k-50k, 141.5% for AGIs $50k-75k, 147.7% for AGIs $75k-100k, 342.9% for AGIs $100k-200k, 2254.2% for AGIs over 200k)
Net capital gain/loss in AGI: +$21,085 (reported on 35.3% of returns)
Here:
+$21,085
State:
+$20,591
(% of AGI for various income ranges: 26.8% for AGIs below $25k, 70.0% for AGIs $25k-50k, 120.6% for AGIs $50k-75k, 204.0% for AGIs $75k-100k, 605.5% for AGIs $100k-200k, 10441.9% for AGIs over 200k)
Profit/loss from business: +$19,720 (reported on 15.6% of returns)
Here:
+$19,720
State:
+$14,342
(% of AGI for various income ranges: 78.9% for AGIs below $25k, 169.2% for AGIs $25k-50k, 216.9% for AGIs $50k-75k, 344.7% for AGIs $75k-100k, 540.1% for AGIs $100k-200k, 2750.8% for AGIs over 200k)
Taxable individual retirement arrangement distribution: $25,433 (reported on 12.0% of returns)
55311:
$25,433
Minnesota:
$20,675
(% of AGI for various income ranges: 87.4% for AGIs below $25k, 180.4% for AGIs $25k-50k, 354.1% for AGIs $50k-75k, 545.9% for AGIs $75k-100k, 944.8% for AGIs $100k-200k, 1383.2% for AGIs over 200k)
Self-employed (Keogh) retirement plans: $24,670 (reported on 1.5% of returns)
55311:
$24,670
Minnesota:
$23,059
(% of AGI for various income ranges: 18.9% for AGIs $50k-75k, 34.9% for AGIs $100k-200k, 494.6% for AGIs over 200k)
Total itemized deductions: $31,853 (reported on 20.9% of returns)
Here:
$31,853
State:
$33,311
(% of AGI for various income ranges: 88.8% for AGIs below $25k, 218.0% for AGIs $25k-50k, 488.6% for AGIs $50k-75k, 742.9% for AGIs $75k-100k, 1358.6% for AGIs $100k-200k, 5978.9% for AGIs over 200k)
Charity contributions: $9,281 (reported on 17.8% of returns)
Here:
$9,281
State:
$11,879
(% of AGI for various income ranges: 6.2% for AGIs below $25k, 22.2% for AGIs $25k-50k, 57.7% for AGIs $50k-75k, 83.4% for AGIs $75k-100k, 263.7% for AGIs $100k-200k, 1937.3% for AGIs over 200k)
Taxes paid: $9,049 (reported on 20.9% of returns)
55311:
$9,049
State:
$8,252
(% of AGI for various income ranges: 14.2% for AGIs below $25k, 47.6% for AGIs $25k-50k, 141.5% for AGIs $50k-75k, 273.6% for AGIs $75k-100k, 464.5% for AGIs $100k-200k, 1493.2% for AGIs over 200k)
Earned income credit: $1,922 (reported on 4.8% of returns)
Here:
$1,922
State:
$2,055
(% of AGI for various income ranges: 36.8% for AGIs below $25k, 40.4% for AGIs $25k-50k, 0.6% for AGIs $50k-75k)
Percentage of individuals using paid preparers for their 2020 taxes: 93.9%
Here:
94%
State:
94%
(% for various income ranges: 91.6% for AGIs below $25k, 93.6% for AGIs $25k-50k, 94.3% for AGIs $50k-75k, 94.2% for AGIs $75k-100k, 94.4% for AGIs $100k-200k, 95.8% for AGIs over 200k)
Averages for the 2012 tax year for zip code 55311, filed in 2013:
Average Adjusted Gross Income (AGI) in 2012: $110,276 (Individual Income Tax Returns)
Here:
$110,276
State:
$67,192
Salary/wage: $98,442 (reported on 90.0% of returns)
Here:
$98,442
State:
$55,182
(% of AGI for various income ranges: 79.2% for AGIs below $25k, 82.3% for AGIs $25k-50k, 79.4% for AGIs $50k-75k, 79.8% for AGIs $75k-100k, 87.3% for AGIs $100k-200k, 75.8% for AGIs over 200k)
Taxable interest for individuals: $1,258 (reported on 48.6% of returns)
This zip code:
$1,258
Minnesota:
$1,664
(% of AGI for various income ranges: 1.3% for AGIs below $25k, 0.6% for AGIs $25k-50k, 0.6% for AGIs $50k-75k, 0.6% for AGIs $75k-100k, 0.4% for AGIs $100k-200k, 0.6% for AGIs over 200k)
Ordinary dividends: $5,113 (reported on 36.7% of returns)
Here:
$5,113
State:
$5,665
(% of AGI for various income ranges: 2.4% for AGIs below $25k, 1.1% for AGIs $25k-50k, 1.0% for AGIs $50k-75k, 1.1% for AGIs $75k-100k, 1.0% for AGIs $100k-200k, 2.4% for AGIs over 200k)
Net capital gain/loss in AGI: +$10,744 (reported on 30.6% of returns)
Here:
+$10,744
State:
+$16,131
(% of AGI for various income ranges: 0.4% for AGIs below $25k, 0.3% for AGIs $25k-50k, 0.4% for AGIs $50k-75k, 0.9% for AGIs $75k-100k, 0.8% for AGIs $100k-200k, 5.6% for AGIs over 200k)
Profit/loss from business: +$17,138 (reported on 15.6% of returns)
Here:
+$17,138
State:
+$12,430
(% of AGI for various income ranges: 5.9% for AGIs below $25k, 3.8% for AGIs $25k-50k, 3.0% for AGIs $50k-75k, 3.0% for AGIs $75k-100k, 2.3% for AGIs $100k-200k, 2.0% for AGIs over 200k)
Taxable individual retirement arrangement distribution: $19,110 (reported on 10.4% of returns)
55311:
$19,110
Minnesota:
$15,212
(% of AGI for various income ranges: 4.3% for AGIs below $25k, 2.9% for AGIs $25k-50k, 3.4% for AGIs $50k-75k, 3.3% for AGIs $75k-100k, 1.9% for AGIs $100k-200k, 1.0% for AGIs over 200k)
Self-employment retirement plans: $16,480 (reported on 1.5% of returns)
55311:
$16,480
Minnesota:
$17,874
(% of AGI for various income ranges: 0.3% for AGIs below $25k, 0.2% for AGIs $75k-100k, 0.2% for AGIs $100k-200k, 0.3% for AGIs over 200k)
Total itemized deductions: $30,511 (19% of AGI, reported on 60.2% of returns)
Here:
$30,511
State:
$24,665
Here:
18.6% of AGI
State:
19.6% of AGI
(% of AGI for various income ranges: 14.5% for AGIs below $25k, 15.0% for AGIs $25k-50k, 20.0% for AGIs $50k-75k, 19.2% for AGIs $75k-100k, 18.6% for AGIs $100k-200k, 14.7% for AGIs over 200k)
Charity contributions: $3,895 (reported on 54.3% of returns)
Here:
$3,895
State:
$3,948
(% of AGI for various income ranges: 1.2% for AGIs below $25k, 1.5% for AGIs $25k-50k, 1.7% for AGIs $50k-75k, 2.1% for AGIs $75k-100k, 1.9% for AGIs $100k-200k, 2.0% for AGIs over 200k)
Taxes paid: $14,503 (reported on 60.2% of returns)
55311:
$14,503
State:
$10,589
(% of AGI for various income ranges: 3.0% for AGIs below $25k, 4.3% for AGIs $25k-50k, 6.3% for AGIs $50k-75k, 7.4% for AGIs $75k-100k, 8.6% for AGIs $100k-200k, 8.4% for AGIs over 200k)
Earned income credit: $1,961 (reported on 5.7% of returns)
Here:
$1,961
State:
$2,037
(% of AGI for various income ranges: 3.1% for AGIs below $25k, 0.6% for AGIs $25k-50k)
Percentage of individuals using paid preparers for their 2012 taxes: 50.1%
Here:
50%
State:
55%
(% for various income ranges: 39.8% for AGIs below $25k, 49.2% for AGIs $25k-50k, 51.0% for AGIs $50k-75k, 53.8% for AGIs $75k-100k, 51.7% for AGIs $100k-200k, 63.4% for AGIs over 200k)
Averages for the 2004 tax year for zip code 55311, filed in 2005:
Average Adjusted Gross Income (AGI) in 2004: $84,134 (Individual Income Tax Returns)
Here:
$84,134
State:
$53,560
Salary/wage: $76,642 (reported on 91.6% of returns)
Here:
$76,642
State:
$46,177
(% of AGI for various income ranges: 118.9% for AGIs below $10k, 79.5% for AGIs $10k-25k, 86.1% for AGIs $25k-50k, 85.9% for AGIs $50k-75k, 88.4% for AGIs $75k-100k, 81.5% for AGIs over 100k)
Taxable interest for individuals: $1,192 (reported on 55.6% of returns)
This zip code:
$1,192
Minnesota:
$1,796
(% of AGI for various income ranges: 4.7% for AGIs below $10k, 1.9% for AGIs $10k-25k, 1.1% for AGIs $25k-50k, 0.9% for AGIs $50k-75k, 0.6% for AGIs $75k-100k, 0.7% for AGIs over 100k)
Taxable dividends: $1,963 (reported on 41.1% of returns)
Here:
$1,963
State:
$3,096
(% of AGI for various income ranges: 5.1% for AGIs below $10k, 1.9% for AGIs $10k-25k, 1.0% for AGIs $25k-50k, 0.7% for AGIs $50k-75k, 0.6% for AGIs $75k-100k, 1.0% for AGIs over 100k)
Net capital gain/loss: +$7,340 (reported on 34.6% of returns)
Here:
+$7,340
State:
+$10,864
(% of AGI for various income ranges: -4.3% for AGIs below $10k, 0.4% for AGIs $10k-25k, 0.2% for AGIs $25k-50k, 0.5% for AGIs $50k-75k, 0.6% for AGIs $75k-100k, 4.4% for AGIs over 100k)
Profit/loss from business: +$15,010 (reported on 15.7% of returns)
Here:
+$15,010
State:
+$10,442
(% of AGI for various income ranges: 7.2% for AGIs below $10k, 5.9% for AGIs $10k-25k, 3.8% for AGIs $25k-50k, 3.4% for AGIs $50k-75k, 2.7% for AGIs $75k-100k, 2.5% for AGIs over 100k)
IRA payment deduction: $3,088 (reported on 2.7% of returns)
55311:
$3,088
Minnesota:
$2,955
(% of AGI for various income ranges: 0.3% for AGIs $10k-25k, 0.3% for AGIs $25k-50k, 0.2% for AGIs $50k-75k, 0.1% for AGIs $75k-100k, 0.1% for AGIs over 100k)
Self-employed pension: $12,317 (reported on 1.9% of returns)
Here:
$12,317
Minnesota:
$12,099
(% of AGI for various income ranges: 0.1% for AGIs $25k-50k, 0.2% for AGIs $50k-75k, 0.2% for AGIs $75k-100k, 0.3% for AGIs over 100k)
Total itemized deductions: $24,328 (21% of AGI, reported on 64.2% of returns)
Here:
$24,328
State:
$20,035
Here:
20.5% of AGI
State:
21.3% of AGI
(% of AGI for various income ranges: 19.7% for AGIs below $10k, 18.5% for AGIs $10k-25k, 21.2% for AGIs $25k-50k, 22.6% for AGIs $50k-75k, 21.9% for AGIs $75k-100k, 16.9% for AGIs over 100k)
Charity contributions deductions: $3,288 (3% of AGI, reported on 59.5% of returns)
Here:
$3,288
State:
$3,333
Here:
2.7% of AGI
State:
3.4% of AGI
(% of AGI for various income ranges: 0.9% for AGIs below $10k, 1.7% for AGIs $10k-25k, 2.3% for AGIs $25k-50k, 2.5% for AGIs $50k-75k, 2.4% for AGIs $75k-100k, 2.3% for AGIs over 100k)
Total tax: $14,433 (reported on 85.6% of returns)
55311:
$14,433
State:
$8,485
(% of AGI for various income ranges: 3.4% for AGIs below $10k, 5.2% for AGIs $10k-25k, 7.8% for AGIs $25k-50k, 9.2% for AGIs $50k-75k, 9.7% for AGIs $75k-100k, 17.8% for AGIs over 100k)
Earned income credit: $1,345 (reported on 3.9% of returns)
Here:
$1,345
State:
$1,523
Percentage of individuals using paid preparers for their 2004 taxes: 51.0%
Here:
51%
State:
59%
(% for various income ranges: 38.0% for AGIs below $10k, 47.0% for AGIs $10k-25k, 53.9% for AGIs $25k-50k, 54.6% for AGIs $50k-75k, 53.8% for AGIs $75k-100k, 55.1% for AGIs over 100k)
Likely homosexual households (counted as self-reported same-sex unmarried-partner households)
Lesbian couples: 0.2% of all households
Gay men: 0.1% of all households
Household received Food Stamps/SNAP in the past 12 months: 226 Household did not receive Food Stamps/SNAP in the past 12 months: 13,957
Women who had a birth in the past 12 months: 518 (446 now married, 75 unmarried) Women who did not have a birth in the past 12 months: 8,018 (4,608 now married, 3,417 unmarried)
Housing units in zip code 55311 with a mortgage: 8,623 (871 second mortgage, 640 both second mortgage and home equity loan) Houses without a mortgage: 358
Median monthly owner costs for units with a mortgage: $2,294 Median monthly owner costs for units without a mortgage: $842
Residents with income below the poverty level in 2022:
This zip code:
3.6%
Whole state:
9.6%
Residents with income below 50% of the poverty level in 2022:
This zip code:
1.6%
Whole state:
5.2%
Median number of rooms in houses and condos:
Here:
8.1
State:
7.1
Median number of rooms in apartments:
Here:
4.4
State:
3.8
Notable locations in this zip code not listed on our city pages
Notable locations in zip code 55311: Rush Creek Golf Course (A), Maple Grove Fire Department Station 5 (B), Maple Grove Fire Department Station 4 (C). Display/hide their locations on the map
Parks in zip code 55311 include: Weaver Lake Park (1), Fish Lake Regional Park (2), Weaver Lake Knolls (3), Donahue South Park (4), Donahue North Park (5), Timber Crest Forest Park (6), Fish Lake Woods Park (7). Display/hide their locations on the map
9,020 married couples with children.
967 single-parent households (241 men, 726 women).
85.3% of residents of 55311 zip code speak English at home.
0.7% of residents speak Spanish at home (84% very well, 16% well, 1% not well).
5.2% of residents speak other Indo-European language at home (67% very well, 23% well, 5% not well, 4% not at all).
5.2% of residents speak Asian or Pacific Island language at home (77% very well, 16% well, 6% not well, 1% not at all).
3.0% of residents speak other language at home (72% very well, 21% well, 7% not well).
Foreign born population: 4,920 (13.0%) (64.4% of them are naturalized citizens)
Facilities with environmental interests located in this zip code:
BOSTON SCIENTIFIC SCIMED (2 SCIMED PL. in MAPLE GROVE, MN)
STATE MASTER (Minnesota Pollution Control Agency permits and compilance tracking) - PCS-C00010459, NPDES STORMWATER PERMIT STATE MASTER (Minnesota Pollution Control Agency permits and compilance tracking) - RCRAINFO-MND985770031, SQG, RCRIS-MND985770031, LQG PERFORMANCE TRACK (National Environmental Performance Track) HAZARDOUS WASTE BIENNIAL REPORTER (Resource Conservation and Recovery Act (tracking hazardous waste)) - ICIS-, ENFORCEMENT/COMPLIANCE ACTIVITY Large Quantity Generators, more that 1000 kg of hazardous waste/month (Resource Conservation and Recovery Act (tracking hazardous waste)) - notification - ICIS-, ENFORCEMENT/COMPLIANCE ACTIVITY TRI REPORTER (Tracking of toxic chemicals releasing facilities) Business SIC classification: SURGICAL AND MEDICAL INSTRUMENTS AND APPARATUS Business NAICS classification: LABORATORY APPARATUS AND FURNITURE MANUFACTURING.; SURGICAL AND MEDICAL INSTRUMENT MANUFACTURING. Organizations: BOSTON SCIENTIFIC / SCIMED, INC (CONTACT/OPERATOR)
, BOSTON SCIENTIFIC CORPORATION, INC (CONTACT/OWNER)
, SCIMED LIFE SYSTEMS (CONTACT/OWNER)
Alternative names: BOSTON SCIENTIFIC EXPANSION, BOSTON SCIENTIFIC WEAVER LAKE CAMPUS, SCIMED LIFE SYSTEMS INC
BARTON SAND & GRAVEL COMPANY (10633 89TH AVENUE NORTH in MAPLE GROVE, MN)
AIR SYNTHETIC MINOR (AIRS/AFS) STATE MASTER (Minnesota Pollution Control Agency permits and compilance tracking) - AIRS-2705301018, AIR PROGRAM, RCRAINFO-MND041202052, SQG, AFS-2705301018, AIR SYNTHETIC MINOR, RCRIS-MND041202052, SQG CRITERIA AND HAZARDOUS AIR POLLUTANT INVENTORY (Inventory of air pollution sources) TRANSPORTER (Resource Conservation and Recovery Act (tracking hazardous waste)) - notification Business SIC classification: CRUSHED AND BROKEN LIMESTONE; CONSTRUCTION SAND AND GRAVEL Business NAICS classification: CRUSHED AND BROKEN LIMESTONE MINING AND QUARRYING.; CONSTRUCTION SAND AND GRAVEL MINING. Organizations: TILLER CORP (CONTACT/OWNER)
Alternative names: BARTON SAND& GRAVEL CO - NONMETALLIC
BARTON SAND& GRAVEL CO - REVERE LN (8280 REVERE LN in MAPLE GROVE, MN)
STATE MASTER (Minnesota Pollution Control Agency permits and compilance tracking) - RCRAINFO-MNR000106732, SQG, RCRIS-MNR000106732, Small Quantity Generators, between 100 kg and 1000 kg of hazardous waste/month (Resource Conservation and Recovery Act (tracking hazardous waste)) - notification TRANSPORTER (Resource Conservation and Recovery Act (tracking hazardous waste)) - notification Organizations: TILLER CORP (CONTACT/OWNER)
Alternative names: BARTON SAND & GRAVEL
GROVE SQUARE PET HOSPITAL (14040 81ST AVE N in MAPLE GROVE, MN)
STATE MASTER (Minnesota Pollution Control Agency permits and compilance tracking) - RCRAINFO-MN0000593566, CESQG, RCRIS-MN0000593566, Conditionally Exempt Small Quantity Generators, less than 100 kg/month of hazardous waste (Resource Conservation and Recovery Act (tracking hazardous waste)) - notification Business SIC classification: VETERINARY SERVICES FOR ANIMAL SPECIALTIES Business NAICS classification: VETERINARY SERVICES. Organizations: THOMPSON CAROLYN A (CONTACT/OWNER)
GYRUS MEDICAL (6655 WEDGWOOD RD STE 105 in MAPLE GROVE, MN)
STATE MASTER (Minnesota Pollution Control Agency permits and compilance tracking) - RCRIS-MNR000108654, CESQG Conditionally Exempt Small Quantity Generators, less than 100 kg/month of hazardous waste (Resource Conservation and Recovery Act (tracking hazardous waste)) - notification Organizations: FIRST INDUSTRIAL (CONTACT/OWNER)
, FIRST INDUSTRIAL LP (CONTACT/OWNER)
BARTON SAND AND GRAVEL (11601 85TH AVE in MAPLE GROVE, MN)
(Resource Conservation and Recovery Act (tracking hazardous waste))
Housing units lacking complete plumbing facilities: 0.5% Housing units lacking complete kitchen facilities: 0.4%
89.8%Utility gas
8.7%Electricity
1.0%Bottled, tank, or LP gas
Place of birth for U.S.-born residents:
This state: 22,077
Northeast: 1,158
Midwest: 6,181
South: 1,465
West: 1,890
51% of the 55311 zip code residents lived in the same house 5 years ago. Out of people who lived in different houses, 60% lived in this county. Out of people who lived in different counties, 50% lived in Minnesota.
91% of the 55311 zip code residents lived in the same house 1 year ago. Out of people who lived in different houses, 64% moved from this county. Out of people who lived in different houses, 19% moved from different county within same state. Out of people who lived in different houses, 9% moved from different state. Out of people who lived in different houses, 5% moved from abroad.
Private vs. public school enrollment:
Students in private schools in grades 1 to 8 (elementary and middle school): 682
Here:
14.6%
Minnesota:
12.9%
Students in private schools in grades 9 to 12 (high school): 371
Here:
11.2%
Minnesota:
8.6%
Students in private undergraduate colleges: 278
Here:
21.3%
Minnesota:
26.2%
Occupation by median earnings in the past 12 months ($)
137,064Management occupations
115,975Computer and mathematical occupations
114,584Life, physical, and social science occupations
101,856Business and financial operations occupations
96,640Legal occupations
86,265Architecture and engineering occupations
Companies with federal contracts located in this zip code:
DATA RECOGNITION CORPORATION (13490 BASS LAKE ROAD in MAPLE GROVE, MN) : $9,626,107 in 48 contractsfrom 1999 to 2005
Contracts for Market Research and Public Opinion Services (includes telephone and field interviews, focus testing, and surveys), Other ADP and Telecommunications Services (includes data storage on tapes, compact disks, etc.), Other Research and Development -- Basic Research (R&D), Program Management/Support Services, and moreby Navy, Army Signed by year:2000: $1,234,146; 2001: $451,268; 2002: $632,037; 2003: $2,931,996; 2004: $1,461,274; 2005: $2,802,666; 2006: $0.
Biggest contracts:
$846,211 with Navy for Market Research and Public Opinion Services (includes telephone and field interviews, focus testing, and surveys). Signed on 2005-06-21. Completion date: 2006-06-23.
$669,746, same as above.Signed on 2005-09-08. Completion date: 2006-09-07.
$656,330, same as above.Signed on 2005-01-12. Completion date: 2006-01-11.
$450,600 with Navy for Other ADP and Telecommunications Services (includes data storage on tapes, compact disks, etc.). Signed on 2003-10-09. Completion date: 2004-09-30.
CIMPERMAN SALES INC (8356 SHADOW CREEK DR in MAPLE GROVE, MN; small business) : $134,026 in 3 contractsin 2005
$84,306 with Army for Miscellaneous Electric Power and Distribution Equipment. Taking place in SD. Signed on 2005-12-06. Completion date: 2006-02-10.
$24,860, same as above.Signed on 2005-08-18. Completion date: 2005-09-23.
$24,860 with U.S. Army Corps of Engineers - civil program financing only for Miscellaneous Electric Power and Distribution Equipment. Taking place in SD. Signed on 2005-08-18. Completion date: 2005-09-23.
ROBERT J DEXTER (9164 TEWSBURY GATE in OSSEO, MN; small business) : $99,964 in 5 contractsfrom 2002 to 2004
Contracts for Other Research and Development -- Applied Research and Exploratory Development (R&D) by Army, U.S. Army Corps of Engineers - civil program financing only Signed by year:2000: $0; 2001: $0; 2002: $1,000; 2003: $8,964; 2004: $90,000; 2005: $0; 2006: $0.
Biggest contracts:
$45,000 with Army for Other Research and Development -- Applied Research and Exploratory Development (R&D). Signed on 2004-07-02. Completion date: 2004-09-30.
$45,000 with U.S. Army Corps of Engineers - civil program financing only for Other Research and Development -- Applied Research and Exploratory Development (R&D). Signed on 2004-07-02. Completion date: 2004-09-30.
$8,964, same as above.Signed on 2003-09-08. Completion date: 2004-01-08.
$1,000, same as above.Signed on 2002-01-22. Completion date: 2001-12-31.
LEANICS CORP (6600 FOUNTAIN LN NORTH in OSSEO, MN; small business)
$69,977 with Navy for Defense Electronics and Communication Equipment -- Advanced Development (R&D). Signed on 2006-06-22. Completion date: 2007-06-30.
PAKOR INC (6450 WEDGWOOD ROAD, SUITE in MAPLE GROVE, MN; small business)
$20,850 with Navy for Cameras, Motion Picture. Signed on 2003-03-28. Completion date: 2003-04-04.
MAPLE GROVE LODGING INVESTERS (6350 VINEWOOD LN in OSSEO, MN; small business) : $19,817 in 2 contractsin 2004
$19,706 with Army for Lodging - Hotel/Motel. Signed on 2004-03-22. Completion date: 2004-04-18.
$111, same as above.Signed on 2004-08-19. Completion date: 2004-04-18.
COMTROL CORPORATION (6655 WEDGWOOD RD STE 120 in OSSEO, MN) : $12,819 in 2 contractsfrom 2005 to 2006
$9,835 with Navy for Communications Security Equipment and Components. Taking place in CA. Signed on 2006-02-02. Completion date: 2006-02-28.
$2,984 with Army for ADP Components. Signed on 2005-04-06. Completion date: 2005-05-30.
MILLER, RICHARD JOHN ARBITRATO (7919 ORCHID LN N in OSSEO, MN; small business) : $10,853 in 3 contractsin 2006
$4,992 with Army for Legal Services. Signed on 2006-01-06. Completion date: 2005-12-07.
$3,000, same as above.Signed on 2006-03-09. Completion date: 2005-12-07.
$2,861 with Bureau of Prisoners/Federal Prison System for Miscellaneous Items. Taking place in GA. Signed on 2006-02-02. Effective on 2005-12-09. Completion date: 2005-12-09.
Top industries in this zip code by the number of employees in 2005:
Management of Companies and Enterprises: Corporate, Subsidiary, and Regional Managing Offices (over 1000 employees: 1 establishment, 20-49 employees: 3 establishments, 1-4 employees: 5 establishments)
Health Care and Social Assistance: Residential Mental Retardation Facilities (500-999: 1, 10-19: 1, 5-9: 1)
Administrative and Support and Waste Management and Remediation Services: Temporary Help Services (500-999: 1, 10-19: 1)
Information: Data Processing, Hosting, and Related Services (250-499: 1, 5-9: 1, 1-4: 2)
Other Services (except Public Administration): Religious Organizations (50-99: 2, 20-49: 1, 10-19: 1, 1-4: 3)
Arts, Entertainment, and Recreation: Golf Courses and Country Clubs (100-249: 1)
People in group quarters in 2010:
20 people in group homes intended for adults
People in group quarters in 2000:
31 people in homes for the mentally retarded
7 people in homes for the physically handicapped
Fatal accident statistics in 2012:
Fatal accident count: 1
Vehicles involved in fatal accidents: 3
Fatal accidents caused by drunken drivers: 0
Fatalities: 1
Persons involved in fatal accidents: 4
Pedestrians involved in fatal accidents: 0
Fatal accident statistics in 2011:
Fatal accident count: 2
Vehicles involved in fatal accidents: 3
Fatal accidents caused by drunken drivers: 0
Fatalities: 2
Persons involved in fatal accidents: 3
Pedestrians involved in fatal accidents: 1
Home Mortgage Disclosure Act Aggregated Statistics For Year 2009 (Based on 5 full and 2 partial tracts)
A) FHA, FSA/RHS & VA Home Purchase Loans
B) Conventional Home Purchase Loans
C) Refinancings
D) Home Improvement Loans
E) Loans on Dwellings For 5+ Families
F) Non-occupant Loans on < 5 Family Dwellings (A B C & D)
Number
Average Value
Number
Average Value
Number
Average Value
Number
Average Value
Number
Average Value
Number
Average Value
LOANS ORIGINATED
360
$213,644
630
$282,985
2,574
$253,774
93
$143,663
1
$220,000
54
$155,802
APPLICATIONS APPROVED, NOT ACCEPTED
20
$191,760
22
$340,515
177
$252,941
12
$54,652
0
$0
3
$325,300
APPLICATIONS DENIED
24
$210,481
56
$286,296
460
$267,446
44
$93,682
0
$0
29
$166,388
APPLICATIONS WITHDRAWN
31
$251,563
72
$296,791
367
$249,449
12
$81,837
0
$0
10
$238,427
FILES CLOSED FOR INCOMPLETENESS
2
$122,205
7
$319,741
119
$253,791
11
$30,092
0
$0
2
$117,635
Aggregated Statistics For Year 2008 (Based on 5 full and 2 partial tracts)
A) FHA, FSA/RHS & VA Home Purchase Loans
B) Conventional Home Purchase Loans
C) Refinancings
D) Home Improvement Loans
F) Non-occupant Loans on < 5 Family Dwellings (A B C & D)
G) Loans On Manufactured Home Dwelling (A B C & D)
Number
Average Value
Number
Average Value
Number
Average Value
Number
Average Value
Number
Average Value
Number
Average Value
LOANS ORIGINATED
211
$221,500
851
$291,147
899
$241,537
81
$102,611
41
$194,702
3
$38,333
APPLICATIONS APPROVED, NOT ACCEPTED
10
$228,673
78
$291,751
129
$238,508
16
$140,471
3
$232,030
0
$0
APPLICATIONS DENIED
14
$231,204
87
$308,622
341
$257,296
40
$116,852
14
$322,061
2
$65,000
APPLICATIONS WITHDRAWN
16
$160,957
88
$250,408
235
$227,928
26
$51,284
24
$207,517
0
$0
FILES CLOSED FOR INCOMPLETENESS
4
$152,570
17
$256,234
51
$287,593
7
$79,736
4
$184,925
0
$0
Aggregated Statistics For Year 2007 (Based on 5 full and 2 partial tracts)
A) FHA, FSA/RHS & VA Home Purchase Loans
B) Conventional Home Purchase Loans
C) Refinancings
D) Home Improvement Loans
F) Non-occupant Loans on < 5 Family Dwellings (A B C & D)
G) Loans On Manufactured Home Dwelling (A B C & D)
Number
Average Value
Number
Average Value
Number
Average Value
Number
Average Value
Number
Average Value
Number
Average Value
LOANS ORIGINATED
41
$225,191
1,148
$244,764
1,008
$214,014
161
$70,793
99
$218,573
0
$0
APPLICATIONS APPROVED, NOT ACCEPTED
3
$193,610
143
$239,839
171
$216,882
40
$82,233
8
$193,874
2
$20,800
APPLICATIONS DENIED
5
$183,200
174
$273,218
458
$218,429
60
$113,230
57
$227,805
0
$0
APPLICATIONS WITHDRAWN
1
$206,000
118
$271,849
198
$200,788
23
$174,040
17
$270,001
0
$0
FILES CLOSED FOR INCOMPLETENESS
0
$0
13
$227,948
58
$272,596
12
$46,422
1
$178,000
0
$0
Aggregated Statistics For Year 2006 (Based on 5 full and 2 partial tracts)
A) FHA, FSA/RHS & VA Home Purchase Loans
B) Conventional Home Purchase Loans
C) Refinancings
D) Home Improvement Loans
F) Non-occupant Loans on < 5 Family Dwellings (A B C & D)
G) Loans On Manufactured Home Dwelling (A B C & D)
Number
Average Value
Number
Average Value
Number
Average Value
Number
Average Value
Number
Average Value
Number
Average Value
LOANS ORIGINATED
82
$201,335
1,858
$223,678
1,136
$211,938
187
$81,822
140
$174,764
2
$16,465
APPLICATIONS APPROVED, NOT ACCEPTED
6
$163,718
204
$201,344
203
$178,099
35
$76,330
15
$160,755
7
$59,853
APPLICATIONS DENIED
7
$201,527
173
$181,435
456
$199,307
63
$81,157
19
$210,704
5
$44,618
APPLICATIONS WITHDRAWN
13
$196,135
197
$197,350
361
$217,541
20
$199,112
32
$163,101
0
$0
FILES CLOSED FOR INCOMPLETENESS
2
$171,605
57
$244,943
66
$198,187
9
$178,607
4
$170,585
0
$0
Aggregated Statistics For Year 2005 (Based on 5 full and 2 partial tracts)
A) FHA, FSA/RHS & VA Home Purchase Loans
B) Conventional Home Purchase Loans
C) Refinancings
D) Home Improvement Loans
E) Loans on Dwellings For 5+ Families
F) Non-occupant Loans on < 5 Family Dwellings (A B C & D)
Number
Average Value
Number
Average Value
Number
Average Value
Number
Average Value
Number
Average Value
Number
Average Value
LOANS ORIGINATED
104
$201,996
2,344
$210,954
1,446
$220,250
148
$86,751
1
$193,000
169
$168,552
APPLICATIONS APPROVED, NOT ACCEPTED
4
$158,802
240
$190,650
195
$184,923
24
$87,809
0
$0
18
$185,097
APPLICATIONS DENIED
4
$167,290
230
$176,220
427
$209,830
54
$100,911
0
$0
28
$244,246
APPLICATIONS WITHDRAWN
11
$194,745
235
$192,444
372
$221,892
38
$290,181
0
$0
12
$159,444
FILES CLOSED FOR INCOMPLETENESS
6
$179,442
81
$219,917
170
$239,386
13
$105,283
0
$0
5
$258,294
Aggregated Statistics For Year 2004 (Based on 5 full and 2 partial tracts)
A) FHA, FSA/RHS & VA Home Purchase Loans
B) Conventional Home Purchase Loans
C) Refinancings
D) Home Improvement Loans
E) Loans on Dwellings For 5+ Families
F) Non-occupant Loans on < 5 Family Dwellings (A B C & D)
G) Loans On Manufactured Home Dwelling (A B C & D)
Number
Average Value
Number
Average Value
Number
Average Value
Number
Average Value
Number
Average Value
Number
Average Value
Number
Average Value
LOANS ORIGINATED
186
$186,148
2,242
$212,360
1,660
$212,834
168
$56,116
1
$364,000
150
$151,340
0
$0
APPLICATIONS APPROVED, NOT ACCEPTED
6
$179,735
212
$224,582
222
$222,650
8
$31,250
0
$0
12
$98,436
0
$0
APPLICATIONS DENIED
13
$191,240
222
$178,456
465
$192,938
91
$75,381
0
$0
22
$102,387
4
$79,262
APPLICATIONS WITHDRAWN
19
$188,098
224
$218,259
340
$203,515
26
$52,218
0
$0
20
$161,730
0
$0
FILES CLOSED FOR INCOMPLETENESS
3
$242,097
40
$213,740
142
$218,320
15
$65,190
0
$0
4
$255,915
0
$0
Aggregated Statistics For Year 2003 (Based on 5 full and 2 partial tracts)
A) FHA, FSA/RHS & VA Home Purchase Loans
B) Conventional Home Purchase Loans
C) Refinancings
D) Home Improvement Loans
E) Loans on Dwellings For 5+ Families
F) Non-occupant Loans on < 5 Family Dwellings (A B C & D)
Number
Average Value
Number
Average Value
Number
Average Value
Number
Average Value
Number
Average Value
Number
Average Value
LOANS ORIGINATED
189
$172,100
1,716
$209,587
5,241
$191,221
158
$51,340
2
$246,235
143
$152,586
APPLICATIONS APPROVED, NOT ACCEPTED
22
$176,494
189
$195,255
460
$191,705
22
$55,652
0
$0
10
$148,069
APPLICATIONS DENIED
7
$183,860
102
$190,165
579
$184,131
54
$57,282
0
$0
14
$190,654
APPLICATIONS WITHDRAWN
11
$179,233
149
$198,026
516
$173,905
5
$48,358
0
$0
32
$165,245
FILES CLOSED FOR INCOMPLETENESS
2
$169,000
29
$191,219
114
$191,864
10
$30,989
0
$0
0
$0
Aggregated Statistics For Year 2002 (Based on 2 full tracts)
A) FHA, FSA/RHS & VA Home Purchase Loans
B) Conventional Home Purchase Loans
C) Refinancings
D) Home Improvement Loans
F) Non-occupant Loans on < 5 Family Dwellings (A B C & D)
Number
Average Value
Number
Average Value
Number
Average Value
Number
Average Value
Number
Average Value
LOANS ORIGINATED
64
$157,594
216
$162,796
498
$115,490
26
$56,154
38
$134,316
APPLICATIONS APPROVED, NOT ACCEPTED
4
$147,500
10
$117,400
48
$97,750
4
$10,000
0
$0
APPLICATIONS DENIED
4
$174,000
24
$112,500
86
$106,116
8
$17,500
4
$96,000
APPLICATIONS WITHDRAWN
4
$147,000
18
$150,000
72
$111,250
2
$5,000
4
$65,000
FILES CLOSED FOR INCOMPLETENESS
0
$0
10
$145,000
32
$133,062
0
$0
0
$0
Aggregated Statistics For Year 2001 (Based on 2 full tracts)
A) FHA, FSA/RHS & VA Home Purchase Loans
B) Conventional Home Purchase Loans
C) Refinancings
D) Home Improvement Loans
F) Non-occupant Loans on < 5 Family Dwellings (A B C & D)
Number
Average Value
Number
Average Value
Number
Average Value
Number
Average Value
Number
Average Value
LOANS ORIGINATED
58
$138,931
158
$116,139
458
$98,969
22
$17,364
38
$126,158
APPLICATIONS APPROVED, NOT ACCEPTED
0
$0
2
$140,000
28
$89,071
4
$8,500
0
$0
APPLICATIONS DENIED
0
$0
16
$104,625
106
$100,566
4
$40,000
4
$182,000
APPLICATIONS WITHDRAWN
0
$0
10
$133,400
56
$102,500
2
$38,000
4
$182,000
FILES CLOSED FOR INCOMPLETENESS
0
$0
2
$136,000
16
$118,625
0
$0
0
$0
Aggregated Statistics For Year 2000 (Based on 2 full tracts)
A) FHA, FSA/RHS & VA Home Purchase Loans
B) Conventional Home Purchase Loans
C) Refinancings
D) Home Improvement Loans
F) Non-occupant Loans on < 5 Family Dwellings (A B C & D)
Number
Average Value
Number
Average Value
Number
Average Value
Number
Average Value
Number
Average Value
LOANS ORIGINATED
66
$120,485
176
$104,739
114
$75,526
44
$19,273
18
$92,889
APPLICATIONS APPROVED, NOT ACCEPTED
0
$0
8
$63,750
22
$83,636
8
$18,000
0
$0
APPLICATIONS DENIED
2
$95,000
14
$46,714
40
$79,150
4
$17,500
2
$40,000
APPLICATIONS WITHDRAWN
0
$0
8
$134,750
46
$85,783
2
$20,000
4
$136,000
FILES CLOSED FOR INCOMPLETENESS
0
$0
4
$72,500
16
$113,750
0
$0
0
$0
Aggregated Statistics For Year 1999 (Based on 1 full and 1 partial tracts)
A) FHA, FSA/RHS & VA Home Purchase Loans
B) Conventional Home Purchase Loans
C) Refinancings
D) Home Improvement Loans
F) Non-occupant Loans on < 5 Family Dwellings (A B C & D)
2002 - 2018 National Fire Incident Reporting System (NFIRS) incidents
According to the data from the years 2002 - 2018 the average number of fires per year is 34. The highest number of reported fire incidents - 115 took place in 2004, and the least - 3 in 2006. The data has a dropping trend.
When looking into fire subcategories, the most incidents belonged to: Structure Fires (50.8%), and Outside Fires (28.7%).
Fire incident types reported to NFIRS in Zip Code 55311


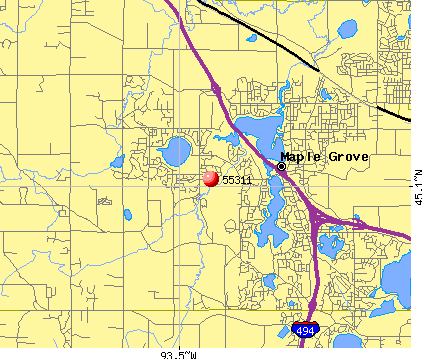 Nearest zip codes: 55369, 55446, 55340, 55442, 55327, 55374.


 According to the data from the years 2002 - 2018 the average number of fires per year is 34. The highest number of reported fire incidents - 115 took place in 2004, and the least - 3 in 2006. The data has a dropping trend.
 When looking into fire subcategories, the most incidents belonged to: Structure Fires (50.8%), and Outside Fires (28.7%).