Estimated zip code population in 2022: 1,430 Zip code population in 2010: 1,520 Zip code population in 2000: 1,536
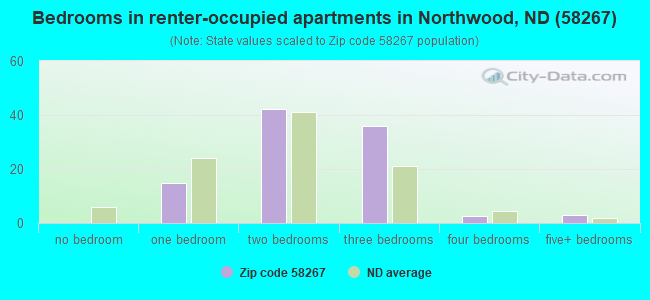
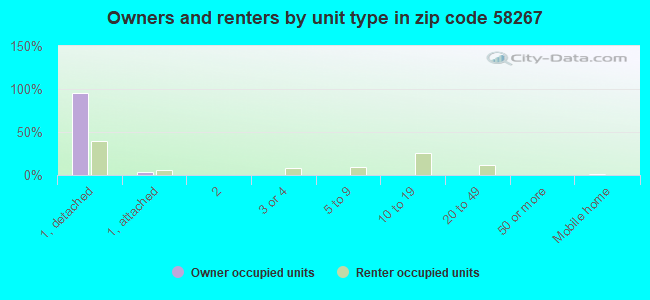
Houses and condos: 651 Renter-occupied apartments: 98
% of renters here:
18%
State:
35%
March 2022 cost of living index in zip code 58267: 79.7 (low, U.S. average is 100)
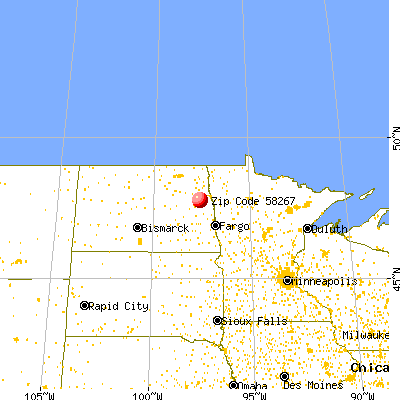
Land area: 235.4 sq. mi. Water area: 0.1 sq. mi.
Population density: 6 people per square mile
(very low).
OSM Map
General Map
Google Map
MSN Map
OSM Map
General Map
Google Map
MSN Map
OSM Map
General Map
Google Map
MSN Map
OSM Map
General Map
Google Map
MSN Map
Please wait while loading the map...
Real estate property taxes paid for housing units in 2022:
This zip code:
0.8% ($1,664)
North Dakota:
1.0% ($2,347)
Median real estate property taxes paid for housing units with mortgages in 2022: $1,801 (0.7%) Median real estate property taxes paid for housing units with no mortgage in 2022: $1,502 (0.8%)
Business Search- 14 Million verified businesses
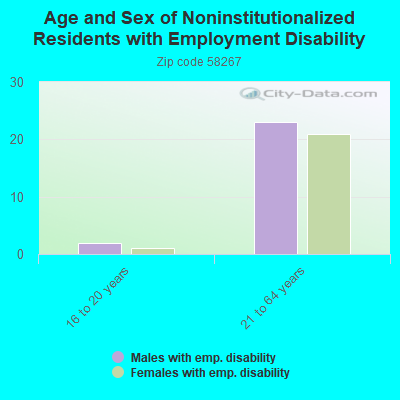
Males: 724
(50.6%)
Females: 706
(49.4%)
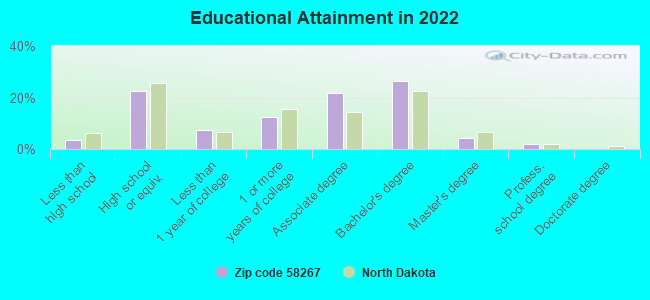
For population 25 years and over in 58267:
High school or higher: 96.3%
Bachelor's degree or higher: 32.6%
Graduate or professional degree: 6.5%
Unemployed: 0.3%
Mean travel time to work (commute): 17.0 minutes
For population 15 years and over in 58267:
Never married: 20.0%
Now married: 61.2%
Separated: 0.8%
Widowed: 7.2%
Divorced: 10.9%
Zip code 58267 compared to state average:
Unemployed percentage significantly below state average.
Black race population percentage significantly below state average.
Hispanic race population percentage significantly below state average.
Median age above state average.
Foreign-born population percentage significantly below state average.
Renting percentage below state average.
Length of stay since moving in above state average.
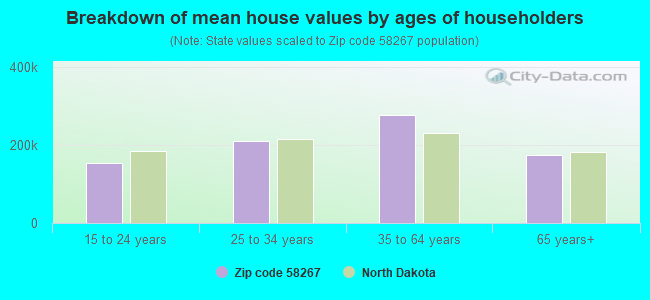
Estimated median house/condo value in 2022: $203,158
58267:
$203,158
North Dakota:
$243,100
Median resident age:
This zip code:
40.9 years
North Dakota median age:
36.2 years
Average household size:
This zip code:
2.5 people
North Dakota:
2.3 people
Averages for the 2020 tax year for zip code 58267, filed in 2021:
Average Adjusted Gross Income (AGI) in 2020: $75,169 (Individual Income Tax Returns)
Here:
$75,169
State:
$77,891
Salary/wage: $52,432 (reported on 80.0% of returns)
Here:
$52,432
State:
$59,202
(% of AGI for various income ranges: 1290.9% for AGIs below $25k, 3757.0% for AGIs $25k-50k, 7607.1% for AGIs $50k-75k, 10920.0% for AGIs $75k-100k, 15730.0% for AGIs $100k-200k)
Taxable interest for individuals: $1,074 (reported on 38.6% of returns)
This zip code:
$1,074
North Dakota:
$2,112
(% of AGI for various income ranges: 23.6% for AGIs below $25k, 24.0% for AGIs $25k-50k, 41.4% for AGIs $50k-75k, 190.0% for AGIs $75k-100k, 115.7% for AGIs $100k-200k)
Ordinary dividends: $3,479 (reported on 20.0% of returns)
Here:
$3,479
State:
$5,239
(% of AGI for various income ranges: 34.5% for AGIs below $25k, 150.0% for AGIs $50k-75k, 491.4% for AGIs $100k-200k)
Net capital gain/loss in AGI: +$8,293 (reported on 20.0% of returns)
Here:
+$8,293
State:
+$17,618
(% of AGI for various income ranges: 60.0% for AGIs below $25k, 154.3% for AGIs $50k-75k, 872.9% for AGIs $100k-200k)
Profit/loss from business: +$13,258 (reported on 17.1% of returns)
Here:
+$13,258
State:
+$12,375
(% of AGI for various income ranges: 112.7% for AGIs below $25k, 308.6% for AGIs $50k-75k, 1787.1% for AGIs $100k-200k)
Taxable individual retirement arrangement distribution: $14,940 (reported on 14.3% of returns)
58267:
$14,940
North Dakota:
$19,361
(% of AGI for various income ranges: 189.1% for AGIs below $25k, 607.1% for AGIs $50k-75k, 1230.0% for AGIs $100k-200k)
Total itemized deductions: $30,950 (reported on 5.7% of returns)
Here:
$30,950
State:
$41,689
(% of AGI for various income ranges: 3095.0% for AGIs $75k-100k)
Charity contributions: $9,600 (reported on 2.9% of returns)
Here:
$9,600
State:
$18,168
(% of AGI for various income ranges: 480.0% for AGIs $75k-100k)
Taxes paid: $4,275 (reported on 5.7% of returns)
58267:
$4,275
State:
$6,420
(% of AGI for various income ranges: 427.5% for AGIs $75k-100k)
Earned income credit: $2,333 (reported on 8.6% of returns)
Here:
$2,333
State:
$2,120
(% of AGI for various income ranges: 75.5% for AGIs below $25k, 57.0% for AGIs $25k-50k)
Percentage of individuals using paid preparers for their 2020 taxes: 91.4%
Here:
91%
State:
95%
(% for various income ranges: 88.9% for AGIs below $25k, 92.9% for AGIs $25k-50k, 91.7% for AGIs $50k-75k, 88.9% for AGIs $75k-100k, 92.9% for AGIs $100k-200k, 100.0% for AGIs over 200k)
Averages for the 2012 tax year for zip code 58267, filed in 2013:
Average Adjusted Gross Income (AGI) in 2012: $69,122 (Individual Income Tax Returns)
Here:
$69,122
State:
$70,683
Salary/wage: $41,749 (reported on 80.9% of returns)
Here:
$41,749
State:
$48,615
(% of AGI for various income ranges: 71.1% for AGIs below $25k, 66.6% for AGIs $25k-50k, 62.5% for AGIs $50k-75k, 67.1% for AGIs $75k-100k, 49.6% for AGIs $100k-200k, 19.3% for AGIs over 200k)
Taxable interest for individuals: $1,010 (reported on 44.1% of returns)
This zip code:
$1,010
North Dakota:
$1,659
(% of AGI for various income ranges: 1.3% for AGIs below $25k, 0.6% for AGIs $25k-50k, 1.1% for AGIs $50k-75k, 0.5% for AGIs $75k-100k, 0.8% for AGIs $100k-200k, 0.3% for AGIs over 200k)
Ordinary dividends: $2,538 (reported on 19.1% of returns)
Here:
$2,538
State:
$4,855
(% of AGI for various income ranges: 0.6% for AGIs $25k-50k, 1.3% for AGIs $50k-75k, 0.6% for AGIs $75k-100k, 1.4% for AGIs $100k-200k)
Net capital gain/loss in AGI: +$19,271 (reported on 20.6% of returns)
Here:
+$19,271
State:
+$26,078
(% of AGI for various income ranges: 1.9% for AGIs $25k-50k, 2.3% for AGIs $50k-75k, 1.4% for AGIs $75k-100k, 6.0% for AGIs $100k-200k, 12.5% for AGIs over 200k)
Profit/loss from business: +$17,260 (reported on 14.7% of returns)
Here:
+$17,260
State:
+$14,112
(% of AGI for various income ranges: 10.8% for AGIs below $25k, 5.2% for AGIs $50k-75k, 9.7% for AGIs $100k-200k)
Taxable individual retirement arrangement distribution: $9,688 (reported on 11.8% of returns)
58267:
$9,688
North Dakota:
$12,079
Total itemized deductions: $20,245 (18% of AGI, reported on 16.2% of returns)
Here:
$20,245
State:
$22,515
Here:
17.9% of AGI
State:
13.2% of AGI
(% of AGI for various income ranges: 10.0% for AGIs $25k-50k, 8.2% for AGIs $50k-75k, 9.3% for AGIs $100k-200k)
Charity contributions: $6,500 (reported on 11.8% of returns)
Here:
$6,500
State:
$5,593
Taxes paid: $3,591 (reported on 16.2% of returns)
58267:
$3,591
State:
$6,844
(% of AGI for various income ranges: 0.7% for AGIs $25k-50k, 0.9% for AGIs $50k-75k, 2.6% for AGIs $100k-200k)
Earned income credit: $1,914 (reported on 10.3% of returns)
Here:
$1,914
State:
$1,989
(% of AGI for various income ranges: 4.3% for AGIs below $25k, 0.6% for AGIs $25k-50k)
Percentage of individuals using paid preparers for their 2012 taxes: 69.1%
Here:
69%
State:
59%
(% for various income ranges: 57.1% for AGIs below $25k, 66.7% for AGIs $25k-50k, 75.0% for AGIs $50k-75k, 75.0% for AGIs $75k-100k, 87.5% for AGIs $100k-200k, 75.0% for AGIs over 200k)
Averages for the 2004 tax year for zip code 58267, filed in 2005:
Average Adjusted Gross Income (AGI) in 2004: $37,570 (Individual Income Tax Returns)
Here:
$37,570
State:
$40,108
Salary/wage: $30,675 (reported on 80.9% of returns)
Here:
$30,675
State:
$33,868
(% of AGI for various income ranges: 84.1% for AGIs below $10k, 63.2% for AGIs $10k-25k, 74.5% for AGIs $25k-50k, 67.4% for AGIs $50k-75k, 62.8% for AGIs $75k-100k, 54.0% for AGIs over 100k)
Taxable interest for individuals: $1,463 (reported on 55.2% of returns)
This zip code:
$1,463
North Dakota:
$1,652
(% of AGI for various income ranges: 6.0% for AGIs below $10k, 5.4% for AGIs $10k-25k, 1.6% for AGIs $25k-50k, 1.8% for AGIs $50k-75k, 1.9% for AGIs $75k-100k, 1.1% for AGIs over 100k)
Taxable dividends: $1,437 (reported on 23.5% of returns)
Here:
$1,437
State:
$2,207
(% of AGI for various income ranges: 2.3% for AGIs below $10k, 1.0% for AGIs $10k-25k, 0.4% for AGIs $25k-50k, 1.1% for AGIs $50k-75k, 1.0% for AGIs $75k-100k, 0.9% for AGIs over 100k)
Net capital gain/loss: +$2,497 (reported on 20.4% of returns)
Here:
+$2,497
State:
+$6,573
(% of AGI for various income ranges: -0.7% for AGIs below $10k, 1.2% for AGIs $10k-25k, -0.1% for AGIs $25k-50k, 1.4% for AGIs $50k-75k, 0.1% for AGIs $75k-100k, 4.4% for AGIs over 100k)
Profit/loss from business: +$8,404 (reported on 15.3% of returns)
Here:
+$8,404
State:
+$8,636
(% of AGI for various income ranges: 3.5% for AGIs $10k-25k, 1.5% for AGIs $25k-50k, 5.1% for AGIs $50k-75k, 5.8% for AGIs $75k-100k, 2.0% for AGIs over 100k)
Profit/loss from farming: +$11,059 (reported on 11.9% of returns)
Here:
+$11,059
State:
+$1,979
(% of AGI for various income ranges: -15.5% for AGIs below $10k, 3.4% for AGIs $25k-50k, 2.5% for AGIs $50k-75k, 9.6% for AGIs $75k-100k, 5.6% for AGIs over 100k)
IRA payment deduction: $1,708 (reported on 3.4% of returns)
58267:
$1,708
North Dakota:
$2,969
Total itemized deductions: $14,888 (21% of AGI, reported on 11.2% of returns)
Here:
$14,888
State:
$16,683
Here:
20.5% of AGI
State:
18.6% of AGI
(% of AGI for various income ranges: 8.6% for AGIs $10k-25k, 3.5% for AGIs $25k-50k, 4.3% for AGIs $50k-75k, 7.0% for AGIs over 100k)
Charity contributions deductions: $4,156 (5% of AGI, reported on 9.0% of returns)
Here:
$4,156
State:
$3,523
Here:
5.2% of AGI
State:
3.6% of AGI
(% of AGI for various income ranges: 0.6% for AGIs $10k-25k, 0.6% for AGIs $25k-50k, 0.9% for AGIs $50k-75k, 2.8% for AGIs over 100k)
Total tax: $4,975 (reported on 77.5% of returns)
58267:
$4,975
State:
$5,748
(% of AGI for various income ranges: 1.8% for AGIs below $10k, 4.5% for AGIs $10k-25k, 7.0% for AGIs $25k-50k, 10.2% for AGIs $50k-75k, 12.2% for AGIs $75k-100k, 18.4% for AGIs over 100k)
Earned income credit: $1,609 (reported on 9.0% of returns)
Here:
$1,609
State:
$1,558
Percentage of individuals using paid preparers for their 2004 taxes: 70.4%
Here:
70%
State:
63%
(% for various income ranges: 61.3% for AGIs below $10k, 72.1% for AGIs $10k-25k, 69.4% for AGIs $25k-50k, 75.4% for AGIs $50k-75k, 75.0% for AGIs $75k-100k, 80.6% for AGIs over 100k)
Household received Food Stamps/SNAP in the past 12 months: 18 Household did not receive Food Stamps/SNAP in the past 12 months: 531
Women who had a birth in the past 12 months: 17 (16 now married, 2 unmarried) Women who did not have a birth in the past 12 months: 240 (125 now married, 114 unmarried)
Housing units in zip code 58267 with a mortgage: 227 (31 second mortgage, 26 both second mortgage and home equity loan) Houses without a mortgage: 9
Median monthly owner costs for units with a mortgage: $1,431 Median monthly owner costs for units without a mortgage: $581
Residents with income below the poverty level in 2022:
This zip code:
8.2%
Whole state:
11.5%
Residents with income below 50% of the poverty level in 2022:
This zip code:
4.9%
Whole state:
5.9%
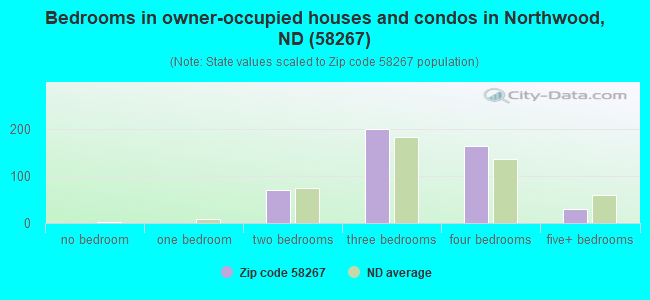
Median number of rooms in houses and condos:
Here:
7.6
State:
7.0
Median number of rooms in apartments:
Here:
4.1
State:
4.0
Notable locations in this zip code not listed on our city pages
Notable locations in zip code 58267: Union Town Hall (A), Lind Town Hall (B), Pleasant View Town Hall (C), Avon Town Hall (D), Grace Town Hall (E), Northwood Volunteer Fire Department (F). Display/hide their locations on the map
In group quarters: 46 (-1 institutionalized population)
Size of family households: 192 2-persons, 86 3-persons, 67 4-persons, 18 5-persons, 2 6-persons, 18 7-or-more-persons
Size of nonfamily households: 149 1-person, 4 2-persons, 10 3-persons
176 married couples with children.
114 single-parent households (4 men, 110 women).
98.2% of residents of 58267 zip code speak English at home.
0.2% of residents speak Spanish at home (100% very well).
1.1% of residents speak other Indo-European language at home (100% very well).
0.4% of residents speak other language at home (100% very well).
Foreign born population: 0 (0.0%)
:
0.0%
Whole state:
4.9%
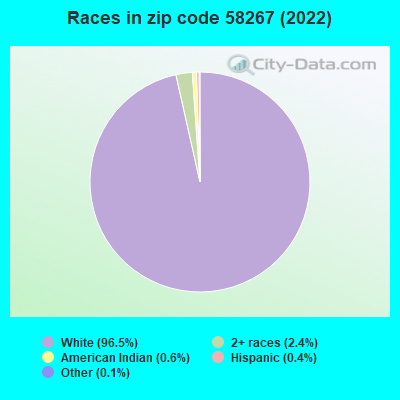
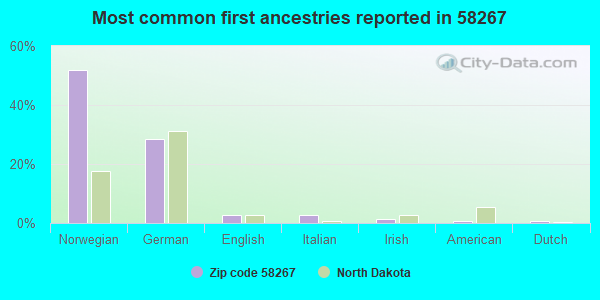
52%Norwegian
28%German
3%English
3%Italian
2%Irish
1%American
1%Dutch
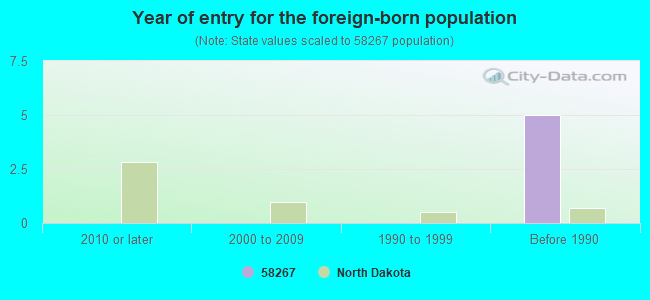
Year of entry for the foreign-born population
02010 or later
02000 to 2009
01990 to 1999
5Before 1990
Facilities with environmental interests located in this zip code:
NORTHWOOD ELEMENTARY SCHOOL (219 HOUGEN ST in NORTHWOOD, ND)
(National Center for Education Statistics) - STATE ID-61341 Organizations: NORTHWOOD 129 (SCHOOL DISTRICT)
NORTHWOOD HIGH SCHOOL (219 HOUGEN ST in NORTHWOOD, ND)
(National Center for Education Statistics) - STATE ID-61342 Organizations: NORTHWOOD 129 (SCHOOL DISTRICT)
GABRIEL CONSTRUCTION, INC (904 COUNTY RD, B12 in NORTHWOOD, ND)
AIR MINOR (AIRS/AFS) Business SIC classification: CONSTRUCTION SAND AND GRAVEL
NORTHWOOD CITY OF ( in NORTHWOOD, ND)
National Pollutant Discharge Elimination System NON-MAJOR (Tracking pollutant discharge elimination systems) - permit Business SIC classification: SEWERAGE SYSTEMS
NORTHWOOD MUNICIPAL LIGHT PLANT (12 NORTH RAYMOND STREET in NORTHWOOD, ND)
ENFORCEMENT/COMPLIANCE ACTIVITY (Integrated Compliance Information System) COMPLIANCE ACTIVITY (Tracking inspections of insecticide, fungicide, and rodenticide, and toxic substances) Alternative names: NORTHWOOD MINICIPAL LIGHT PLANT, NORTHWOOD MUNICIPAL ELECTRIC
AGVISE LABORATORIES (604 HWY 15 in NORTHWOOD, ND)
Conditionally Exempt Small Quantity Generators, less than 100 kg/month of hazardous waste (Resource Conservation and Recovery Act (tracking hazardous waste)) - notification Organizations: EDWARD LLOYD PHD (CONTACT/OWNER)
NORTHWOOD SCHOOL DISTRICT # 129 (219 HOUGEN STREET in NORTHWOOD, ND)
ENFORCEMENT/COMPLIANCE ACTIVITY (Integrated Compliance Information System) COMPLIANCE ACTIVITY (Tracking inspections of insecticide, fungicide, and rodenticide, and toxic substances) Business SIC classification: ELEMENTARY AND SECONDARY SCHOOLS Business NAICS classification: ALL OTHER MISCELLANEOUS SCHOOLS AND INSTRUCTION.
NORTHWOOD LANDFILL (100 N RAYMOND ST in NORTHWOOD, ND)
CRITERIA AND HAZARDOUS AIR POLLUTANT INVENTORY (Inventory of air pollution sources) Business SIC classification: REFUSE SYSTEMS Business NAICS classification: SOLID WASTE LANDFILL.
NORTHWOOD MUNICIPAL LIGHT PLANT (MAIN STREET in NORTHWOOD, ND)
COMPLIANCE ACTIVITY (Tracking inspections of insecticide, fungicide, and rodenticide, and toxic substances)
Housing units lacking complete plumbing facilities: 0.4%
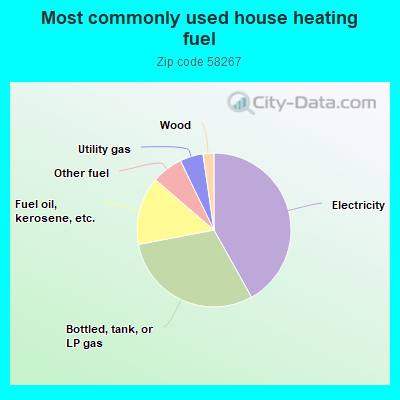
42.2%Electricity
30.3%Bottled, tank, or LP gas
14.4%Fuel oil, kerosene, etc.
6.6%Other fuel
4.9%Utility gas
2.3%Wood
Population in 1990: 1,910.
Place of birth for U.S.-born residents:
This state: 929
Northeast: 37
Midwest: 325
South: 30
West: 95
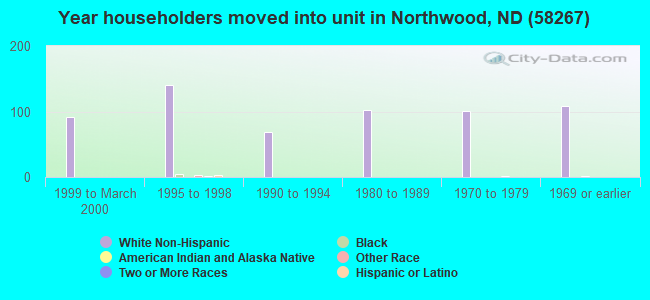
62% of the 58267 zip code residents lived in the same house 5 years ago. Out of people who lived in different houses, 66% lived in this county. Out of people who lived in different counties, 50% lived in North Dakota.
91% of the 58267 zip code residents lived in the same house 1 year ago. Out of people who lived in different houses, 76% moved from this county. Out of people who lived in different houses, 5% moved from different county within same state. Out of people who lived in different houses, 16% moved from different state.
Private vs. public school enrollment:
Students in private schools in grades 1 to 8 (elementary and middle school): 44
Here:
26.1%
North Dakota:
8.4%
Students in private schools in grades 9 to 12 (high school):
Here:
0.0%
North Dakota:
8.2%
Students in private undergraduate colleges:
Here:
0.0%
North Dakota:
14.3%
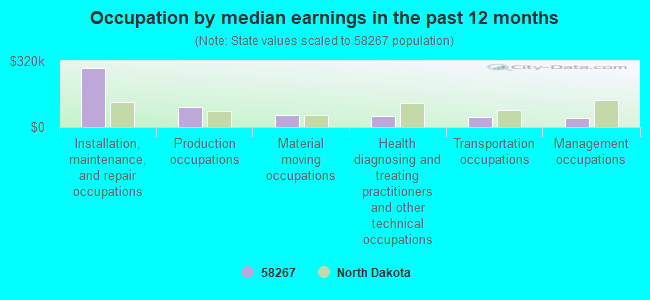
Occupation by median earnings in the past 12 months ($)
285,851Installation, maintenance, and repair occupations
98,750Production occupations
57,555Material moving occupations
54,764Health diagnosing and treating practitioners and other technical occupations
46,998Transportation occupations
42,351Management occupations
Companies with federal contracts located in this zip code:
MELAND LUMBER & MATERIAL CO (207 S MAIN ST in NORTHWOOD, ND; small business) : $44,923 in 3 contractsfrom 2003 to 2005
$39,099 with Army for Lumber and Related Basic Wood Materials. Signed on 2003-06-03. Completion date: 2003-07-03.
$5,824, same as above.Signed on 2005-09-11. Completion date: 2005-10-17.
$0, same as above.Signed on 2003-06-03. Completion date: 2003-07-03.
PEDERSON IMPLEMENT COMPANY INC (2905 5TH AVE NE in NORTHWOOD, ND; small business)
$41,769 with Air Force for Gardening Implements and Tools. Signed on 2005-09-30. Completion date: 2005-10-31.
Top industries in this zip code by the number of employees in 2005:
Health Care and Social Assistance: General Medical and Surgical Hospitals (100-249 employees: 1 establishment)
Wholesale Trade: Farm and Garden Machinery and Equipment Merchant Wholesalers (20-49: 1, 10-19: 1)
Wholesale Trade: Brick, Stone, and Related Construction Material Merchant Wholesalers (20-49: 1)
Health Care and Social Assistance: Offices of Physicians (except Mental Health Specialists) (20-49: 1)
Professional, Scientific, and Technical Services: Testing Laboratories (10-19: 1)
Health Care and Social Assistance: Offices of Dentists (10-19: 1)
People in group quarters in 2010:
58 people in nursing facilities/skilled-nursing facilities
People in group quarters in 2000:
75 people in nursing homes
Fatal accident statistics in 2013:
Fatal accident count: 1
Vehicles involved in fatal accidents: 1
Fatal accidents caused by drunken drivers: 0
Fatalities: 1
Persons involved in fatal accidents: 1
Pedestrians involved in fatal accidents: 0
Home Mortgage Disclosure Act Aggregated Statistics For Year 2009 (Based on 2 partial tracts)
A) FHA, FSA/RHS & VA Home Purchase Loans
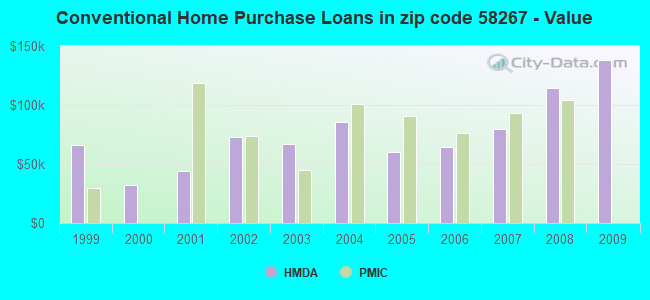
B) Conventional Home Purchase Loans
C) Refinancings
D) Home Improvement Loans
E) Loans on Dwellings For 5+ Families
F) Non-occupant Loans on < 5 Family Dwellings (A B C & D)
G) Loans On Manufactured Home Dwelling (A B C & D)
Number
Average Value
Number
Average Value
Number
Average Value
Number
Average Value
Number
Average Value
Number
Average Value
Number
Average Value
LOANS ORIGINATED
18
$95,658
4
$138,402
39
$120,773
15
$47,523
1
$608,670
4
$47,250
1
$17,860
APPLICATIONS APPROVED, NOT ACCEPTED
0
$0
1
$349,730
3
$64,490
0
$0
0
$0
0
$0
0
$0
APPLICATIONS DENIED
0
$0
6
$66,722
16
$110,871
3
$17,860
0
$0
3
$57,047
1
$63,990
APPLICATIONS WITHDRAWN
0
$0
0
$0
9
$122,198
6
$112,358
0
$0
0
$0
0
$0
FILES CLOSED FOR INCOMPLETENESS
0
$0
0
$0
4
$125,752
0
$0
0
$0
0
$0
0
$0
Aggregated Statistics For Year 2008 (Based on 2 partial tracts)
A) FHA, FSA/RHS & VA Home Purchase Loans
B) Conventional Home Purchase Loans
C) Refinancings
D) Home Improvement Loans
E) Loans on Dwellings For 5+ Families
F) Non-occupant Loans on < 5 Family Dwellings (A B C & D)
Number
Average Value
Number
Average Value
Number
Average Value
Number
Average Value
Number
Average Value
Number
Average Value
LOANS ORIGINATED
10
$102,537
19
$114,278
22
$100,860
22
$19,955
1
$166,680
6
$58,288
APPLICATIONS APPROVED, NOT ACCEPTED
0
$0
0
$0
6
$54,320
0
$0
0
$0
1
$32,740
APPLICATIONS DENIED
4
$112,730
6
$75,402
13
$114,477
3
$9,427
0
$0
0
$0
APPLICATIONS WITHDRAWN
0
$0
1
$89,290
6
$114,592
1
$99,710
0
$0
0
$0
FILES CLOSED FOR INCOMPLETENESS
0
$0
0
$0
1
$200,910
0
$0
0
$0
0
$0
Aggregated Statistics For Year 2007 (Based on 2 partial tracts)
A) FHA, FSA/RHS & VA Home Purchase Loans
B) Conventional Home Purchase Loans
C) Refinancings
D) Home Improvement Loans
F) Non-occupant Loans on < 5 Family Dwellings (A B C & D)
G) Loans On Manufactured Home Dwelling (A B C & D)
Number
Average Value
Number
Average Value
Number
Average Value
Number
Average Value
Number
Average Value
Number
Average Value
LOANS ORIGINATED
6
$82,843
22
$79,686
25
$91,376
16
$18,416
3
$113,103
3
$28,277
APPLICATIONS APPROVED, NOT ACCEPTED
0
$0
0
$0
7
$78,874
6
$47,375
0
$0
3
$100,207
APPLICATIONS DENIED
0
$0
4
$59,155
31
$85,452
6
$44,893
1
$136,910
1
$59,530
APPLICATIONS WITHDRAWN
1
$177,100
7
$84,614
6
$97,477
0
$0
1
$117,570
0
$0
FILES CLOSED FOR INCOMPLETENESS
0
$0
0
$0
3
$113,600
1
$19,350
0
$0
0
$0
Aggregated Statistics For Year 2006 (Based on 2 partial tracts)
A) FHA, FSA/RHS & VA Home Purchase Loans
B) Conventional Home Purchase Loans
C) Refinancings
D) Home Improvement Loans
F) Non-occupant Loans on < 5 Family Dwellings (A B C & D)
Number
Average Value
Number
Average Value
Number
Average Value
Number
Average Value
Number
Average Value
LOANS ORIGINATED
7
$81,426
25
$64,648
19
$75,585
21
$26,220
4
$45,390
APPLICATIONS APPROVED, NOT ACCEPTED
0
$0
3
$34,230
6
$79,123
1
$19,350
0
$0
APPLICATIONS DENIED
4
$121,660
4
$50,970
21
$89,009
3
$3,970
3
$26,290
APPLICATIONS WITHDRAWN
1
$147,330
1
$163,700
7
$107,576
0
$0
0
$0
FILES CLOSED FOR INCOMPLETENESS
0
$0
0
$0
3
$214,300
0
$0
0
$0
Aggregated Statistics For Year 2005 (Based on 2 partial tracts)
A) FHA, FSA/RHS & VA Home Purchase Loans
B) Conventional Home Purchase Loans
C) Refinancings
D) Home Improvement Loans
F) Non-occupant Loans on < 5 Family Dwellings (A B C & D)
Number
Average Value
Number
Average Value
Number
Average Value
Number
Average Value
Number
Average Value
LOANS ORIGINATED
6
$90,037
27
$60,410
31
$72,922
22
$24,488
4
$35,345
APPLICATIONS APPROVED, NOT ACCEPTED
0
$0
3
$90,780
0
$0
3
$41,670
0
$0
APPLICATIONS DENIED
0
$0
10
$59,677
18
$63,993
1
$37,200
0
$0
APPLICATIONS WITHDRAWN
0
$0
4
$50,228
10
$92,417
0
$0
1
$250,020
FILES CLOSED FOR INCOMPLETENESS
0
$0
0
$0
7
$85,253
0
$0
0
$0
Aggregated Statistics For Year 2004 (Based on 2 partial tracts)
A) FHA, FSA/RHS & VA Home Purchase Loans
B) Conventional Home Purchase Loans
C) Refinancings
D) Home Improvement Loans
E) Loans on Dwellings For 5+ Families
F) Non-occupant Loans on < 5 Family Dwellings (A B C & D)
G) Loans On Manufactured Home Dwelling (A B C & D)
Number
Average Value
Number
Average Value
Number
Average Value
Number
Average Value
Number
Average Value
Number
Average Value
Number
Average Value
LOANS ORIGINATED
12
$92,144
22
$85,504
46
$68,392
16
$27,067
0
$0
6
$56,303
0
$0
APPLICATIONS APPROVED, NOT ACCEPTED
0
$0
4
$38,320
15
$48,912
3
$9,920
0
$0
0
$0
1
$22,320
APPLICATIONS DENIED
0
$0
3
$73,913
9
$51,426
4
$15,998
0
$0
0
$0
0
$0
APPLICATIONS WITHDRAWN
0
$0
1
$111,610
7
$83,127
0
$0
1
$63,990
0
$0
0
$0
FILES CLOSED FOR INCOMPLETENESS
0
$0
0
$0
4
$103,802
0
$0
0
$0
0
$0
0
$0
Aggregated Statistics For Year 2003 (Based on 2 partial tracts)
A) FHA, FSA/RHS & VA Home Purchase Loans
B) Conventional Home Purchase Loans
C) Refinancings
D) Home Improvement Loans
F) Non-occupant Loans on < 5 Family Dwellings (A B C & D)
Number
Average Value
Number
Average Value
Number
Average Value
Number
Average Value
Number
Average Value
LOANS ORIGINATED
10
$63,695
9
$67,300
49
$61,077
15
$24,109
0
$0
APPLICATIONS APPROVED, NOT ACCEPTED
0
$0
0
$0
7
$81,851
0
$0
0
$0
APPLICATIONS DENIED
0
$0
1
$171,140
21
$79,300
1
$14,880
0
$0
APPLICATIONS WITHDRAWN
0
$0
3
$96,733
12
$64,117
0
$0
3
$54,567
FILES CLOSED FOR INCOMPLETENESS
0
$0
0
$0
1
$83,340
0
$0
0
$0
Aggregated Statistics For Year 2002 (Based on 2 partial tracts)
A) FHA, FSA/RHS & VA Home Purchase Loans
B) Conventional Home Purchase Loans
C) Refinancings
D) Home Improvement Loans
Number
Average Value
Number
Average Value
Number
Average Value
Number
Average Value
LOANS ORIGINATED
19
$57,648
13
$72,693
30
$59,032
7
$32,953
APPLICATIONS APPROVED, NOT ACCEPTED
0
$0
6
$53,575
4
$34,600
3
$22,820
APPLICATIONS DENIED
1
$32,740
6
$64,737
18
$67,052
4
$21,580
APPLICATIONS WITHDRAWN
4
$49,855
1
$63,990
12
$50,847
0
$0
FILES CLOSED FOR INCOMPLETENESS
0
$0
0
$0
0
$0
0
$0
Aggregated Statistics For Year 2001 (Based on 2 partial tracts)
A) FHA, FSA/RHS & VA Home Purchase Loans
B) Conventional Home Purchase Loans
C) Refinancings
D) Home Improvement Loans
F) Non-occupant Loans on < 5 Family Dwellings (A B C & D)
Number
Average Value
Number
Average Value
Number
Average Value
Number
Average Value
Number
Average Value
LOANS ORIGINATED
12
$50,847
7
$43,796
24
$53,699
10
$13,989
1
$1,490
APPLICATIONS APPROVED, NOT ACCEPTED
0
$0
1
$96,730
4
$79,618
1
$28,280
0
$0
APPLICATIONS DENIED
0
$0
9
$35,551
19
$61,956
1
$86,320
0
$0
APPLICATIONS WITHDRAWN
0
$0
0
$0
18
$54,319
0
$0
0
$0
FILES CLOSED FOR INCOMPLETENESS
0
$0
0
$0
3
$111,613
0
$0
0
$0
Aggregated Statistics For Year 2000 (Based on 2 partial tracts)
A) FHA, FSA/RHS & VA Home Purchase Loans
B) Conventional Home Purchase Loans
C) Refinancings
D) Home Improvement Loans
F) Non-occupant Loans on < 5 Family Dwellings (A B C & D)
Number
Average Value
Number
Average Value
Number
Average Value
Number
Average Value
Number
Average Value
LOANS ORIGINATED
21
$59,315
4
$32,368
13
$26,673
6
$11,905
3
$40,180
APPLICATIONS APPROVED, NOT ACCEPTED
0
$0
0
$0
3
$50,103
0
$0
0
$0
APPLICATIONS DENIED
1
$58,040
1
$58,040
4
$42,785
3
$12,400
0
$0
APPLICATIONS WITHDRAWN
0
$0
0
$0
3
$39,687
0
$0
0
$0
FILES CLOSED FOR INCOMPLETENESS
0
$0
0
$0
0
$0
0
$0
0
$0
Aggregated Statistics For Year 1999 (Based on 1 partial tract)
A) FHA, FSA/RHS & VA Home Purchase Loans
B) Conventional Home Purchase Loans
C) Refinancings
D) Home Improvement Loans
F) Non-occupant Loans on < 5 Family Dwellings (A B C & D)
Detailed PMIC statistics for the following Tracts:0118.00
2002 - 2018 National Fire Incident Reporting System (NFIRS) incidents
According to the data from the years 2002 - 2018 the average number of fires per year is 8. The highest number of fires - 18 took place in 2012, and the least - 0 in 2008. The data has a declining trend.
When looking into fire subcategories, the most incidents belonged to: Outside Fires (54.5%), and Structure Fires (25.0%).
Fire incident types reported to NFIRS in Zip Code 58267


 Nearest zip codes: 58240, 58251, 58214, 58277, 58274, 58228.


 According to the data from the years 2002 - 2018 the average number of fires per year is 8. The highest number of fires - 18 took place in 2012, and the least - 0 in 2008. The data has a declining trend.
 When looking into fire subcategories, the most incidents belonged to: Outside Fires (54.5%), and Structure Fires (25.0%).