Estimated zip code population in 2022: 38,790 Zip code population in 2010: 37,475 Zip code population in 2000: 37,732
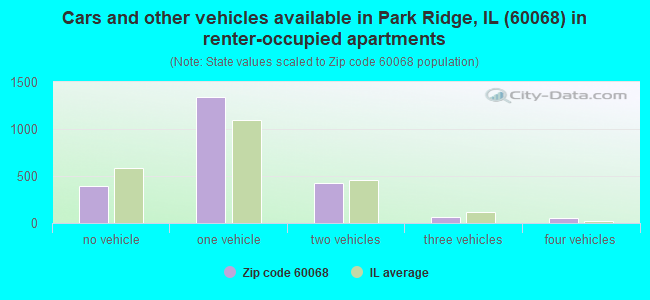
Houses and condos: 16,250 Renter-occupied apartments: 2,284
% of renters here:
15%
State:
33%
March 2022 cost of living index in zip code 60068: 102.0 (near average, U.S. average is 100)
Land area: 7.1 sq. mi. Water area: 0.0 sq. mi.
Population density: 5,468 people per square mile
(average).
OSM Map
General Map
Google Map
MSN Map
OSM Map
General Map
Google Map
MSN Map
OSM Map
General Map
Google Map
MSN Map
OSM Map
General Map
Google Map
MSN Map
Please wait while loading the map...
Real estate property taxes paid for housing units in 2022:
This zip code:
1.8% ($9,718)
Illinois:
2.0% ($4,912)
Median real estate property taxes paid for housing units with mortgages in 2022: $9,569 (1.6%) Median real estate property taxes paid for housing units with no mortgage in 2022: $9,396 (1.9%)
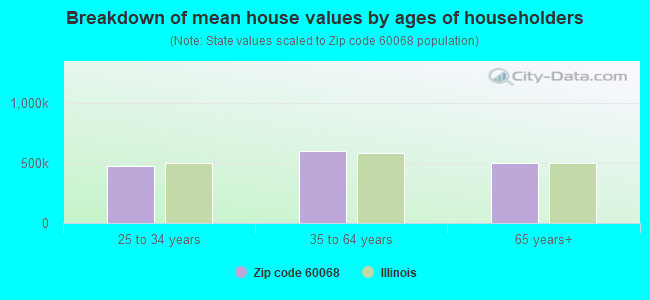
Estimated median house/condo value in 2022: $546,343
60068:
$546,343
Illinois:
$251,600
According to our research of Illinois and other state lists, there were 11 registered sex offenders living in 60068 zip code as of April 24, 2024. The ratio of all residents to sex offenders in zip code 60068 is 3,464 to 1. The ratio of registered sex offenders to all residents in this zip code is much lower than the state average.
Median resident age:
This zip code:
45.6 years
Illinois median age:
39.1 years
Average household size:
This zip code:
2.5 people
Illinois:
2.4 people
Averages for the 2020 tax year for zip code 60068, filed in 2021:
Average Adjusted Gross Income (AGI) in 2020: $158,310 (Individual Income Tax Returns)
Here:
$158,310
State:
$82,626
Salary/wage: $124,521 (reported on 76.6% of returns)
Here:
$124,521
State:
$66,640
(% of AGI for various income ranges: 1126.6% for AGIs below $25k, 3585.7% for AGIs $25k-50k, 6459.7% for AGIs $50k-75k, 9185.7% for AGIs $75k-100k, 18862.2% for AGIs $100k-200k, 96876.0% for AGIs over 200k)
Taxable interest for individuals: $3,144 (reported on 51.0% of returns)
This zip code:
$3,144
Illinois:
$2,376
(% of AGI for various income ranges: 59.1% for AGIs below $25k, 91.8% for AGIs $25k-50k, 130.0% for AGIs $50k-75k, 176.5% for AGIs $75k-100k, 330.1% for AGIs $100k-200k, 1429.6% for AGIs over 200k)
Ordinary dividends: $12,499 (reported on 45.9% of returns)
Here:
$12,499
State:
$9,061
(% of AGI for various income ranges: 99.5% for AGIs below $25k, 188.2% for AGIs $25k-50k, 315.2% for AGIs $50k-75k, 630.6% for AGIs $75k-100k, 936.3% for AGIs $100k-200k, 6184.5% for AGIs over 200k)
Net capital gain/loss in AGI: +$43,473 (reported on 41.3% of returns)
Here:
+$43,473
State:
+$31,684
(% of AGI for various income ranges: 71.3% for AGIs below $25k, 112.3% for AGIs $25k-50k, 236.2% for AGIs $50k-75k, 397.3% for AGIs $75k-100k, 977.0% for AGIs $100k-200k, 26386.1% for AGIs over 200k)
Profit/loss from business: +$22,604 (reported on 18.2% of returns)
Here:
+$22,604
State:
+$12,175
(% of AGI for various income ranges: 220.3% for AGIs below $25k, 322.2% for AGIs $25k-50k, 338.3% for AGIs $50k-75k, 441.4% for AGIs $75k-100k, 716.8% for AGIs $100k-200k, 3659.9% for AGIs over 200k)
Taxable individual retirement arrangement distribution: $27,505 (reported on 15.1% of returns)
60068:
$27,505
Illinois:
$21,613
(% of AGI for various income ranges: 122.2% for AGIs below $25k, 262.7% for AGIs $25k-50k, 431.2% for AGIs $50k-75k, 834.1% for AGIs $75k-100k, 1259.9% for AGIs $100k-200k, 2539.4% for AGIs over 200k)
Self-employed (Keogh) retirement plans: $30,605 (reported on 1.9% of returns)
60068:
$30,605
Illinois:
$30,962
(% of AGI for various income ranges: 9.4% for AGIs $25k-50k, 21.9% for AGIs $75k-100k, 41.1% for AGIs $100k-200k, 843.4% for AGIs over 200k)
Total itemized deductions: $39,865 (reported on 21.1% of returns)
Here:
$39,865
State:
$34,948
(% of AGI for various income ranges: 221.1% for AGIs below $25k, 433.8% for AGIs $25k-50k, 639.3% for AGIs $50k-75k, 1027.9% for AGIs $75k-100k, 1560.6% for AGIs $100k-200k, 8058.2% for AGIs over 200k)
Charity contributions: $13,995 (reported on 18.0% of returns)
Here:
$13,995
State:
$13,122
(% of AGI for various income ranges: 11.0% for AGIs below $25k, 34.9% for AGIs $25k-50k, 60.6% for AGIs $50k-75k, 145.4% for AGIs $75k-100k, 247.5% for AGIs $100k-200k, 3366.3% for AGIs over 200k)
Taxes paid: $9,319 (reported on 21.0% of returns)
60068:
$9,319
State:
$8,563
(% of AGI for various income ranges: 49.3% for AGIs below $25k, 108.5% for AGIs $25k-50k, 191.7% for AGIs $50k-75k, 330.1% for AGIs $75k-100k, 475.1% for AGIs $100k-200k, 1531.8% for AGIs over 200k)
Earned income credit: $1,673 (reported on 5.2% of returns)
Here:
$1,673
State:
$2,311
(% of AGI for various income ranges: 43.2% for AGIs below $25k, 36.8% for AGIs $25k-50k)
Percentage of individuals using paid preparers for their 2020 taxes: 89.5%
Here:
90%
State:
93%
(% for various income ranges: 86.2% for AGIs below $25k, 89.1% for AGIs $25k-50k, 89.8% for AGIs $50k-75k, 88.9% for AGIs $75k-100k, 90.3% for AGIs $100k-200k, 93.2% for AGIs over 200k)
Averages for the 2012 tax year for zip code 60068, filed in 2013:
Average Adjusted Gross Income (AGI) in 2012: $133,431 (Individual Income Tax Returns)
Here:
$133,431
State:
$68,058
Salary/wage: $91,140 (reported on 77.0% of returns)
Here:
$91,140
State:
$55,396
(% of AGI for various income ranges: 62.4% for AGIs below $25k, 68.5% for AGIs $25k-50k, 64.9% for AGIs $50k-75k, 62.3% for AGIs $75k-100k, 70.5% for AGIs $100k-200k, 42.6% for AGIs over 200k)
Taxable interest for individuals: $2,474 (reported on 54.9% of returns)
This zip code:
$2,474
Illinois:
$1,969
(% of AGI for various income ranges: 3.3% for AGIs below $25k, 1.8% for AGIs $25k-50k, 1.6% for AGIs $50k-75k, 1.8% for AGIs $75k-100k, 1.1% for AGIs $100k-200k, 0.7% for AGIs over 200k)
Ordinary dividends: $10,158 (reported on 45.2% of returns)
Here:
$10,158
State:
$7,786
(% of AGI for various income ranges: 6.0% for AGIs below $25k, 3.3% for AGIs $25k-50k, 4.1% for AGIs $50k-75k, 4.2% for AGIs $75k-100k, 3.4% for AGIs $100k-200k, 3.3% for AGIs over 200k)
Net capital gain/loss in AGI: +$21,931 (reported on 37.7% of returns)
Here:
+$21,931
State:
+$22,183
(% of AGI for various income ranges: 0.4% for AGIs below $25k, 0.9% for AGIs $25k-50k, 0.8% for AGIs $50k-75k, 1.8% for AGIs $75k-100k, 2.0% for AGIs $100k-200k, 9.2% for AGIs over 200k)
Profit/loss from business: +$23,055 (reported on 17.2% of returns)
Here:
+$23,055
State:
+$12,903
(% of AGI for various income ranges: 11.4% for AGIs below $25k, 5.5% for AGIs $25k-50k, 3.2% for AGIs $50k-75k, 2.9% for AGIs $75k-100k, 3.5% for AGIs $100k-200k, 2.3% for AGIs over 200k)
Taxable individual retirement arrangement distribution: $25,110 (reported on 18.1% of returns)
60068:
$25,110
Illinois:
$17,929
(% of AGI for various income ranges: 7.4% for AGIs below $25k, 5.4% for AGIs $25k-50k, 5.6% for AGIs $50k-75k, 6.3% for AGIs $75k-100k, 4.5% for AGIs $100k-200k, 2.2% for AGIs over 200k)
Self-employment retirement plans: $26,966 (reported on 2.0% of returns)
60068:
$26,966
Illinois:
$24,666
(% of AGI for various income ranges: 0.2% for AGIs $25k-50k, 0.2% for AGIs $75k-100k, 0.3% for AGIs $100k-200k, 0.5% for AGIs over 200k)
Total itemized deductions: $33,690 (16% of AGI, reported on 55.7% of returns)
Here:
$33,690
State:
$26,433
Here:
15.6% of AGI
State:
19.2% of AGI
(% of AGI for various income ranges: 28.2% for AGIs below $25k, 19.9% for AGIs $25k-50k, 21.3% for AGIs $50k-75k, 20.8% for AGIs $75k-100k, 19.5% for AGIs $100k-200k, 9.9% for AGIs over 200k)
Charity contributions: $4,147 (reported on 49.2% of returns)
Here:
$4,147
State:
$4,525
(% of AGI for various income ranges: 1.4% for AGIs below $25k, 1.4% for AGIs $25k-50k, 1.8% for AGIs $50k-75k, 2.1% for AGIs $75k-100k, 1.9% for AGIs $100k-200k, 1.3% for AGIs over 200k)
Taxes paid: $17,697 (reported on 55.4% of returns)
60068:
$17,697
State:
$11,968
(% of AGI for various income ranges: 10.4% for AGIs below $25k, 8.4% for AGIs $25k-50k, 10.0% for AGIs $50k-75k, 10.2% for AGIs $75k-100k, 10.0% for AGIs $100k-200k, 5.7% for AGIs over 200k)
Earned income credit: $1,645 (reported on 6.0% of returns)
Here:
$1,645
State:
$2,349
(% of AGI for various income ranges: 2.4% for AGIs below $25k, 0.5% for AGIs $25k-50k)
Percentage of individuals using paid preparers for their 2012 taxes: 61.8%
Here:
62%
State:
57%
(% for various income ranges: 56.2% for AGIs below $25k, 58.7% for AGIs $25k-50k, 65.8% for AGIs $50k-75k, 64.8% for AGIs $75k-100k, 62.6% for AGIs $100k-200k, 71.6% for AGIs over 200k)
Averages for the 2004 tax year for zip code 60068, filed in 2005:
Average Adjusted Gross Income (AGI) in 2004: $90,972 (Individual Income Tax Returns)
Here:
$90,972
State:
$54,625
Salary/wage: $74,377 (reported on 74.3% of returns)
Here:
$74,377
State:
$46,811
(% of AGI for various income ranges: 53.6% for AGIs $10k-25k, 66.3% for AGIs $25k-50k, 63.9% for AGIs $50k-75k, 67.1% for AGIs $75k-100k, 57.9% for AGIs over 100k)
Taxable interest for individuals: $3,525 (reported on 72.6% of returns)
This zip code:
$3,525
Illinois:
$2,101
(% of AGI for various income ranges: 8.1% for AGIs $10k-25k, 4.1% for AGIs $25k-50k, 3.7% for AGIs $50k-75k, 3.2% for AGIs $75k-100k, 2.2% for AGIs over 100k)
Taxable dividends: $6,142 (reported on 53.6% of returns)
Here:
$6,142
State:
$4,306
(% of AGI for various income ranges: 6.7% for AGIs $10k-25k, 4.3% for AGIs $25k-50k, 3.8% for AGIs $50k-75k, 3.6% for AGIs $75k-100k, 3.3% for AGIs over 100k)
Net capital gain/loss: +$24,901 (reported on 43.6% of returns)
Here:
+$24,901
State:
+$17,321
(% of AGI for various income ranges: 0.2% for AGIs $10k-25k, 1.0% for AGIs $25k-50k, 1.4% for AGIs $50k-75k, 2.6% for AGIs $75k-100k, 15.7% for AGIs over 100k)
Profit/loss from business: +$19,870 (reported on 16.4% of returns)
Here:
+$19,870
State:
+$11,771
(% of AGI for various income ranges: 8.7% for AGIs $10k-25k, 5.5% for AGIs $25k-50k, 4.5% for AGIs $50k-75k, 4.0% for AGIs $75k-100k, 3.1% for AGIs over 100k)
IRA payment deduction: $3,640 (reported on 4.5% of returns)
60068:
$3,640
Illinois:
$3,087
(% of AGI for various income ranges: 0.4% for AGIs $10k-25k, 0.5% for AGIs $25k-50k, 0.4% for AGIs $50k-75k, 0.3% for AGIs $75k-100k, 0.1% for AGIs over 100k)
Self-employed pension: $19,297 (reported on 2.5% of returns)
Here:
$19,297
Illinois:
$16,965
(% of AGI for various income ranges: 0.2% for AGIs $25k-50k, 0.3% for AGIs $50k-75k, 0.3% for AGIs $75k-100k, 0.6% for AGIs over 100k)
Total itemized deductions: $24,958 (17% of AGI, reported on 54.6% of returns)
Here:
$24,958
State:
$20,239
Here:
17.4% of AGI
State:
19.5% of AGI
(% of AGI for various income ranges: 29.4% for AGIs $10k-25k, 20.6% for AGIs $25k-50k, 21.1% for AGIs $50k-75k, 19.6% for AGIs $75k-100k, 12.3% for AGIs over 100k)
Charity contributions deductions: $4,259 (3% of AGI, reported on 50.9% of returns)
Here:
$4,259
State:
$3,719
Here:
2.9% of AGI
State:
3.4% of AGI
(% of AGI for various income ranges: 2.3% for AGIs $10k-25k, 2.1% for AGIs $25k-50k, 2.4% for AGIs $50k-75k, 2.4% for AGIs $75k-100k, 2.4% for AGIs over 100k)
Total tax: $19,408 (reported on 80.7% of returns)
60068:
$19,408
State:
$9,882
(% of AGI for various income ranges: 4.8% for AGIs $10k-25k, 8.0% for AGIs $25k-50k, 9.5% for AGIs $50k-75k, 10.3% for AGIs $75k-100k, 20.2% for AGIs over 100k)
Earned income credit: $1,164 (reported on 3.8% of returns)
Here:
$1,164
State:
$1,788
Percentage of individuals using paid preparers for their 2004 taxes: 62.3%
Here:
62%
State:
61%
(% for various income ranges: 56.2% for AGIs below $10k, 60.2% for AGIs $10k-25k, 60.7% for AGIs $25k-50k, 66.2% for AGIs $50k-75k, 63.1% for AGIs $75k-100k, 67.1% for AGIs over 100k)
Likely homosexual households (counted as self-reported same-sex unmarried-partner households)
Lesbian couples: 0.0% of all households
Gay men: 0.1% of all households
Household received Food Stamps/SNAP in the past 12 months: 303 Household did not receive Food Stamps/SNAP in the past 12 months: 14,928
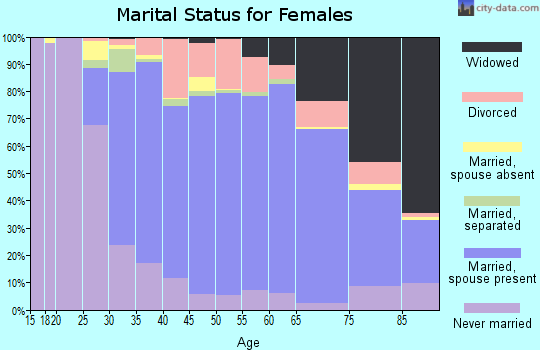
Women who had a birth in the past 12 months: 298 (289 now married, 7 unmarried) Women who did not have a birth in the past 12 months: 7,068 (3,634 now married, 3,402 unmarried)
Housing units in zip code 60068 with a mortgage: 7,536 (970 second mortgage, 134 home equity loan, 770 both second mortgage and home equity loan) Houses without a mortgage: 240
Median monthly owner costs for units with a mortgage: $3,024 Median monthly owner costs for units without a mortgage: $1,226
Residents with income below the poverty level in 2022:
This zip code:
4.5%
Whole state:
11.9%
Residents with income below 50% of the poverty level in 2022:
This zip code:
1.7%
Whole state:
5.7%
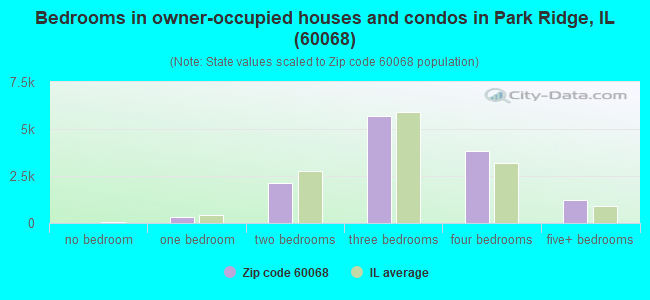
Median number of rooms in houses and condos:
Here:
7.2
State:
6.4
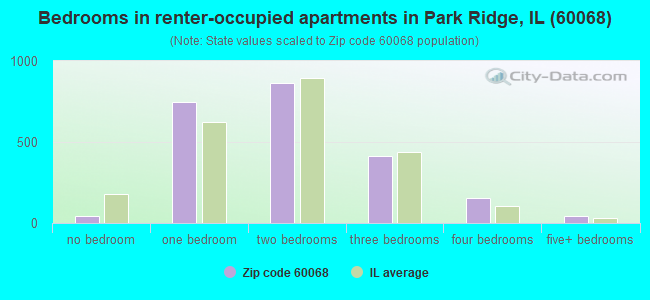
Median number of rooms in apartments:
Here:
4.0
State:
4.1
Notable locations in this zip code not listed on our city pages
Notable locations in zip code 60068: Park Ridge Country Club (A), Camp Fort Dearborn (B), Park Ridge Public Library (C), Park Ridge City Hall (D), Maine Township Town Hall (E), Edison Park Home (F), Park Ridge Fire Department Station 36 (G), Park Ridge Fire Department Station 35 (H). Display/hide their locations on the map
Churches in zip code 60068 include: First Baptist Church of Park Ridge (A), First Church of Christ Scientist (B), First United Methodist Church of Park Ridge (C), Good Shepherd United Methodist Church (D), Mary Seat of Wisdom Church (E), Messiah Lutheran Church (F), Midway Presbyterian Church (G), Park Ridge Community Church (H), Park Ridge Presbyterian Church (I). Display/hide their locations on the map
Parks in zip code 60068 include: North Park (1), Ni-Ridge Park (2), Centennial Park (3), Morgan Park (4), Woodland Park (5), Brickton Park (6), Hinkley Park (7), Hodges Park (8), Jaycee Park (9). Display/hide their locations on the map
7,407 married couples with children.
1,292 single-parent households (299 men, 993 women).
77.5% of residents of 60068 zip code speak English at home.
4.1% of residents speak Spanish at home (86% very well, 9% well, 4% not well, 2% not at all).
14.8% of residents speak other Indo-European language at home (74% very well, 19% well, 7% not well).
2.9% of residents speak Asian or Pacific Island language at home (69% very well, 16% well, 11% not well, 4% not at all).
0.9% of residents speak other language at home (58% very well, 30% well, 4% not well, 9% not at all).
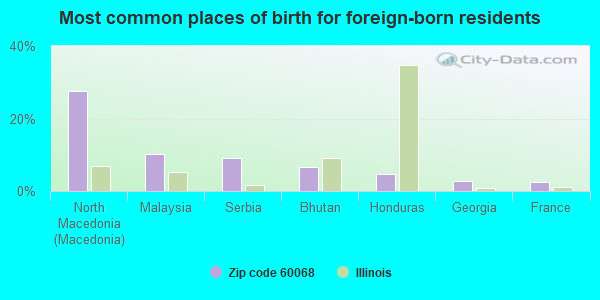
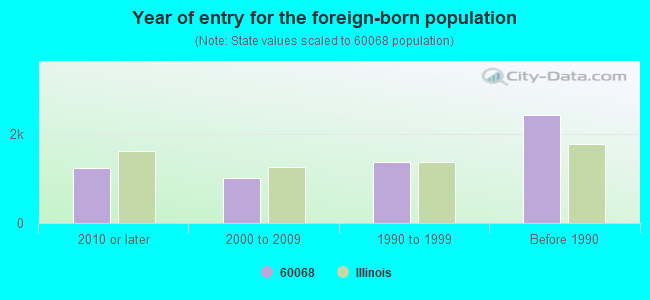
Foreign born population: 5,597 (14.4%) (80.2% of them are naturalized citizens)
Major facilities with environmental interests located in this zip code:
LUTHERAN GENERAL HOSPITAL (1775 DEMPSTER STREET in PARK RIDGE, IL)
STATE MASTER (Illinois EPA Project) - SOLID WASTE PROGRAM, HAZARDOUS WASTE PROGRAM, AIR PROGRAM STATE MASTER (Illinois EPA Project) - National Pollutant Discharge Elimination System Permit AIR SYNTHETIC MINOR (AIRS/AFS) CRITERIA AND HAZARDOUS AIR POLLUTANT INVENTORY (Inventory of air pollution sources) Large Quantity Generators, more that 1000 kg of hazardous waste/month (Resource Conservation and Recovery Act (tracking hazardous waste)) - notification Business SIC and NAICS classification: GENERAL MEDICAL AND SURGICAL HOSPITALS Organizations: LUTHERAN INSTITUTE OF HUMAN ECOLOGY (CONTACT/OWNER)
PARK RIDGE CSOS (505 BUTLER PLACE in PARK RIDGE, IL)
STATE MASTER (Illinois EPA Project) - DRINKING WATER PROGRAM STATE MASTER (Illinois EPA Project) - National Pollutant Discharge Elimination System Permit National Pollutant Discharge Elimination System NON-MAJOR (Tracking pollutant discharge elimination systems) - permit Business SIC classification: NONCLASSIFIABLE ESTABLISHMENTS Alternative names: PARK RIDGE CSOS, CITY OF
MAINE TWP H S EAST (2601 W DEMPSTER ST in PARK RIDGE, IL)
STATE MASTER (Illinois EPA Project) - HAZARDOUS WASTE PROGRAM, AIR PROGRAM, SOLID WASTE PROGRAM AIR MINOR (AIRS/AFS) CRITERIA AND HAZARDOUS AIR POLLUTANT INVENTORY (Inventory of air pollution sources) Conditionally Exempt Small Quantity Generators, less than 100 kg/month of hazardous waste (Resource Conservation and Recovery Act (tracking hazardous waste)) - notification Business SIC classification: ELEMENTARY AND SECONDARY SCHOOLS Organizations: MAINE TWP HS DIST 207 (CONTACT/OWNER)
Alternative names: MAINE EAST HIGH SCHOOL, MAINE TOWNSHIP HIGH SCHOOL DISTRICT 207, MAINE TOWNSHIP HS EAST, WORLD WATER CONSULTANTS
MURRAY CLEANERS INC (1335 DEMPSTER ST in PARK RIDGE, IL)
STATE MASTER (Illinois EPA Project) - HAZARDOUS WASTE PROGRAM, AIR PROGRAM AIR MINOR (AIRS/AFS) Small Quantity Generators, between 100 kg and 1000 kg of hazardous waste/month (Resource Conservation and Recovery Act (tracking hazardous waste)) - notification Business SIC classification: DRYCLEANING PLANTS, EXCEPT RUG CLEANING
LINCOLN MIDDLE SCHOOL (200 S LINCOLN AVE in PARK RIDGE, IL)
(National Center for Education Statistics) - STATE ID-1401606401007 Small Quantity Generators, between 100 kg and 1000 kg of hazardous waste/month (Resource Conservation and Recovery Act (tracking hazardous waste)) - notification (Resource Conservation and Recovery Act (tracking hazardous waste)) Organizations: PARK RIDGE CUSD #64 (CONTACT/OWNER)
, PARK RIDGE CCSD #64 (CONTACT/OWNER)
, PARK RIDGE C C SCHOOL DIST 64 (SCHOOL DISTRICT)
HOLT CLEANERS (26 S FAIRVIEW AVE in PARK RIDGE, IL)
STATE MASTER (Illinois EPA Project) - HAZARDOUS WASTE PROGRAM, AIR PROGRAM AIR MINOR (AIRS/AFS) CRITERIA AND HAZARDOUS AIR POLLUTANT INVENTORY (Inventory of air pollution sources) Small Quantity Generators, between 100 kg and 1000 kg of hazardous waste/month (Resource Conservation and Recovery Act (tracking hazardous waste)) - notification Business SIC classification: DRYCLEANING PLANTS, EXCEPT RUG CLEANING Organizations: KONTOS CHRIS (CONTACT/OWNER)
KINGS GARD CLEANERS (668 NORTHWEST HWY in PARK RIDGE, IL)
STATE MASTER (Illinois EPA Project) - HAZARDOUS WASTE PROGRAM, AIR PROGRAM AIR MINOR (AIRS/AFS) Small Quantity Generators, between 100 kg and 1000 kg of hazardous waste/month (Resource Conservation and Recovery Act (tracking hazardous waste)) - notification Business SIC classification: POWER LAUNDRIES, FAMILY AND COMMERCIAL Organizations: KINGSGARD CLEANERS (CONTACT/OWNER)
Alternative names: KINGSGARD CLEANERS, WON K LEE
NICOR GAS (BUSSE HWY AND ROWE AVENUE in PARK RIDGE, IL)
STATE MASTER (Illinois EPA Project) - AIR PROGRAM AIR MINOR (AIRS/AFS) CRITERIA AND HAZARDOUS AIR POLLUTANT INVENTORY (Inventory of air pollution sources) Business SIC and NAICS classification: NATURAL GAS DISTRIBUTION
ILLINOIS BELL TELEPHONE CO (32 S FAIRVIEW AVE in PARK RIDGE, IL)
STATE MASTER (Illinois EPA Project) - AIR PROGRAM AIR MINOR (AIRS/AFS) CRITERIA AND HAZARDOUS AIR POLLUTANT INVENTORY (Inventory of air pollution sources) Business SIC classification: TELEPHONE COMMUNICATIONS, EXCEPT RADIOTELEPHONE
ILLINOIS TOLLWAY (TOUHY AVE AND TRI-STATE in PARK RIDGE, IL)
STATE MASTER (Illinois EPA Project) - HAZARDOUS WASTE PROGRAM, AIR PROGRAM, SOLID WASTE PROGRAM AIR MINOR (AIRS/AFS) CRITERIA AND HAZARDOUS AIR POLLUTANT INVENTORY (Inventory of air pollution sources) Business SIC classification: REGULATION AND ADMINISTRATION OF TRANSPORTATION PROGRAMS Alternative names: ILLINOIS STATE TOLL HIGHWAY AUTHORITY, ILLINOIS TOLLWAY - MAINTENANCE BLDG 3
DEWEST SHOPPING PLAZA (DEMPSTER AND GREENWOOD AVE in PARK RIDGE, IL)
STATE MASTER (Illinois EPA Project) - HAZARDOUS WASTE PROGRAM Large Quantity Generators, more that 1000 kg of hazardous waste/month (Resource Conservation and Recovery Act (tracking hazardous waste)) - notification Organizations: LASALLE NATL TR 54240 (CONTACT/OWNER)
MEDIDENTIC INC (460 S NORTHWEST HWY in PARK RIDGE, IL)
STATE MASTER (Illinois EPA Project) - AIR PROGRAM AIR MINOR (AIRS/AFS) CRITERIA AND HAZARDOUS AIR POLLUTANT INVENTORY (Inventory of air pollution sources) Business SIC classification: OPERATORS OF NONRESIDENTIAL BUILDINGS Alternative names: A THOMAS FRANK
Housing units lacking complete plumbing facilities: 1.2% Housing units lacking complete kitchen facilities: 1.7%
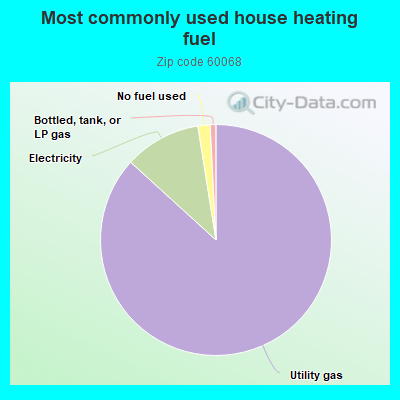
86.6%Utility gas
10.7%Electricity
1.7%No fuel used
0.8%Bottled, tank, or LP gas
Population in 1990: 37,450. Population change in the 1990s: +282 (+0.8%).
Place of birth for U.S.-born residents:
This state: 27,554
Northeast: 1,009
Midwest: 2,559
South: 837
West: 747
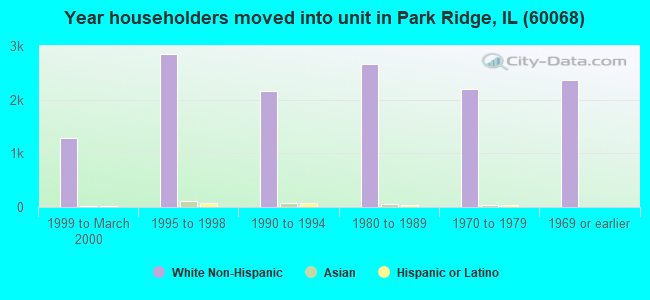
70% of the 60068 zip code residents lived in the same house 5 years ago. Out of people who lived in different houses, 87% lived in this county. Out of people who lived in different counties, 50% lived in Illinois.
93% of the 60068 zip code residents lived in the same house 1 year ago. Out of people who lived in different houses, 69% moved from this county. Out of people who lived in different houses, 10% moved from different county within same state. Out of people who lived in different houses, 16% moved from different state. Out of people who lived in different houses, 4% moved from abroad.
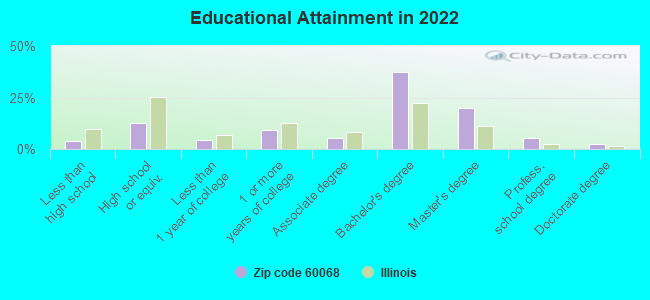
Private vs. public school enrollment:
Students in private schools in grades 1 to 8 (elementary and middle school): 785
Here:
19.2%
Illinois:
13.3%
Students in private schools in grades 9 to 12 (high school): 219
Here:
10.2%
Illinois:
9.9%
Students in private undergraduate colleges: 259
Here:
23.6%
Illinois:
27.4%
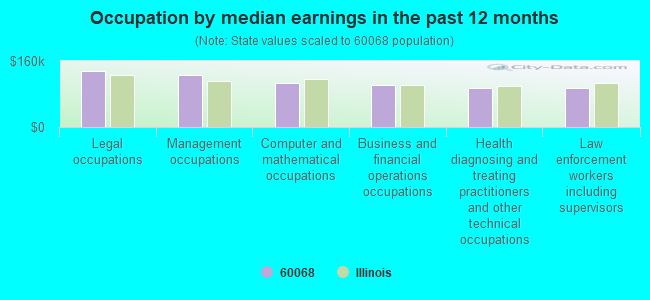
Occupation by median earnings in the past 12 months ($)
135,543Legal occupations
126,244Management occupations
106,117Computer and mathematical occupations
102,224Business and financial operations occupations
95,001Health diagnosing and treating practitioners and other technical occupations
94,553Law enforcement workers including supervisors
Companies with federal contracts located in this zip code (PARK RIDGE, IL):
DENTISTRY FOR CHILDREN (101 S WASHINGTON AVE # 114; small business) : $140,602 in 7 contractsfrom 1999 to 2004
Contracts for Expert Witness, Guard Services, Other Professional Services, Pathology Services, and moreby Army, Navy Signed by year:2000: $50,400; 2001: $0; 2002: $0; 2003: $11,000; 2004: $28,802; 2005: $0; 2006: $0.
Biggest contracts:
$50,400 with Army for Expert Witness. Signed on 2000-12-28. Completion date: 2001-09-30.
$50,400 with Army for Guard Services. Signed on 1999-12-21. Completion date: 1999-12-21.
$28,800 with Navy for Other Professional Services. Taking place in HI. Signed on 2004-11-19. Completion date: 2005-10-31.
$11,000 with Army for Pathology Services. Taking place in HI. Signed on 2003-07-16. Completion date: 2003-09-30.
AMERICAN ASSOCIATION OF NURSE (222 S PROSPECT AVENUE) : $138,858 in 29 contractsfrom 2002 to 2006
Contracts for Military Personnel Recruitment, Signs, Advertising Displays, and Identification Plates, Miscellaneous Items, Tuition, Registration, and Membership Fees, and moreby Army, Uniformed Services University of the Health Sciences, Navy, Department of Veterans Affairs, and others Signed by year:2000: $0; 2001: $0; 2002: $11,814; 2003: $31,298; 2004: $29,878; 2005: $42,154; 2006: $23,714.
Biggest contracts:
$12,000 with Army for Military Personnel Recruitment. Signed on 2005-05-05. Completion date: 2005-08-08.
$12,000 with Army for Signs, Advertising Displays, and Identification Plates. Signed on 2004-07-26. Completion date: 2004-08-09.
$12,000 with Army for Miscellaneous Items. Taking place in MA. Signed on 2003-07-17. Completion date: 2003-08-04.
$12,000 with Army for Military Personnel Recruitment. Taking place in OH. Signed on 2006-03-02. Completion date: 2006-08-07.
M&S TECHNOLOGIES INC (201 W CUTTRISS ST; small business) : $122,670 in 3 contractsfrom 2004 to 2006
$89,930 with Department of Veterans Affairs for Medical and Surgical Instruments, Equipment, and Supplies. Signed on 2006-06-20. Completion date: 2006-07-20.
$29,215 with Army for Ophthalmic Instruments, Equipment, and Supplies. Signed on 2004-09-30. Completion date: 2004-10-29.
$3,525 with Defense Logistics Agency for Medical and Surgical Instruments, Equipment, and Supplies. Signed on 2006-06-21. Completion date: 2006-07-20.
$11,966 with Animal and Plant Health Inspection Service for Lease or Rental of Facilities -- Office Buildings. Signed on 2002-11-15. Completion date: 2007-10-15.
PARK RIDGE PAINT GLASS AND WALLPAPER (737 WEST DEVON AVENUE)
$7,368 with Bureau of Immigration and Customs Enforcement for . Signed on 2005-09-19. Completion date: 2005-10-19.
Top industries in this zip code by the number of employees in 2005:
Health Care and Social Assistance: Medical Laboratories (over 1000 employees: 1 establishment, 20-49 employees: 1 establishment, 5-9 employees: 1 establishment, 1-4 employees: 2 establishments)
Administrative and Support and Waste Management and Remediation Services: Collection Agencies (over 1000: 1, 10-19: 2, 5-9: 1, 1-4: 2)
Health Care and Social Assistance: General Medical and Surgical Hospitals (over 1000: 1)
Health Care and Social Assistance: Offices of Physicians (except Mental Health Specialists) (100-249: 1, 50-99: 4, 20-49: 11, 10-19: 21, 5-9: 13, 1-4: 24)
Professional, Scientific, and Technical Services: Administrative Management and General Management Consulting Services (500-999: 1, 5-9: 2, 1-4: 25)
Health Care and Social Assistance: Home Health Care Services (100-249: 4, 1-4: 4)
Administrative and Support and Waste Management and Remediation Services: Temporary Help Services (250-499: 1, 100-249: 1, 20-49: 2, 5-9: 1, 1-4: 1)
Health Care and Social Assistance: Nursing Care Facilities (250-499: 1, 100-249: 1, 20-49: 2, 1-4: 3)
Health Care and Social Assistance: Offices of Dentists (20-49: 1, 10-19: 12, 5-9: 25, 1-4: 22)
People in group quarters in 2010:
399 people in nursing facilities/skilled-nursing facilities
45 people in group homes intended for adults
35 people in residential treatment centers for juveniles (non-correctional)
11 people in other noninstitutional facilities
2 people in emergency and transitional shelters (with sleeping facilities) for people experiencing homelessness
People in group quarters in 2000:
493 people in nursing homes
65 people in homes for the mentally retarded
59 people in other noninstitutional group quarters
37 people in other group homes
4 people in religious group quarters
3 people in college dormitories (includes college quarters off campus)
3 people in homes for the physically handicapped
2 people in other nonhousehold living situations
Fatal accident statistics in 2014:
Fatal accident count: 1
Vehicles involved in fatal accidents: 1
Fatal accidents caused by drunken drivers: 0
Fatalities: 1
Persons involved in fatal accidents: 1
Pedestrians involved in fatal accidents: 1
Fatal accident statistics in 2013:
Fatal accident count: 3
Vehicles involved in fatal accidents: 5
Fatal accidents caused by drunken drivers: 0
Fatalities: 3
Persons involved in fatal accidents: 8
Pedestrians involved in fatal accidents: 1
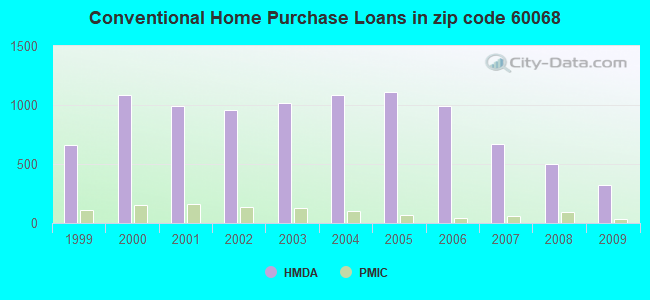
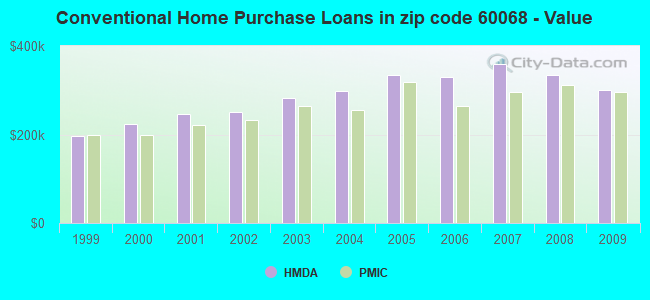
Home Mortgage Disclosure Act Aggregated Statistics For Year 2009 (Based on 9 full and 12 partial tracts)
A) FHA, FSA/RHS & VA Home Purchase Loans
B) Conventional Home Purchase Loans
C) Refinancings
D) Home Improvement Loans
E) Loans on Dwellings For 5+ Families
F) Non-occupant Loans on < 5 Family Dwellings (A B C & D)
G) Loans On Manufactured Home Dwelling (A B C & D)
Number
Average Value
Number
Average Value
Number
Average Value
Number
Average Value
Number
Average Value
Number
Average Value
Number
Average Value
LOANS ORIGINATED
66
$294,642
323
$300,359
2,145
$299,522
42
$199,934
3
$398,133
58
$258,966
1
$193,580
APPLICATIONS APPROVED, NOT ACCEPTED
5
$255,310
26
$406,488
209
$318,189
4
$15,260
0
$0
11
$434,315
0
$0
APPLICATIONS DENIED
20
$284,443
68
$320,983
435
$341,068
18
$225,624
1
$5,971,920
17
$238,035
0
$0
APPLICATIONS WITHDRAWN
12
$298,764
21
$301,412
232
$311,710
1
$189,780
1
$330,170
9
$308,084
0
$0
FILES CLOSED FOR INCOMPLETENESS
5
$302,426
2
$135,100
81
$331,010
3
$320,000
0
$0
0
$0
0
$0
Aggregated Statistics For Year 2008 (Based on 9 full and 12 partial tracts)
A) FHA, FSA/RHS & VA Home Purchase Loans
B) Conventional Home Purchase Loans
C) Refinancings
D) Home Improvement Loans
E) Loans on Dwellings For 5+ Families
F) Non-occupant Loans on < 5 Family Dwellings (A B C & D)
G) Loans On Manufactured Home Dwelling (A B C & D)
Number
Average Value
Number
Average Value
Number
Average Value
Number
Average Value
Number
Average Value
Number
Average Value
Number
Average Value
LOANS ORIGINATED
25
$319,574
498
$334,963
1,104
$329,713
68
$208,516
3
$992,650
100
$308,844
0
$0
APPLICATIONS APPROVED, NOT ACCEPTED
1
$264,030
55
$382,666
157
$364,696
14
$52,976
0
$0
19
$310,134
0
$0
APPLICATIONS DENIED
5
$323,042
114
$385,653
402
$395,103
43
$174,450
1
$2,445,980
27
$357,926
1
$5,180
APPLICATIONS WITHDRAWN
5
$275,472
69
$394,529
151
$353,177
11
$246,355
0
$0
10
$490,716
0
$0
FILES CLOSED FOR INCOMPLETENESS
1
$135,000
25
$358,772
84
$397,344
5
$186,464
0
$0
3
$191,183
0
$0
Aggregated Statistics For Year 2007 (Based on 9 full and 12 partial tracts)
A) FHA, FSA/RHS & VA Home Purchase Loans
B) Conventional Home Purchase Loans
C) Refinancings
D) Home Improvement Loans
E) Loans on Dwellings For 5+ Families
F) Non-occupant Loans on < 5 Family Dwellings (A B C & D)
G) Loans On Manufactured Home Dwelling (A B C & D)
Number
Average Value
Number
Average Value
Number
Average Value
Number
Average Value
Number
Average Value
Number
Average Value
Number
Average Value
LOANS ORIGINATED
1
$355,670
670
$358,661
1,298
$351,994
119
$211,125
3
$2,985,667
121
$291,869
0
$0
APPLICATIONS APPROVED, NOT ACCEPTED
0
$0
101
$425,681
181
$351,317
31
$121,982
0
$0
17
$188,565
0
$0
APPLICATIONS DENIED
0
$0
175
$441,732
439
$399,792
60
$142,755
0
$0
29
$437,819
1
$62,450
APPLICATIONS WITHDRAWN
0
$0
56
$437,985
169
$377,536
22
$334,107
0
$0
7
$542,984
0
$0
FILES CLOSED FOR INCOMPLETENESS
0
$0
24
$354,624
66
$385,696
1
$67,550
0
$0
4
$321,112
0
$0
Aggregated Statistics For Year 2006 (Based on 9 full and 12 partial tracts)
A) FHA, FSA/RHS & VA Home Purchase Loans
B) Conventional Home Purchase Loans
C) Refinancings
D) Home Improvement Loans
E) Loans on Dwellings For 5+ Families
F) Non-occupant Loans on < 5 Family Dwellings (A B C & D)
G) Loans On Manufactured Home Dwelling (A B C & D)
Number
Average Value
Number
Average Value
Number
Average Value
Number
Average Value
Number
Average Value
Number
Average Value
Number
Average Value
LOANS ORIGINATED
0
$0
990
$330,935
1,421
$345,257
138
$193,958
4
$1,630,340
156
$302,707
0
$0
APPLICATIONS APPROVED, NOT ACCEPTED
0
$0
112
$317,798
181
$319,250
37
$123,846
1
$2,646,240
19
$345,521
0
$0
APPLICATIONS DENIED
0
$0
208
$309,129
431
$364,935
72
$226,498
1
$2,860,800
28
$362,956
1
$22,240
APPLICATIONS WITHDRAWN
2
$175,750
78
$349,101
245
$356,831
29
$203,311
0
$0
23
$381,443
0
$0
FILES CLOSED FOR INCOMPLETENESS
0
$0
51
$337,350
82
$306,823
3
$96,330
0
$0
7
$435,813
0
$0
Aggregated Statistics For Year 2005 (Based on 9 full and 12 partial tracts)
A) FHA, FSA/RHS & VA Home Purchase Loans
B) Conventional Home Purchase Loans
C) Refinancings
D) Home Improvement Loans
E) Loans on Dwellings For 5+ Families
F) Non-occupant Loans on < 5 Family Dwellings (A B C & D)
G) Loans On Manufactured Home Dwelling (A B C & D)
Number
Average Value
Number
Average Value
Number
Average Value
Number
Average Value
Number
Average Value
Number
Average Value
Number
Average Value
LOANS ORIGINATED
3
$68,293
1,106
$334,038
1,544
$309,085
108
$208,042
11
$435,953
162
$307,399
0
$0
APPLICATIONS APPROVED, NOT ACCEPTED
0
$0
174
$325,105
216
$297,406
20
$80,614
1
$12,370
21
$307,973
0
$0
APPLICATIONS DENIED
0
$0
182
$314,686
397
$338,780
68
$115,179
2
$892,500
40
$254,969
1
$39,410
APPLICATIONS WITHDRAWN
0
$0
109
$337,348
348
$299,909
24
$174,540
2
$764,560
17
$341,284
0
$0
FILES CLOSED FOR INCOMPLETENESS
0
$0
26
$447,682
64
$384,118
8
$197,544
0
$0
3
$250,577
0
$0
Aggregated Statistics For Year 2004 (Based on 9 full and 12 partial tracts)
A) FHA, FSA/RHS & VA Home Purchase Loans
B) Conventional Home Purchase Loans
C) Refinancings
D) Home Improvement Loans
E) Loans on Dwellings For 5+ Families
F) Non-occupant Loans on < 5 Family Dwellings (A B C & D)
G) Loans On Manufactured Home Dwelling (A B C & D)
Number
Average Value
Number
Average Value
Number
Average Value
Number
Average Value
Number
Average Value
Number
Average Value
Number
Average Value
LOANS ORIGINATED
3
$192,110
1,088
$297,455
1,837
$276,779
111
$154,251
2
$391,420
123
$249,465
2
$50,330
APPLICATIONS APPROVED, NOT ACCEPTED
1
$168,850
137
$315,872
197
$291,912
17
$56,989
0
$0
11
$219,954
0
$0
APPLICATIONS DENIED
1
$142,700
129
$335,099
412
$281,783
64
$108,799
0
$0
28
$334,612
1
$18,890
APPLICATIONS WITHDRAWN
0
$0
63
$335,485
319
$279,365
14
$106,492
1
$155,240
10
$291,051
0
$0
FILES CLOSED FOR INCOMPLETENESS
0
$0
30
$332,896
123
$309,483
8
$271,848
0
$0
5
$334,060
0
$0
Aggregated Statistics For Year 2003 (Based on 9 full and 12 partial tracts)
A) FHA, FSA/RHS & VA Home Purchase Loans
B) Conventional Home Purchase Loans
C) Refinancings
D) Home Improvement Loans
E) Loans on Dwellings For 5+ Families
F) Non-occupant Loans on < 5 Family Dwellings (A B C & D)
Number
Average Value
Number
Average Value
Number
Average Value
Number
Average Value
Number
Average Value
Number
Average Value
LOANS ORIGINATED
7
$213,514
1,021
$281,916
5,350
$232,173
82
$112,763
16
$978,281
166
$212,568
APPLICATIONS APPROVED, NOT ACCEPTED
0
$0
96
$298,499
453
$230,251
18
$111,141
1
$739,380
11
$280,805
APPLICATIONS DENIED
0
$0
112
$312,717
600
$244,579
41
$49,474
0
$0
26
$310,268
APPLICATIONS WITHDRAWN
0
$0
69
$277,119
475
$236,491
5
$209,070
0
$0
16
$201,634
FILES CLOSED FOR INCOMPLETENESS
0
$0
18
$328,589
121
$313,444
4
$94,605
0
$0
6
$254,412
Aggregated Statistics For Year 2002 (Based on 9 full and 12 partial tracts)
A) FHA, FSA/RHS & VA Home Purchase Loans
B) Conventional Home Purchase Loans
C) Refinancings
D) Home Improvement Loans
E) Loans on Dwellings For 5+ Families
F) Non-occupant Loans on < 5 Family Dwellings (A B C & D)
Number
Average Value
Number
Average Value
Number
Average Value
Number
Average Value
Number
Average Value
Number
Average Value
LOANS ORIGINATED
11
$185,405
960
$250,628
3,795
$235,617
94
$78,848
13
$1,421,838
107
$215,184
APPLICATIONS APPROVED, NOT ACCEPTED
1
$320,750
95
$254,675
334
$212,080
26
$64,201
0
$0
7
$187,071
APPLICATIONS DENIED
3
$179,520
69
$234,209
339
$231,736
38
$53,447
0
$0
19
$227,869
APPLICATIONS WITHDRAWN
1
$110,080
47
$264,444
334
$243,679
5
$94,648
0
$0
7
$185,124
FILES CLOSED FOR INCOMPLETENESS
0
$0
15
$333,580
144
$244,757
4
$50,058
0
$0
8
$154,466
Aggregated Statistics For Year 2001 (Based on 9 full and 12 partial tracts)
A) FHA, FSA/RHS & VA Home Purchase Loans
B) Conventional Home Purchase Loans
C) Refinancings
D) Home Improvement Loans
E) Loans on Dwellings For 5+ Families
F) Non-occupant Loans on < 5 Family Dwellings (A B C & D)
Number
Average Value
Number
Average Value
Number
Average Value
Number
Average Value
Number
Average Value
Number
Average Value
LOANS ORIGINATED
12
$210,529
993
$246,169
2,909
$223,473
139
$69,829
8
$858,870
76
$191,568
APPLICATIONS APPROVED, NOT ACCEPTED
2
$244,655
55
$236,388
285
$201,300
41
$48,441
1
$1,313,000
12
$223,981
APPLICATIONS DENIED
2
$150,925
64
$198,315
315
$220,239
53
$68,070
1
$522,670
20
$217,377
APPLICATIONS WITHDRAWN
3
$157,833
52
$264,254
195
$218,416
37
$47,896
0
$0
14
$184,370
FILES CLOSED FOR INCOMPLETENESS
0
$0
18
$280,964
95
$186,612
1
$260,000
0
$0
2
$181,015
Aggregated Statistics For Year 2000 (Based on 9 full and 12 partial tracts)
A) FHA, FSA/RHS & VA Home Purchase Loans
B) Conventional Home Purchase Loans
C) Refinancings
D) Home Improvement Loans
E) Loans on Dwellings For 5+ Families
F) Non-occupant Loans on < 5 Family Dwellings (A B C & D)
Number
Average Value
Number
Average Value
Number
Average Value
Number
Average Value
Number
Average Value
Number
Average Value
LOANS ORIGINATED
23
$173,758
1,082
$222,984
635
$186,926
172
$57,680
6
$1,039,695
70
$173,435
APPLICATIONS APPROVED, NOT ACCEPTED
2
$129,515
71
$197,528
110
$157,483
38
$44,716
0
$0
8
$197,976
APPLICATIONS DENIED
3
$179,490
83
$206,849
200
$171,220
41
$103,444
9
$518,484
8
$145,990
APPLICATIONS WITHDRAWN
1
$94,250
58
$238,146
150
$157,863
32
$63,761
0
$0
5
$92,838
FILES CLOSED FOR INCOMPLETENESS
0
$0
22
$258,082
57
$230,351
4
$49,902
0
$0
1
$176,630
Aggregated Statistics For Year 1999 (Based on 6 full and 6 partial tracts)
A) FHA, FSA/RHS & VA Home Purchase Loans
B) Conventional Home Purchase Loans
C) Refinancings
D) Home Improvement Loans
E) Loans on Dwellings For 5+ Families
F) Non-occupant Loans on < 5 Family Dwellings (A B C & D)
2002 - 2018 National Fire Incident Reporting System (NFIRS) incidents
Based on the data from the years 2002 - 2018 the average number of fire incidents per year is 56. The highest number of reported fire incidents - 94 took place in 2008, and the least - 19 in 2006. The data has a constant trend.
When looking into fire subcategories, the most incidents belonged to: Structure Fires (34.1%), and Outside Fires (33.3%).
Fire incident types reported to NFIRS in Zip Code 60068


 Nearest zip codes: 60631, 60714, 60656, 60706, 60176, 60053.


 Based on the data from the years 2002 - 2018 the average number of fire incidents per year is 56. The highest number of reported fire incidents - 94 took place in 2008, and the least - 19 in 2006. The data has a constant trend.
 When looking into fire subcategories, the most incidents belonged to: Structure Fires (34.1%), and Outside Fires (33.3%).