Estimated zip code population in 2022: 5,123 Zip code population in 2010: 6,353 Zip code population in 2000: 6,332
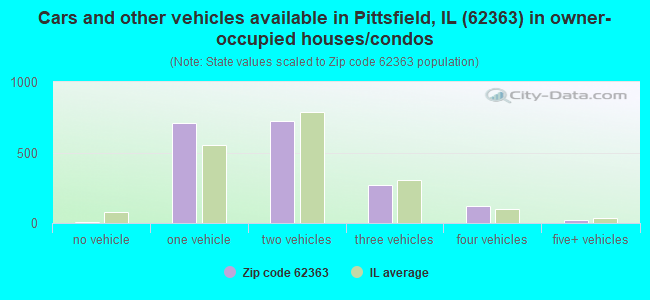
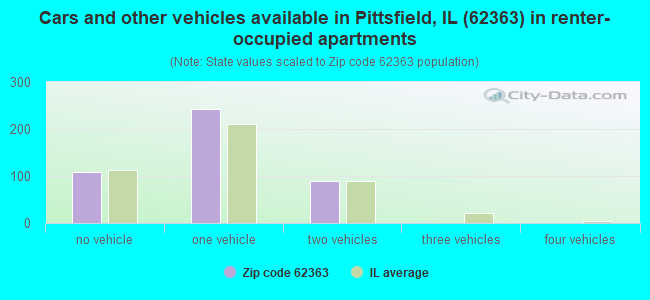
Houses and condos: 2,717 Renter-occupied apartments: 438
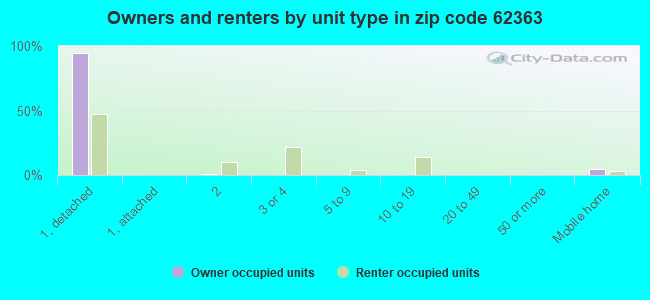
% of renters here:
19%
State:
33%
March 2022 cost of living index in zip code 62363: 74.9 (low, U.S. average is 100)
Land area: 158.0 sq. mi. Water area: 1.8 sq. mi.
Population density: 32 people per square mile
(very low).
OSM Map
General Map
Google Map
MSN Map
OSM Map
General Map
Google Map
MSN Map
OSM Map
General Map
Google Map
MSN Map
OSM Map
General Map
Google Map
MSN Map
Please wait while loading the map...
Real estate property taxes paid for housing units in 2022:
This zip code:
1.3% ($1,595)
Illinois:
2.0% ($4,912)
Median real estate property taxes paid for housing units with mortgages in 2022: $1,709 (1.6%) Median real estate property taxes paid for housing units with no mortgage in 2022: $1,506 (1.2%)
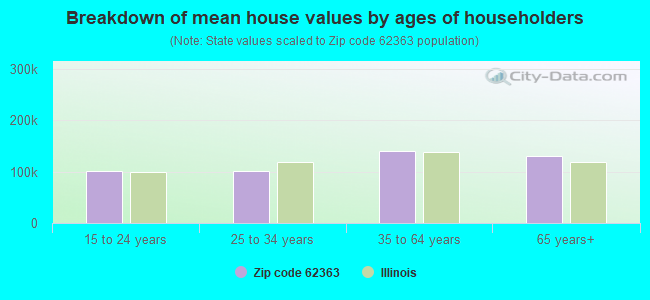
Estimated median house/condo value in 2022: $118,908
62363:
$118,908
Illinois:
$251,600
According to our research of Illinois and other state lists, there were 8 registered sex offenders living in 62363 zip code as of April 25, 2024. The ratio of all residents to sex offenders in zip code 62363 is 755 to 1. The ratio of registered sex offenders to all residents in this zip code is near the state average.
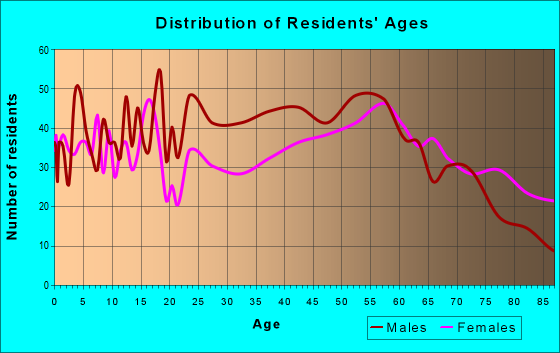
Median resident age:
This zip code:
49.6 years
Illinois median age:
39.1 years
Average household size:
This zip code:
2.1 people
Illinois:
2.4 people
Averages for the 2020 tax year for zip code 62363, filed in 2021:
Average Adjusted Gross Income (AGI) in 2020: $63,079 (Individual Income Tax Returns)
Here:
$63,079
State:
$82,626
Salary/wage: $47,034 (reported on 79.5% of returns)
Here:
$47,034
State:
$66,640
(% of AGI for various income ranges: 1231.8% for AGIs below $25k, 3539.0% for AGIs $25k-50k, 5752.5% for AGIs $50k-75k, 8613.0% for AGIs $75k-100k, 15502.5% for AGIs $100k-200k)
Taxable interest for individuals: $2,607 (reported on 39.4% of returns)
This zip code:
$2,607
Illinois:
$2,376
(% of AGI for various income ranges: 28.7% for AGIs below $25k, 51.2% for AGIs $25k-50k, 137.5% for AGIs $50k-75k, 126.0% for AGIs $75k-100k, 233.5% for AGIs $100k-200k)
Ordinary dividends: $3,851 (reported on 18.1% of returns)
Here:
$3,851
State:
$9,061
(% of AGI for various income ranges: 23.1% for AGIs below $25k, 15.9% for AGIs $25k-50k, 73.9% for AGIs $50k-75k, 138.0% for AGIs $75k-100k, 183.0% for AGIs $100k-200k)
Net capital gain/loss in AGI: +$13,073 (reported on 17.4% of returns)
Here:
+$13,073
State:
+$31,684
(% of AGI for various income ranges: 24.4% for AGIs below $25k, 9.4% for AGIs $25k-50k, 111.4% for AGIs $50k-75k, 148.5% for AGIs $75k-100k, 684.0% for AGIs $100k-200k)
Profit/loss from business: +$14,747 (reported on 14.7% of returns)
Here:
+$14,747
State:
+$12,175
(% of AGI for various income ranges: 117.8% for AGIs below $25k, 155.3% for AGIs $25k-50k, 162.5% for AGIs $50k-75k, 403.5% for AGIs $75k-100k, 801.5% for AGIs $100k-200k)
Taxable individual retirement arrangement distribution: $13,993 (reported on 10.8% of returns)
62363:
$13,993
Illinois:
$21,613
(% of AGI for various income ranges: 78.2% for AGIs below $25k, 90.0% for AGIs $25k-50k, 210.0% for AGIs $50k-75k, 270.0% for AGIs $75k-100k, 491.0% for AGIs $100k-200k)
Total itemized deductions: $29,889 (reported on 3.5% of returns)
Here:
$29,889
State:
$34,948
(% of AGI for various income ranges: 471.4% for AGIs $50k-75k, 685.0% for AGIs $100k-200k)
Charity contributions: $11,233 (reported on 2.3% of returns)
Here:
$11,233
State:
$13,122
(% of AGI for various income ranges: 71.1% for AGIs $50k-75k, 237.5% for AGIs $100k-200k)
Taxes paid: $6,133 (reported on 3.5% of returns)
62363:
$6,133
State:
$8,563
(% of AGI for various income ranges: 84.6% for AGIs $50k-75k, 157.5% for AGIs $100k-200k)
Earned income credit: $2,308 (reported on 15.1% of returns)
Here:
$2,308
State:
$2,311
(% of AGI for various income ranges: 92.7% for AGIs below $25k, 79.6% for AGIs $25k-50k)
Percentage of individuals using paid preparers for their 2020 taxes: 94.2%
Here:
94%
State:
93%
(% for various income ranges: 92.5% for AGIs below $25k, 95.2% for AGIs $25k-50k, 95.0% for AGIs $50k-75k, 96.7% for AGIs $75k-100k, 94.7% for AGIs $100k-200k, 87.5% for AGIs over 200k)
Averages for the 2012 tax year for zip code 62363, filed in 2013:
Average Adjusted Gross Income (AGI) in 2012: $53,338 (Individual Income Tax Returns)
Here:
$53,338
State:
$68,058
Salary/wage: $38,771 (reported on 81.6% of returns)
Here:
$38,771
State:
$55,396
(% of AGI for various income ranges: 70.5% for AGIs below $25k, 75.4% for AGIs $25k-50k, 69.7% for AGIs $50k-75k, 71.7% for AGIs $75k-100k, 60.1% for AGIs $100k-200k, 24.6% for AGIs over 200k)
Taxable interest for individuals: $1,912 (reported on 42.9% of returns)
This zip code:
$1,912
Illinois:
$1,969
(% of AGI for various income ranges: 2.7% for AGIs below $25k, 1.4% for AGIs $25k-50k, 1.4% for AGIs $50k-75k, 1.3% for AGIs $75k-100k, 1.7% for AGIs $100k-200k, 1.3% for AGIs over 200k)
Ordinary dividends: $3,573 (reported on 19.5% of returns)
Here:
$3,573
State:
$7,786
(% of AGI for various income ranges: 1.7% for AGIs below $25k, 0.6% for AGIs $25k-50k, 0.7% for AGIs $50k-75k, 1.3% for AGIs $75k-100k, 0.8% for AGIs $100k-200k, 2.6% for AGIs over 200k)
Net capital gain/loss in AGI: +$14,180 (reported on 15.3% of returns)
Here:
+$14,180
State:
+$22,183
(% of AGI for various income ranges: 0.4% for AGIs $25k-50k, 1.1% for AGIs $50k-75k, 1.0% for AGIs $75k-100k, 3.3% for AGIs $100k-200k, 13.9% for AGIs over 200k)
Profit/loss from business: +$10,558 (reported on 16.5% of returns)
Here:
+$10,558
State:
+$12,903
(% of AGI for various income ranges: 4.7% for AGIs below $25k, 3.7% for AGIs $25k-50k, 4.1% for AGIs $50k-75k, 2.2% for AGIs $75k-100k, 1.8% for AGIs $100k-200k, 3.6% for AGIs over 200k)
Taxable individual retirement arrangement distribution: $8,550 (reported on 11.5% of returns)
62363:
$8,550
Illinois:
$17,929
(% of AGI for various income ranges: 3.8% for AGIs below $25k, 2.0% for AGIs $25k-50k, 2.2% for AGIs $50k-75k, 2.8% for AGIs $75k-100k, 1.8% for AGIs $100k-200k)
Total itemized deductions: $18,962 (18% of AGI, reported on 22.2% of returns)
Here:
$18,962
State:
$26,433
Here:
17.6% of AGI
State:
19.2% of AGI
(% of AGI for various income ranges: 8.8% for AGIs below $25k, 7.7% for AGIs $25k-50k, 7.7% for AGIs $50k-75k, 8.3% for AGIs $75k-100k, 9.5% for AGIs $100k-200k, 6.2% for AGIs over 200k)
Charity contributions: $3,759 (reported on 15.7% of returns)
Here:
$3,759
State:
$4,525
(% of AGI for various income ranges: 0.7% for AGIs below $25k, 0.7% for AGIs $25k-50k, 1.1% for AGIs $50k-75k, 1.0% for AGIs $75k-100k, 1.6% for AGIs $100k-200k, 1.2% for AGIs over 200k)
Taxes paid: $7,088 (reported on 22.2% of returns)
62363:
$7,088
State:
$11,968
(% of AGI for various income ranges: 1.3% for AGIs below $25k, 1.8% for AGIs $25k-50k, 2.1% for AGIs $50k-75k, 3.0% for AGIs $75k-100k, 4.3% for AGIs $100k-200k, 4.0% for AGIs over 200k)
Earned income credit: $2,233 (reported on 17.6% of returns)
Here:
$2,233
State:
$2,349
(% of AGI for various income ranges: 6.2% for AGIs below $25k, 1.2% for AGIs $25k-50k)
Percentage of individuals using paid preparers for their 2012 taxes: 71.3%
Here:
71%
State:
57%
(% for various income ranges: 63.5% for AGIs below $25k, 73.0% for AGIs $25k-50k, 75.6% for AGIs $50k-75k, 76.9% for AGIs $75k-100k, 85.0% for AGIs $100k-200k, 85.7% for AGIs over 200k)
Averages for the 2004 tax year for zip code 62363, filed in 2005:
Average Adjusted Gross Income (AGI) in 2004: $37,788 (Individual Income Tax Returns)
Here:
$37,788
State:
$54,625
Salary/wage: $31,945 (reported on 79.7% of returns)
Here:
$31,945
State:
$46,811
(% of AGI for various income ranges: 93.7% for AGIs below $10k, 65.4% for AGIs $10k-25k, 76.2% for AGIs $25k-50k, 77.6% for AGIs $50k-75k, 69.7% for AGIs $75k-100k, 41.6% for AGIs over 100k)
Taxable interest for individuals: $2,494 (reported on 49.2% of returns)
This zip code:
$2,494
Illinois:
$2,101
(% of AGI for various income ranges: 7.9% for AGIs below $10k, 5.2% for AGIs $10k-25k, 2.6% for AGIs $25k-50k, 2.2% for AGIs $50k-75k, 3.2% for AGIs $75k-100k, 3.8% for AGIs over 100k)
Taxable dividends: $2,656 (reported on 24.0% of returns)
Here:
$2,656
State:
$4,306
(% of AGI for various income ranges: 2.4% for AGIs below $10k, 1.8% for AGIs $10k-25k, 1.2% for AGIs $25k-50k, 1.5% for AGIs $50k-75k, 1.3% for AGIs $75k-100k, 2.6% for AGIs over 100k)
Net capital gain/loss: +$8,769 (reported on 19.5% of returns)
Here:
+$8,769
State:
+$17,321
(% of AGI for various income ranges: -0.7% for AGIs below $10k, 0.9% for AGIs $10k-25k, 0.8% for AGIs $25k-50k, 2.0% for AGIs $50k-75k, 4.0% for AGIs $75k-100k, 14.3% for AGIs over 100k)
Profit/loss from business: +$7,486 (reported on 19.1% of returns)
Here:
+$7,486
State:
+$11,771
(% of AGI for various income ranges: -0.5% for AGIs below $10k, 5.2% for AGIs $10k-25k, 1.6% for AGIs $25k-50k, 3.4% for AGIs $50k-75k, 4.2% for AGIs $75k-100k, 6.3% for AGIs over 100k)
IRA payment deduction: $2,670 (reported on 3.6% of returns)
62363:
$2,670
Illinois:
$3,087
(% of AGI for various income ranges: 0.2% for AGIs $10k-25k, 0.2% for AGIs $25k-50k, 0.3% for AGIs $50k-75k, 0.6% for AGIs $75k-100k)
Total itemized deductions: $15,422 (22% of AGI, reported on 20.7% of returns)
Here:
$15,422
State:
$20,239
Here:
21.7% of AGI
State:
19.5% of AGI
(% of AGI for various income ranges: 16.7% for AGIs below $10k, 11.0% for AGIs $10k-25k, 7.4% for AGIs $25k-50k, 7.9% for AGIs $50k-75k, 10.7% for AGIs $75k-100k, 6.9% for AGIs over 100k)
Charity contributions deductions: $2,696 (3% of AGI, reported on 15.0% of returns)
Here:
$2,696
State:
$3,719
Here:
3.4% of AGI
State:
3.4% of AGI
(% of AGI for various income ranges: 0.7% for AGIs below $10k, 0.8% for AGIs $10k-25k, 0.8% for AGIs $25k-50k, 1.0% for AGIs $50k-75k, 1.5% for AGIs $75k-100k, 1.3% for AGIs over 100k)
Total tax: $5,340 (reported on 73.0% of returns)
62363:
$5,340
State:
$9,882
(% of AGI for various income ranges: 2.6% for AGIs below $10k, 4.0% for AGIs $10k-25k, 6.8% for AGIs $25k-50k, 8.3% for AGIs $50k-75k, 10.8% for AGIs $75k-100k, 20.1% for AGIs over 100k)
Earned income credit: $1,608 (reported on 13.4% of returns)
Here:
$1,608
State:
$1,788
Percentage of individuals using paid preparers for their 2004 taxes: 73.6%
Here:
74%
State:
61%
(% for various income ranges: 59.9% for AGIs below $10k, 73.8% for AGIs $10k-25k, 79.0% for AGIs $25k-50k, 79.3% for AGIs $50k-75k, 80.0% for AGIs $75k-100k, 88.2% for AGIs over 100k)
Likely homosexual households (counted as self-reported same-sex unmarried-partner households)
Lesbian couples: 0.5% of all households
Gay men: 0.0% of all households
Household received Food Stamps/SNAP in the past 12 months: 186 Household did not receive Food Stamps/SNAP in the past 12 months: 2,089
Women who had a birth in the past 12 months: 39 (39 now married, 0 unmarried) Women who did not have a birth in the past 12 months: 846 (390 now married, 453 unmarried)
Housing units in zip code 62363 with a mortgage: 962 (62 second mortgage, 4 home equity loan, 57 both second mortgage and home equity loan) Houses without a mortgage: 38
Median monthly owner costs for units with a mortgage: $974 Median monthly owner costs for units without a mortgage: $494
Residents with income below the poverty level in 2022:
This zip code:
8.9%
Whole state:
11.9%
Residents with income below 50% of the poverty level in 2022:
This zip code:
4.1%
Whole state:
5.7%
Median number of rooms in houses and condos:
Here:
6.4
State:
6.4
Median number of rooms in apartments:
Here:
4.2
State:
4.1
Notable locations in this zip code not listed on our city pages
Churches in zip code 62363 include: Calvary Baptist Church (A), Church of Christ (B), First Baptist Church (C), First Christian Church (D), Saint Marys Catholic Church (E). Display/hide their locations on the map
Cemeteries: Blue River Cemetery (1), Burbridge Cemetery (2), Daniels Cemetery (3), Douglas Cemetery (4), French Cemetery (5), Goodin Cemetery (6), Holford Cemetery (7). Display/hide their locations on the map
Lakes and reservoirs: Jack Ellis Lake (A), Columbia Farm Pond (B), Lake Pittsfield (C), Pine Lake (D), New Pittsfield Lake Number 1 (E). Display/hide their locations on the map
Creeks: Moore Creek (A), Buckeye Creek (B), Blue Creek (C), Bedford Creek (D), Needsmore Creek (E), McEvers Creek (F), Panther Creek (G). Display/hide their locations on the map
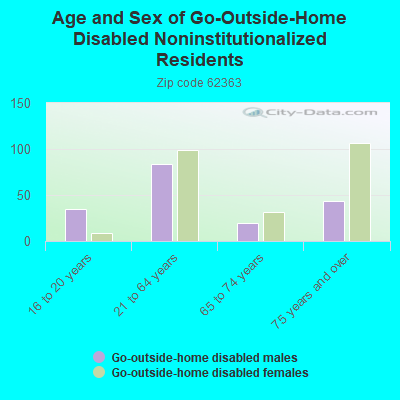
In group quarters: 295 (-1 institutionalized population)
Size of family households: 859 2-persons, 105 3-persons, 348 4-persons, 12 5-persons, 8 7-or-more-persons
Size of nonfamily households: 876 1-person, 99 2-persons
687 married couples with children.
231 single-parent households (43 men, 188 women).
96.8% of residents of 62363 zip code speak English at home.
1.9% of residents speak Spanish at home (71% very well, 7% well, 23% not well).
1.1% of residents speak other Indo-European language at home (100% very well).
0.3% of residents speak Asian or Pacific Island language at home (100% very well).
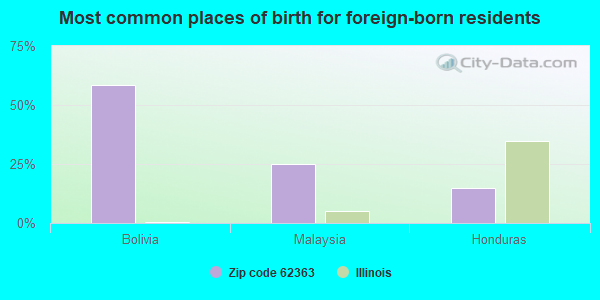
Foreign born population: 60 (1.2%) (23.5% of them are naturalized citizens)
This zip code:
1.2%
Whole state:
14.4%
58%Bolivia
25%Malaysia
15%Honduras
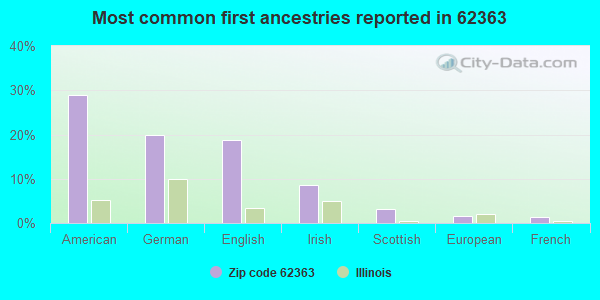
29%American
20%German
19%English
8%Irish
3%Scottish
2%European
1%French
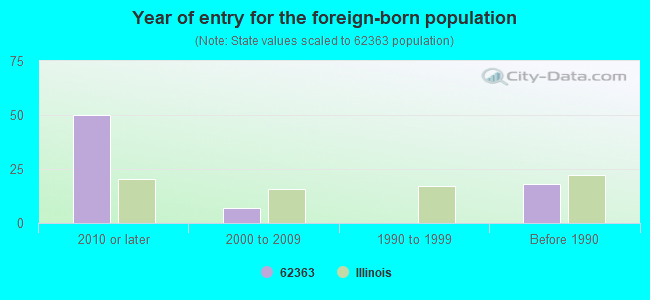
Year of entry for the foreign-born population
502010 or later
72000 to 2009
01990 to 1999
18Before 1990
Major facilities with environmental interests located in this zip code:
MASCHHOFF PORK, LLC (RR 3 in PITTSFIELD, IL)
STATE MASTER (Illinois EPA Project) - AIR PROGRAM STATE MASTER (Illinois EPA Project) - SOLID WASTE PROGRAM AIR MINOR (AIRS/AFS) Business SIC classification: HOGS
PIPERS CLEANERS (207 E ADAMS in PITTSFIELD, IL)
STATE MASTER (Illinois EPA Project) - HAZARDOUS WASTE PROGRAM, AIR PROGRAM AIR MINOR (AIRS/AFS) CRITERIA AND HAZARDOUS AIR POLLUTANT INVENTORY (Inventory of air pollution sources) Conditionally Exempt Small Quantity Generators, less than 100 kg/month of hazardous waste (Resource Conservation and Recovery Act (tracking hazardous waste)) - notification Business SIC classification: DRYCLEANING PLANTS, EXCEPT RUG CLEANING Organizations: PIPER WAYNE J (CONTACT/OWNER)
Alternative names: TERRI DAVIDSON
ILL DEPT OF TRANSPORTATION (335 N GROVE in PITTSFIELD, IL)
STATE MASTER (Illinois EPA Project) - HAZARDOUS WASTE PROGRAM, AIR PROGRAM AIR MINOR (AIRS/AFS) CRITERIA AND HAZARDOUS AIR POLLUTANT INVENTORY (Inventory of air pollution sources) Small Quantity Generators, between 100 kg and 1000 kg of hazardous waste/month (Resource Conservation and Recovery Act (tracking hazardous waste)) - notification Business SIC classification: REGULATION AND ADMINISTRATION OF TRANSPORTATION PROGRAMS Organizations: ILDOT DIST 6 (CONTACT/OWNER)
Alternative names: ILLINOIS DEPT OF TRANSPORTATION, ILDOT DIST 6, ILL DEPT OF TRANSPORTATION DIST 6
PIKE FEEDS INC (HIGHWAY 106 in PITTSFIELD, IL)
AIR MINOR (AIRS/AFS) CRITERIA AND HAZARDOUS AIR POLLUTANT INVENTORY (Inventory of air pollution sources) (Resource Conservation and Recovery Act (tracking hazardous waste)) Business SIC classification: PREPARED FEEDS AND FEED INGREDIENTS FOR ANIMALS AND FOWLS, EXCEPT DOGS AND CATS; REFUSE SYSTEMS; FARM SUPPLIES Organizations: PIKE COUNTY SERVICE CO (CONTACT/OWNER)
Alternative names: PIKE COUNTY SERVICE CO
ILLINI COMMUNITY HOSPITAL (640 W WASHINGTON ST in PITTSFIELD, IL)
STATE MASTER (Illinois EPA Project) - SOLID WASTE PROGRAM, AIR PROGRAM, National Pollutant Discharge Elimination System Permit AIR MINOR (AIRS/AFS) CRITERIA AND HAZARDOUS AIR POLLUTANT INVENTORY (Inventory of air pollution sources) Business SIC and NAICS classification: GENERAL MEDICAL AND SURGICAL HOSPITALS
ADM GROMARK FLORENCE (MI. 57.2 ON ILLINOIS RVR. in PITTSFIELD, IL)
STATE MASTER (Illinois EPA Project) - AIR PROGRAM AIR MINOR (AIRS/AFS) CRITERIA AND HAZARDOUS AIR POLLUTANT INVENTORY (Inventory of air pollution sources) Business SIC classification: GRAIN AND FIELD BEANS
DALE LYBARGER OIL CO (HWY 107 in PITTSFIELD, IL)
STATE MASTER (Illinois EPA Project) - AIR PROGRAM AIR MINOR (AIRS/AFS) CRITERIA AND HAZARDOUS AIR POLLUTANT INVENTORY (Inventory of air pollution sources) Business SIC classification: PETROLEUM BULK STATIONS AND TERMINALS
ROBERTS BODY SHOP (1297 W WASHINGTON in PITTSFIELD, IL)
STATE MASTER (Illinois EPA Project) - HAZARDOUS WASTE PROGRAM (Resource Conservation and Recovery Act (tracking hazardous waste))
COMMUNITY READY MIX OF PITTSFIELD INC (RURAL ROUTE 3, BOX 3163 in PITTSFIELD, IL)
STATE MASTER (Illinois EPA Project) - AIR PROGRAM AIR MINOR (AIRS/AFS) CRITERIA AND HAZARDOUS AIR POLLUTANT INVENTORY (Inventory of air pollution sources) Business SIC classification: READY-MIXED CONCRETE Business NAICS classification: READY-MIX CONCRETE MANUFACTURING.
PITTSFIELD MUNICIPAL (R.R. #3 in PITTSFIELD, IL)
STATE MASTER (Illinois EPA Project) - SOLID WASTE PROGRAM National Pollutant Discharge Elimination System NON-MAJOR (Tracking pollutant discharge elimination systems) - permit Organizations: PITTSFIELD-PENSTONE MUNICIPAL (CONTACT/OWNER)
Alternative names: PITTSFIELD-PENSTONE MUNICIPAL
NEW HARTFORD QUARRY (RR 2 in PITTSFIELD, IL)
STATE MASTER (Illinois EPA Project) - AIR PROGRAM AIR MINOR (AIRS/AFS) CRITERIA AND HAZARDOUS AIR POLLUTANT INVENTORY (Inventory of air pollution sources) Business SIC classification: CRUSHED AND BROKEN LIMESTONE
MOBIL OIL CORP (CITY OF in PITTSFIELD, IL)
STATE MASTER (Illinois EPA Project) - AIR PROGRAM AIR MINOR (AIRS/AFS) Business SIC classification: PETROLEUM BULK STATIONS AND TERMINALS Alternative names: EXXON MOBIL OIL CORPORATION
PIKE CO SERVICE CO (HWY 36-54 E in PITTSFIELD, IL)
STATE MASTER (Illinois EPA Project) - SOLID WASTE PROGRAM, AIR PROGRAM AIR MINOR (AIRS/AFS) Business SIC classification: FARM SUPPLIES
Housing units lacking complete plumbing facilities: 4.6% Housing units lacking complete kitchen facilities: 4.5%
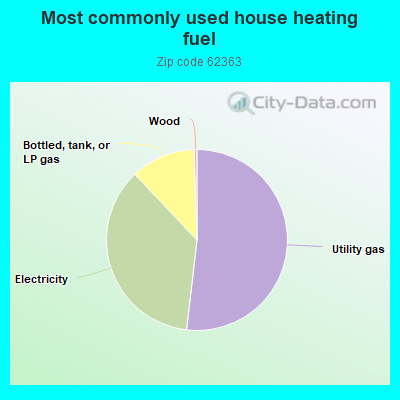
51.7%Utility gas
36.0%Electricity
11.5%Bottled, tank, or LP gas
0.5%Wood
Population in 1990: 5,678. Population change in the 1990s: +654 (+11.5%).
Place of birth for U.S.-born residents:
This state: 4,035
Northeast: 40
Midwest: 696
South: 150
West: 118
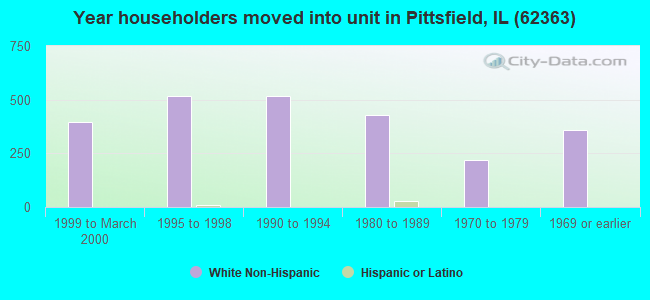
61% of the 62363 zip code residents lived in the same house 5 years ago. Out of people who lived in different houses, 65% lived in this county. Out of people who lived in different counties, 50% lived in Illinois.
89% of the 62363 zip code residents lived in the same house 1 year ago. Out of people who lived in different houses, 61% moved from this county. Out of people who lived in different houses, 35% moved from different county within same state. Out of people who lived in different houses, 3% moved from different state. Out of people who lived in different houses, 0% moved from abroad.
Private vs. public school enrollment:
Students in private schools in grades 1 to 8 (elementary and middle school): 24
Here:
4.5%
Illinois:
13.3%
Students in private schools in grades 9 to 12 (high school): 27
Here:
14.3%
Illinois:
9.9%
Students in private undergraduate colleges: 36
Here:
93.0%
Illinois:
27.4%
Occupation by median earnings in the past 12 months ($)
86,872Business and financial operations occupations
76,573Health diagnosing and treating practitioners and other technical occupations
65,264Arts, design, entertainment, sports, and media occupations
57,184Law enforcement workers including supervisors
55,090Installation, maintenance, and repair occupations
52,964Material moving occupations
Companies with federal contracts located in this zip code:
PIKE, COUNTY OF (204 E ADAMS ST in PITTSFIELD, IL) : $122,650 in 17 contractsfrom 2002 to 2006
Contracts for Guard Services by U.S. Army Corps of Engineers - civil program financing only, Army Signed by year:2000: $0; 2001: $0; 2002: $8,540; 2003: $10,807; 2004: $34,716; 2005: $45,940; 2006: $22,647.
Biggest contracts:
$22,970 with U.S. Army Corps of Engineers - civil program financing only for Guard Services. Signed on 2005-03-03. Completion date: 2006-03-31.
$22,970 with Army for Guard Services. Signed on 2005-03-03. Completion date: 2006-03-31.
$22,682, same as above.Signed on 2006-02-10. Completion date: 2006-03-31.
$12,962, same as above.Signed on 2004-02-27. Completion date: 2005-03-31.
Top industries in this zip code by the number of employees in 2005:
Health Care and Social Assistance: General Medical and Surgical Hospitals (100-249 employees: 1 establishment, 1-4 employees: 1 establishment)
Construction: Other Building Equipment Contractors (100-249: 1)
Other Services (except Public Administration): Religious Organizations (10-19: 3, 5-9: 3, 1-4: 8)
Health Care and Social Assistance: Offices of Physicians (except Mental Health Specialists) (20-49: 2, 5-9: 1)
People in group quarters in 2010:
384 people in state prisons
125 people in nursing facilities/skilled-nursing facilities
40 people in local jails and other municipal confinement facilities
17 people in group homes intended for adults
People in group quarters in 2000:
390 people in state prisons
151 people in nursing homes
31 people in local jails and other confinement facilities (including police lockups)
17 people in homes for the mentally retarded
Fatal accident statistics in 2014:
Fatal accident count: 1
Vehicles involved in fatal accidents: 1
Fatal accidents caused by drunken drivers: 1
Fatalities: 1
Persons involved in fatal accidents: 1
Pedestrians involved in fatal accidents: 0
Fatal accident statistics in 2013:
Fatal accident count: 1
Vehicles involved in fatal accidents: 1
Fatal accidents caused by drunken drivers: 0
Fatalities: 1
Persons involved in fatal accidents: 1
Pedestrians involved in fatal accidents: 1
2002 - 2018 National Fire Incident Reporting System (NFIRS) incidents
According to the data from the years 2002 - 2018 the average number of fire incidents per year is 36. The highest number of reported fires - 62 took place in 2007, and the least - 6 in 2003. The data has a rising trend.
When looking into fire subcategories, the most incidents belonged to: Outside Fires (43.0%), and Structure Fires (38.4%).
Fire incident types reported to NFIRS in Zip Code 62363
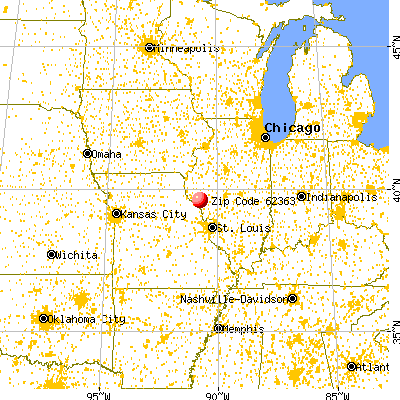


 Nearest zip codes: 62352, 62357, 62340, 62361, 62366, 62355.


 According to the data from the years 2002 - 2018 the average number of fire incidents per year is 36. The highest number of reported fires - 62 took place in 2007, and the least - 6 in 2003. The data has a rising trend.
 When looking into fire subcategories, the most incidents belonged to: Outside Fires (43.0%), and Structure Fires (38.4%).