Estimated zip code population in 2022: 1,040 Zip code population in 2010: 1,316 Zip code population in 2000: 1,445
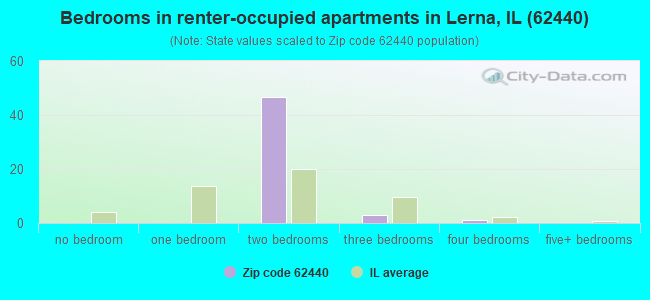
Houses and condos: 559 Renter-occupied apartments: 50
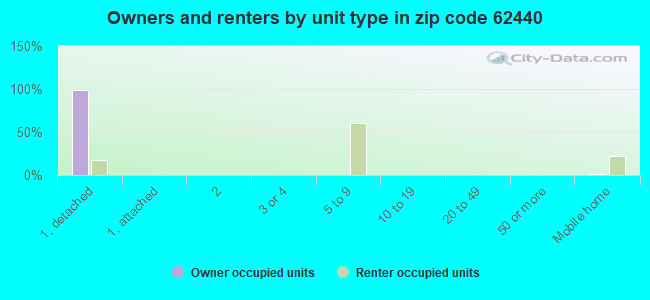
% of renters here:
10%
State:
33%
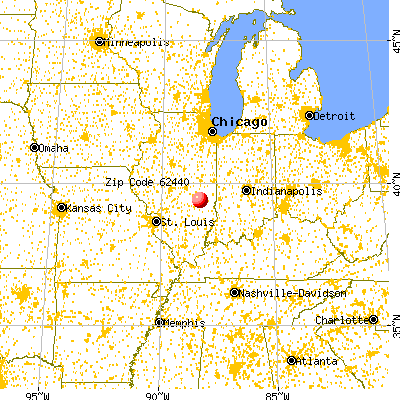
March 2022 cost of living index in zip code 62440: 86.2 (less than average, U.S. average is 100)
Land area: 38.6 sq. mi. Water area: 0.0 sq. mi.
Population density: 27 people per square mile
(very low).
OSM Map
General Map
Google Map
MSN Map
OSM Map
General Map
Google Map
MSN Map
OSM Map
General Map
Google Map
MSN Map
OSM Map
General Map
Google Map
MSN Map
Please wait while loading the map...
Real estate property taxes paid for housing units in 2022:
This zip code:
1.9% ($2,436)
Illinois:
2.0% ($4,912)
Median real estate property taxes paid for housing units with mortgages in 2022: $2,748 (1.8%) Median real estate property taxes paid for housing units with no mortgage in 2022: $2,021 (1.8%)
Business Search- 14 Million verified businesses
Males: 534
(51.4%)
Females: 505
(48.6%)
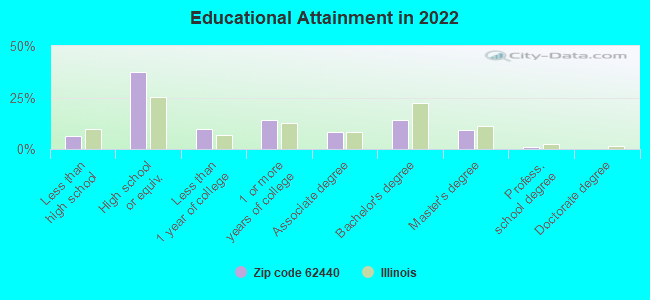
For population 25 years and over in 62440:
High school or higher: 91.9%
Bachelor's degree or higher: 24.0%
Graduate or professional degree: 10.2%
Unemployed: 2.5%
Mean travel time to work (commute): 28.5 minutes
For population 15 years and over in 62440:
Never married: 17.1%
Now married: 66.3%
Separated: 0.6%
Widowed: 6.7%
Divorced: 9.3%
Zip code 62440 compared to state average:
Median house value below state average.
Unemployed percentage below state average.
Black race population percentage significantly below state average.
Hispanic race population percentage significantly below state average.
Median age significantly above state average.
Foreign-born population percentage significantly below state average.
Renting percentage significantly below state average.
Length of stay since moving in significantly above state average.
Averages for the 2020 tax year for zip code 62440, filed in 2021:
Average Adjusted Gross Income (AGI) in 2020: $63,228 (Individual Income Tax Returns)
Here:
$63,228
State:
$82,626
Salary/wage: $50,820 (reported on 83.3% of returns)
Here:
$50,820
State:
$66,640
(% of AGI for various income ranges: 1201.7% for AGIs below $25k, 3330.0% for AGIs $25k-50k, 5317.1% for AGIs $50k-75k, 8528.0% for AGIs $75k-100k, 16851.7% for AGIs $100k-200k)
Taxable interest for individuals: $795 (reported on 37.0% of returns)
This zip code:
$795
Illinois:
$2,376
(% of AGI for various income ranges: 5.8% for AGIs below $25k, 15.0% for AGIs $25k-50k, 37.1% for AGIs $50k-75k, 28.0% for AGIs $75k-100k, 161.7% for AGIs $100k-200k)
Ordinary dividends: $1,925 (reported on 22.2% of returns)
Here:
$1,925
State:
$9,061
(% of AGI for various income ranges: 55.0% for AGIs $25k-50k, 121.4% for AGIs $50k-75k, 151.7% for AGIs $100k-200k)
Net capital gain/loss in AGI: +$4,190 (reported on 18.5% of returns)
Here:
+$4,190
State:
+$31,684
(% of AGI for various income ranges: 26.7% for AGIs below $25k, 32.9% for AGIs $50k-75k, 606.7% for AGIs $100k-200k)
Profit/loss from business: +$13,338 (reported on 14.8% of returns)
Here:
+$13,338
State:
+$12,175
(% of AGI for various income ranges: 75.0% for AGIs below $25k, 182.0% for AGIs $25k-50k, 1135.7% for AGIs $50k-75k)
Taxable individual retirement arrangement distribution: $12,580 (reported on 9.3% of returns)
62440:
$12,580
Illinois:
$21,613
(% of AGI for various income ranges: 130.8% for AGIs below $25k, 674.3% for AGIs $50k-75k)
Earned income credit: $1,850 (reported on 11.1% of returns)
Here:
$1,850
State:
$2,311
(% of AGI for various income ranges: 50.8% for AGIs below $25k, 50.0% for AGIs $25k-50k)
Percentage of individuals using paid preparers for their 2020 taxes: 96.3%
Here:
96%
State:
93%
(% for various income ranges: 93.8% for AGIs below $25k, 100.0% for AGIs $25k-50k, 100.0% for AGIs $50k-75k, 100.0% for AGIs $75k-100k, 90.0% for AGIs $100k-200k)
Averages for the 2012 tax year for zip code 62440, filed in 2013:
Average Adjusted Gross Income (AGI) in 2012: $58,438 (Individual Income Tax Returns)
Here:
$58,438
State:
$68,058
Salary/wage: $42,127 (reported on 87.9% of returns)
Here:
$42,127
State:
$55,396
(% of AGI for various income ranges: 71.4% for AGIs below $25k, 80.6% for AGIs $25k-50k, 77.3% for AGIs $50k-75k, 71.2% for AGIs $75k-100k, 45.2% for AGIs $100k-200k)
Taxable interest for individuals: $1,777 (reported on 37.9% of returns)
This zip code:
$1,777
Illinois:
$1,969
(% of AGI for various income ranges: 1.1% for AGIs below $25k, 0.5% for AGIs $25k-50k, 0.4% for AGIs $50k-75k, 0.6% for AGIs $75k-100k, 2.0% for AGIs $100k-200k)
Ordinary dividends: $2,058 (reported on 20.7% of returns)
Here:
$2,058
State:
$7,786
(% of AGI for various income ranges: 0.6% for AGIs below $25k, 0.4% for AGIs $25k-50k, 0.5% for AGIs $75k-100k, 1.3% for AGIs $100k-200k)
Net capital gain/loss in AGI: +$1,683 (reported on 10.3% of returns)
Here:
+$1,683
State:
+$22,183
Profit/loss from business: +$4,786 (reported on 12.1% of returns)
Here:
+$4,786
State:
+$12,903
Taxable individual retirement arrangement distribution: $8,560 (reported on 8.6% of returns)
62440:
$8,560
Illinois:
$17,929
Total itemized deductions: $20,309 (15% of AGI, reported on 19.0% of returns)
Here:
$20,309
State:
$26,433
Here:
14.7% of AGI
State:
19.2% of AGI
(% of AGI for various income ranges: 7.6% for AGIs $25k-50k, 5.2% for AGIs $50k-75k, 6.7% for AGIs $75k-100k, 7.9% for AGIs $100k-200k)
Charity contributions: $4,229 (reported on 12.1% of returns)
Here:
$4,229
State:
$4,525
Taxes paid: $9,136 (reported on 19.0% of returns)
62440:
$9,136
State:
$11,968
(% of AGI for various income ranges: 1.4% for AGIs $25k-50k, 1.7% for AGIs $50k-75k, 2.5% for AGIs $75k-100k, 4.9% for AGIs $100k-200k)
Earned income credit: $2,022 (reported on 15.5% of returns)
Here:
$2,022
State:
$2,349
(% of AGI for various income ranges: 5.6% for AGIs below $25k, 0.9% for AGIs $25k-50k)
Percentage of individuals using paid preparers for their 2012 taxes: 58.6%
Here:
59%
State:
57%
(% for various income ranges: 50.0% for AGIs below $25k, 66.7% for AGIs $25k-50k, 60.0% for AGIs $50k-75k, 57.1% for AGIs $75k-100k, 66.7% for AGIs $100k-200k)
Averages for the 2004 tax year for zip code 62440, filed in 2005:
Average Adjusted Gross Income (AGI) in 2004: $39,793 (Individual Income Tax Returns)
Here:
$39,793
State:
$54,625
Salary/wage: $34,036 (reported on 88.5% of returns)
Here:
$34,036
State:
$46,811
(% of AGI for various income ranges: 91.1% for AGIs below $10k, 82.8% for AGIs $10k-25k, 83.5% for AGIs $25k-50k, 84.7% for AGIs $50k-75k, 85.3% for AGIs $75k-100k, 45.8% for AGIs over 100k)
Taxable interest for individuals: $1,359 (reported on 47.7% of returns)
This zip code:
$1,359
Illinois:
$2,101
(% of AGI for various income ranges: 3.5% for AGIs below $10k, 1.3% for AGIs $10k-25k, 1.4% for AGIs $25k-50k, 0.6% for AGIs $50k-75k, 0.5% for AGIs $75k-100k, 3.9% for AGIs over 100k)
Taxable dividends: $1,078 (reported on 21.7% of returns)
Here:
$1,078
State:
$4,306
(% of AGI for various income ranges: 0.8% for AGIs below $10k, 0.9% for AGIs $10k-25k, 0.7% for AGIs $25k-50k, 0.1% for AGIs $50k-75k, 0.3% for AGIs $75k-100k, 1.1% for AGIs over 100k)
Net capital gain/loss: +$2,400 (reported on 14.4% of returns)
Here:
+$2,400
State:
+$17,321
(% of AGI for various income ranges: -3.7% for AGIs below $10k, 0.9% for AGIs $25k-50k, 0.2% for AGIs $50k-75k, 0.6% for AGIs $75k-100k, 2.6% for AGIs over 100k)
Profit/loss from business: +$2,554 (reported on 14.1% of returns)
Here:
+$2,554
State:
+$11,771
(% of AGI for various income ranges: 1.0% for AGIs below $10k, 0.4% for AGIs $10k-25k, 3.2% for AGIs $25k-50k, 0.9% for AGIs $50k-75k, -0.7% for AGIs $75k-100k)
Profit/loss from farming: +$1,116 (reported on 7.3% of returns)
Here:
+$1,116
State:
+$2,327
IRA payment deduction: $1,700 (reported on 1.7% of returns)
62440:
$1,700
Illinois:
$3,087
Total itemized deductions: $14,580 (16% of AGI, reported on 17.0% of returns)
Here:
$14,580
State:
$20,239
Here:
16.5% of AGI
State:
19.5% of AGI
(% of AGI for various income ranges: 7.2% for AGIs $25k-50k, 6.4% for AGIs $50k-75k, 7.8% for AGIs $75k-100k, 7.5% for AGIs over 100k)
Charity contributions deductions: $2,355 (3% of AGI, reported on 12.9% of returns)
Here:
$2,355
State:
$3,719
Here:
2.7% of AGI
State:
3.4% of AGI
(% of AGI for various income ranges: 0.6% for AGIs $25k-50k, 1.0% for AGIs $50k-75k, 0.9% for AGIs $75k-100k, 0.9% for AGIs over 100k)
Total tax: $5,634 (reported on 76.6% of returns)
62440:
$5,634
State:
$9,882
(% of AGI for various income ranges: 2.9% for AGIs below $10k, 3.5% for AGIs $10k-25k, 6.9% for AGIs $25k-50k, 8.3% for AGIs $50k-75k, 10.5% for AGIs $75k-100k, 22.1% for AGIs over 100k)
Earned income credit: $1,544 (reported on 13.4% of returns)
Here:
$1,544
State:
$1,788
Percentage of individuals using paid preparers for their 2004 taxes: 60.8%
Here:
61%
State:
61%
(% for various income ranges: 57.9% for AGIs below $10k, 49.7% for AGIs $10k-25k, 66.9% for AGIs $25k-50k, 62.3% for AGIs $50k-75k, 75.6% for AGIs $75k-100k, 72.0% for AGIs over 100k)
Household received Food Stamps/SNAP in the past 12 months: 33 Household did not receive Food Stamps/SNAP in the past 12 months: 471
Women who had a birth in the past 12 months: 16 (7 now married, 8 unmarried) Women who did not have a birth in the past 12 months: 167 (92 now married, 74 unmarried)
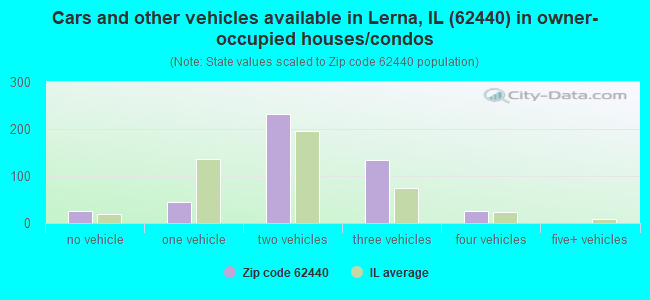
Housing units in zip code 62440 with a mortgage: 280 (20 second mortgage, 17 both second mortgage and home equity loan) Houses without a mortgage: 3
Median monthly owner costs for units with a mortgage: $1,065 Median monthly owner costs for units without a mortgage: $525
Residents with income below the poverty level in 2022:
This zip code:
10.2%
Whole state:
11.9%
Residents with income below 50% of the poverty level in 2022:
This zip code:
4.0%
Whole state:
5.7%
Median number of rooms in houses and condos:
Here:
5.7
State:
6.4
Median number of rooms in apartments:
Here:
3.8
State:
4.1
Notable locations in this zip code not listed on our city pages
Cemeteries: Upper Muddy Cemetery (1), Old Indian Creek Cemetery (2), New Indian Creek Cemetery (3), Janesville Cemetery (4), Bales Cemetery (5), Wright Cemetery (6), Shiloh Cemetery (7). Display/hide their locations on the map
In group quarters: 11 (-1 institutionalized population)
Size of family households: 221 2-persons, 31 3-persons, 65 4-persons, 5 5-persons
Size of nonfamily households: 166 1-person, 22 2-persons
142 married couples with children.
9 single-parent households (9 men).
99.2% of residents of 62440 zip code speak English at home.
0.4% of residents speak Spanish at home (100% not well).
Foreign born population: 0 (0.0%)
:
0.0%
Whole state:
14.4%
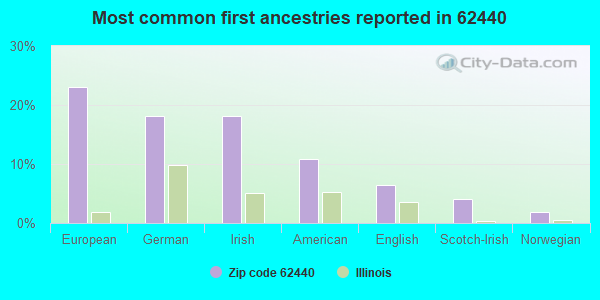
23%European
18%German
18%Irish
11%American
7%English
4%Scotch-Irish
2%Norwegian
Year of entry for the foreign-born population
02010 or later
02000 to 2009
01990 to 1999
21Before 1990
Facilities with environmental interests located in this zip code:
HPA-LINCOLN LOG CABIN HIS SITE (420 NORTH COUNTY RD 1420 EAST in LERNA, IL)
STATE MASTER (Illinois EPA Project) - National Pollutant Discharge Elimination System Permit National Pollutant Discharge Elimination System NON-MAJOR (Tracking pollutant discharge elimination systems) - permit Business SIC classification: RECREATIONAL VEHICLE PARKS AND CAMPSITES Alternative names: LINCOLN LOG CABIN HISTORICAL S, LINCOLN LOG CABIN SITE
HAROLD SAWYER AUTO REPAIR (512 PARK ST in LERNA, IL)
STATE MASTER (Illinois EPA Project) - HAZARDOUS WASTE PROGRAM Conditionally Exempt Small Quantity Generators, less than 100 kg/month of hazardous waste (Resource Conservation and Recovery Act (tracking hazardous waste)) - notification Organizations: SAWYER HAROLD (CONTACT/OWNER)
Alternative names: SAWYER HAROLD AUTO REPAIR
LERNA ELEM SCHOOL (P O BOX 129 in LERNA, IL)
(National Center for Education Statistics) - STATE ID-1101500102008 Organizations: CHARLESTON C U SCHOOL DIST 1 (SCHOOL DISTRICT)
AMOCO FERTILIZER PLANT (RTE 16 in LERNA, IL)
(Resource Conservation and Recovery Act (tracking hazardous waste))
KAISER AGRICULTURAL CHEMICALS (RTE 1 3MI SE OF LERNA in LERNA, IL)
(Resource Conservation and Recovery Act (tracking hazardous waste))
Housing units lacking complete plumbing facilities: 4.9% Housing units lacking complete kitchen facilities: 3.2%
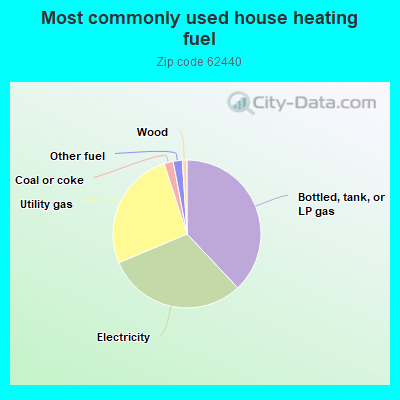
38.1%Bottled, tank, or LP gas
30.8%Electricity
26.4%Utility gas
2.0%Coal or coke
2.0%Other fuel
1.0%Wood
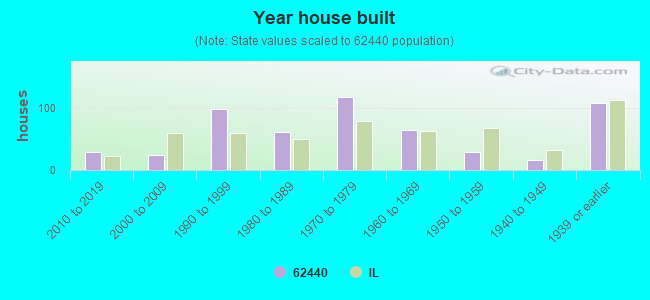
Population in 1990: 1,289. Population change in the 1990s: +156 (+12.1%).
Place of birth for U.S.-born residents:
This state: 835
Northeast: 12
Midwest: 126
South: 30
West: 11
57% of the 62440 zip code residents lived in the same house 5 years ago. Out of people who lived in different houses, 68% lived in this county. Out of people who lived in different counties, 50% lived in Illinois.
100% of the 62440 zip code residents lived in the same house 1 year ago. Out of people who lived in different houses, 75% moved from this county.
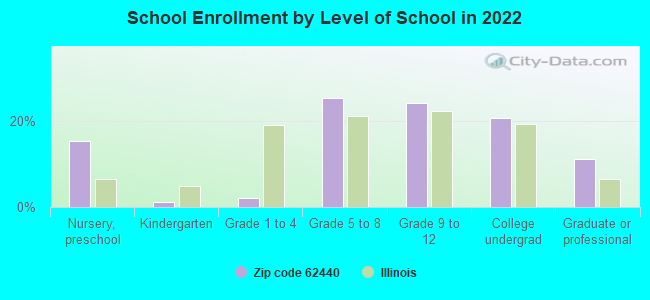
Private vs. public school enrollment:
Students in private schools in grades 1 to 8 (elementary and middle school): 2
Here:
4.0%
Illinois:
13.3%
Students in private schools in grades 9 to 12 (high school):
Here:
0.0%
Illinois:
9.9%
Students in private undergraduate colleges:
Here:
0.0%
Illinois:
27.4%
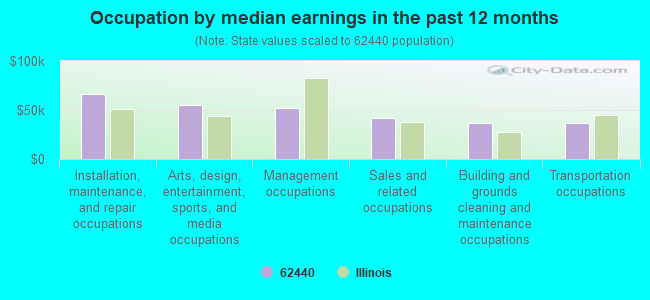
Occupation by median earnings in the past 12 months ($)
66,691Installation, maintenance, and repair occupations
54,825Arts, design, entertainment, sports, and media occupations
51,732Management occupations
41,460Sales and related occupations
36,996Building and grounds cleaning and maintenance occupations
36,723Transportation occupations
Top industries in this zip code by the number of employees in 2005:
Health Care and Social Assistance: Residential Mental Health and Substance Abuse Facilities (20-49 employees: 1 establishment)
Construction: New Housing Operative Builders (1-4: 1)
Construction: New Single-Family Housing Construction (except Operative Builders) (1-4: 1)
Arts, Entertainment, and Recreation: Historical Sites (1-4: 1)
Other Services (except Public Administration): Communication Equipment Repair and Maintenance (1-4: 1)
Administrative and Support and Waste Management and Remediation Services: Carpet and Upholstery Cleaning Services (1-4: 1)
Administrative and Support and Waste Management and Remediation Services: Solid Waste Collection (1-4: 1)
Construction: All Other Specialty Trade Contractors (1-4: 1)
Construction: Flooring Contractors (1-4: 1)
People in group quarters in 2010:
11 people in residential treatment centers for juveniles (non-correctional)
People in group quarters in 2000:
11 people in homes or halfway houses for drug/alcohol abuse
Fatal accident statistics in 2012:
Fatal accident count: 1
Vehicles involved in fatal accidents: 1
Fatal accidents caused by drunken drivers: 0
Fatalities: 1
Persons involved in fatal accidents: 1
Pedestrians involved in fatal accidents: 0
Fatal accident statistics in 2010:
Fatal accident count: 1
Vehicles involved in fatal accidents: 1
Fatal accidents caused by drunken drivers: 0
Fatalities: 1
Persons involved in fatal accidents: 3
Pedestrians involved in fatal accidents: 0
Most common first names in zip code 62440 among deceased individuals
Name
Count
Lived (average)
James
8
74.6 years
William
8
80.9 years
Mary
7
75.4 years
Charles
5
76.6 years
Donald
5
70.6 years
Harold
4
69.8 years
Earl
4
74.3 years
Dorothy
4
72.0 years
John
4
64.0 years
Richard
4
65.7 years
Most common last names in zip code 62440 among deceased individuals
Last name
Count
Lived (average)
Starwalt
9
82.0 years
Thompson
7
81.8 years
Richter
5
77.8 years
Smith
5
81.2 years
Phipps
4
91.2 years
Jones
4
80.8 years
Lawyer
4
76.2 years
Edwards
4
63.8 years
Wortham
4
82.5 years
Barger
3
72.6 years
Discuss Lerna, Illinois (IL) on our hugely popular Illinois forum.


 Nearest zip codes: 62469, 62468, 61938, 61920, 62428, 62447.