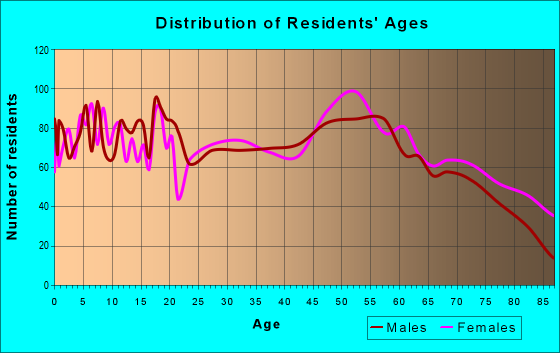
Estimated zip code population in 2022: 12,157 Zip code population in 2010: 12,218 Zip code population in 2000: 11,900
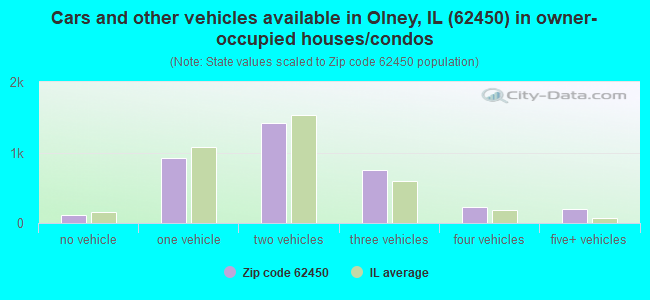
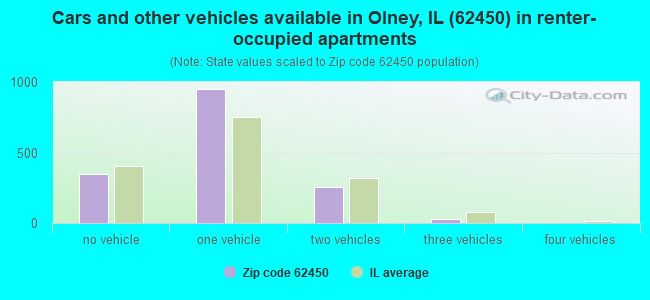
Houses and condos: 5,807 Renter-occupied apartments: 1,569
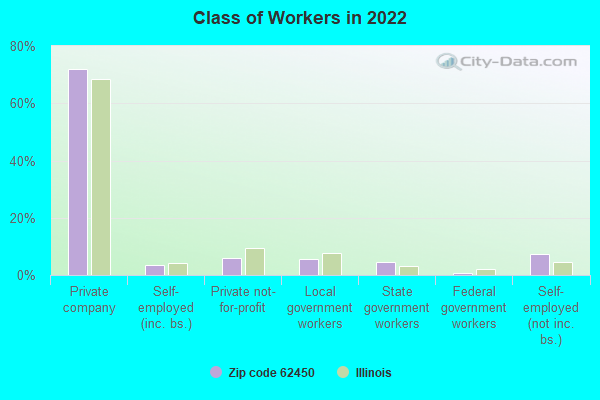
% of renters here:
30%
State:
33%
March 2022 cost of living index in zip code 62450: 74.3 (low, U.S. average is 100)
Land area: 152.2 sq. mi. Water area: 1.8 sq. mi.
Population density: 80 people per square mile
(very low).
OSM Map
General Map
Google Map
MSN Map
OSM Map
General Map
Google Map
MSN Map
OSM Map
General Map
Google Map
MSN Map
OSM Map
General Map
Google Map
MSN Map
Please wait while loading the map...
Real estate property taxes paid for housing units in 2022:
This zip code:
1.6% ($1,854)
Illinois:
2.0% ($4,912)
Median real estate property taxes paid for housing units with mortgages in 2022: $2,140 (1.7%) Median real estate property taxes paid for housing units with no mortgage in 2022: $1,591 (1.4%)
Averages for the 2020 tax year for zip code 62450, filed in 2021:
Average Adjusted Gross Income (AGI) in 2020: $55,177 (Individual Income Tax Returns)
Here:
$55,177
State:
$82,626
Salary/wage: $44,823 (reported on 79.9% of returns)
Here:
$44,823
State:
$66,640
(% of AGI for various income ranges: 1194.2% for AGIs below $25k, 3502.5% for AGIs $25k-50k, 6334.2% for AGIs $50k-75k, 9061.7% for AGIs $75k-100k, 15991.2% for AGIs $100k-200k, 58622.5% for AGIs over 200k)
Taxable interest for individuals: $1,254 (reported on 34.5% of returns)
This zip code:
$1,254
Illinois:
$2,376
(% of AGI for various income ranges: 27.6% for AGIs below $25k, 30.4% for AGIs $25k-50k, 81.2% for AGIs $50k-75k, 97.4% for AGIs $75k-100k, 146.8% for AGIs $100k-200k, 1037.5% for AGIs over 200k)
Ordinary dividends: $4,861 (reported on 25.1% of returns)
Here:
$4,861
State:
$9,061
(% of AGI for various income ranges: 36.1% for AGIs below $25k, 36.7% for AGIs $25k-50k, 112.3% for AGIs $50k-75k, 213.1% for AGIs $75k-100k, 685.0% for AGIs $100k-200k, 5565.0% for AGIs over 200k)
Net capital gain/loss in AGI: +$7,912 (reported on 21.9% of returns)
Here:
+$7,912
State:
+$31,684
(% of AGI for various income ranges: 19.4% for AGIs below $25k, 43.6% for AGIs $25k-50k, 88.3% for AGIs $50k-75k, 240.3% for AGIs $75k-100k, 638.8% for AGIs $100k-200k, 13522.5% for AGIs over 200k)
Profit/loss from business: +$11,010 (reported on 12.9% of returns)
Here:
+$11,010
State:
+$12,175
(% of AGI for various income ranges: 53.4% for AGIs below $25k, 95.9% for AGIs $25k-50k, 179.2% for AGIs $50k-75k, 104.6% for AGIs $75k-100k, 648.8% for AGIs $100k-200k, 6450.0% for AGIs over 200k)
Taxable individual retirement arrangement distribution: $13,394 (reported on 11.5% of returns)
62450:
$13,394
Illinois:
$21,613
(% of AGI for various income ranges: 78.1% for AGIs below $25k, 103.4% for AGIs $25k-50k, 161.3% for AGIs $50k-75k, 405.4% for AGIs $75k-100k, 864.1% for AGIs $100k-200k, 2767.5% for AGIs over 200k)
Total itemized deductions: $32,889 (reported on 3.2% of returns)
Here:
$32,889
State:
$34,948
(% of AGI for various income ranges: 48.2% for AGIs below $25k, 84.7% for AGIs $25k-50k, 217.9% for AGIs $50k-75k, 451.5% for AGIs $100k-200k, 4022.5% for AGIs over 200k)
Charity contributions: $13,500 (reported on 2.2% of returns)
Here:
$13,500
State:
$13,122
(% of AGI for various income ranges: 19.6% for AGIs $25k-50k, 160.6% for AGIs $100k-200k, 2117.5% for AGIs over 200k)
Taxes paid: $6,322 (reported on 3.2% of returns)
62450:
$6,322
State:
$8,563
(% of AGI for various income ranges: 3.7% for AGIs below $25k, 6.2% for AGIs $25k-50k, 40.0% for AGIs $50k-75k, 122.6% for AGIs $100k-200k, 975.0% for AGIs over 200k)
Earned income credit: $2,090 (reported on 17.6% of returns)
Here:
$2,090
State:
$2,311
(% of AGI for various income ranges: 86.8% for AGIs below $25k, 74.1% for AGIs $25k-50k)
Percentage of individuals using paid preparers for their 2020 taxes: 95.5%
Here:
96%
State:
93%
(% for various income ranges: 95.0% for AGIs below $25k, 95.9% for AGIs $25k-50k, 94.7% for AGIs $50k-75k, 96.2% for AGIs $75k-100k, 97.0% for AGIs $100k-200k, 93.3% for AGIs over 200k)
Averages for the 2012 tax year for zip code 62450, filed in 2013:
Average Adjusted Gross Income (AGI) in 2012: $46,368 (Individual Income Tax Returns)
Here:
$46,368
State:
$68,058
Salary/wage: $35,950 (reported on 81.9% of returns)
Here:
$35,950
State:
$55,396
(% of AGI for various income ranges: 73.8% for AGIs below $25k, 75.0% for AGIs $25k-50k, 70.8% for AGIs $50k-75k, 68.6% for AGIs $75k-100k, 59.1% for AGIs $100k-200k, 32.3% for AGIs over 200k)
Taxable interest for individuals: $1,685 (reported on 38.1% of returns)
This zip code:
$1,685
Illinois:
$1,969
(% of AGI for various income ranges: 2.2% for AGIs below $25k, 1.3% for AGIs $25k-50k, 1.1% for AGIs $50k-75k, 1.3% for AGIs $75k-100k, 1.5% for AGIs $100k-200k, 1.3% for AGIs over 200k)
Ordinary dividends: $3,437 (reported on 25.3% of returns)
Here:
$3,437
State:
$7,786
(% of AGI for various income ranges: 1.5% for AGIs below $25k, 1.3% for AGIs $25k-50k, 1.6% for AGIs $50k-75k, 1.5% for AGIs $75k-100k, 3.0% for AGIs $100k-200k, 2.1% for AGIs over 200k)
Net capital gain/loss in AGI: +$6,504 (reported on 19.0% of returns)
Here:
+$6,504
State:
+$22,183
(% of AGI for various income ranges: 0.3% for AGIs below $25k, 0.6% for AGIs $25k-50k, 0.7% for AGIs $50k-75k, 0.9% for AGIs $75k-100k, 2.9% for AGIs $100k-200k, 11.1% for AGIs over 200k)
Profit/loss from business: +$13,311 (reported on 15.1% of returns)
Here:
+$13,311
State:
+$12,903
(% of AGI for various income ranges: 3.8% for AGIs below $25k, 2.3% for AGIs $25k-50k, 3.1% for AGIs $50k-75k, 1.9% for AGIs $75k-100k, 5.6% for AGIs $100k-200k, 9.6% for AGIs over 200k)
Taxable individual retirement arrangement distribution: $10,163 (reported on 12.2% of returns)
62450:
$10,163
Illinois:
$17,929
(% of AGI for various income ranges: 3.6% for AGIs below $25k, 2.5% for AGIs $25k-50k, 2.4% for AGIs $50k-75k, 3.6% for AGIs $75k-100k, 3.9% for AGIs $100k-200k)
Self-employment retirement plans: $23,633 (reported on 0.5% of returns)
62450:
$23,633
Illinois:
$24,666
Total itemized deductions: $20,462 (19% of AGI, reported on 17.2% of returns)
Here:
$20,462
State:
$26,433
Here:
18.9% of AGI
State:
19.2% of AGI
(% of AGI for various income ranges: 4.9% for AGIs below $25k, 5.2% for AGIs $25k-50k, 6.5% for AGIs $50k-75k, 8.1% for AGIs $75k-100k, 10.7% for AGIs $100k-200k, 9.5% for AGIs over 200k)
Charity contributions: $5,743 (reported on 12.6% of returns)
Here:
$5,743
State:
$4,525
(% of AGI for various income ranges: 0.3% for AGIs below $25k, 0.8% for AGIs $25k-50k, 0.9% for AGIs $50k-75k, 1.5% for AGIs $75k-100k, 2.7% for AGIs $100k-200k, 2.8% for AGIs over 200k)
Taxes paid: $7,633 (reported on 17.2% of returns)
62450:
$7,633
State:
$11,968
(% of AGI for various income ranges: 0.7% for AGIs below $25k, 1.1% for AGIs $25k-50k, 2.1% for AGIs $50k-75k, 2.9% for AGIs $75k-100k, 4.5% for AGIs $100k-200k, 5.3% for AGIs over 200k)
Earned income credit: $2,080 (reported on 19.7% of returns)
Here:
$2,080
State:
$2,349
(% of AGI for various income ranges: 6.1% for AGIs below $25k, 1.1% for AGIs $25k-50k)
Percentage of individuals using paid preparers for their 2012 taxes: 70.2%
Here:
70%
State:
57%
(% for various income ranges: 64.3% for AGIs below $25k, 69.9% for AGIs $25k-50k, 75.9% for AGIs $50k-75k, 79.2% for AGIs $75k-100k, 80.0% for AGIs $100k-200k, 90.0% for AGIs over 200k)
Averages for the 2004 tax year for zip code 62450, filed in 2005:
Average Adjusted Gross Income (AGI) in 2004: $36,277 (Individual Income Tax Returns)
Here:
$36,277
State:
$54,625
Salary/wage: $30,756 (reported on 80.9% of returns)
Here:
$30,756
State:
$46,811
(% of AGI for various income ranges: 99.8% for AGIs below $10k, 71.5% for AGIs $10k-25k, 73.9% for AGIs $25k-50k, 77.2% for AGIs $50k-75k, 71.7% for AGIs $75k-100k, 49.3% for AGIs over 100k)
Taxable interest for individuals: $1,890 (reported on 48.8% of returns)
This zip code:
$1,890
Illinois:
$2,101
(% of AGI for various income ranges: 7.2% for AGIs below $10k, 4.1% for AGIs $10k-25k, 2.3% for AGIs $25k-50k, 2.0% for AGIs $50k-75k, 2.2% for AGIs $75k-100k, 2.2% for AGIs over 100k)
Taxable dividends: $2,380 (reported on 31.2% of returns)
Here:
$2,380
State:
$4,306
(% of AGI for various income ranges: 3.7% for AGIs below $10k, 1.8% for AGIs $10k-25k, 1.6% for AGIs $25k-50k, 1.0% for AGIs $50k-75k, 2.1% for AGIs $75k-100k, 3.3% for AGIs over 100k)
Net capital gain/loss: +$5,059 (reported on 23.3% of returns)
Here:
+$5,059
State:
+$17,321
(% of AGI for various income ranges: -0.7% for AGIs below $10k, 0.8% for AGIs $10k-25k, 1.4% for AGIs $25k-50k, 1.0% for AGIs $50k-75k, 3.1% for AGIs $75k-100k, 8.7% for AGIs over 100k)
Profit/loss from business: +$10,240 (reported on 17.6% of returns)
Here:
+$10,240
State:
+$11,771
(% of AGI for various income ranges: 3.6% for AGIs below $10k, 4.0% for AGIs $10k-25k, 2.7% for AGIs $25k-50k, 2.6% for AGIs $50k-75k, 2.5% for AGIs $75k-100k, 11.3% for AGIs over 100k)
Profit/loss from farming: +$1,303 (reported on 4.2% of returns)
Here:
+$1,303
State:
+$2,327
(% of AGI for various income ranges: -4.2% for AGIs below $10k, 0.2% for AGIs $10k-25k, 0.4% for AGIs $25k-50k, 0.5% for AGIs $50k-75k, -0.4% for AGIs $75k-100k, 0.3% for AGIs over 100k)
IRA payment deduction: $3,157 (reported on 3.3% of returns)
62450:
$3,157
Illinois:
$3,087
(% of AGI for various income ranges: 0.3% for AGIs $10k-25k, 0.4% for AGIs $25k-50k, 0.3% for AGIs $50k-75k, 0.2% for AGIs $75k-100k, 0.2% for AGIs over 100k)
Self-employed pension: $24,136 (reported on 0.4% of returns)
Here:
$24,136
Illinois:
$16,965
Total itemized deductions: $16,600 (20% of AGI, reported on 16.7% of returns)
Here:
$16,600
State:
$20,239
Here:
19.8% of AGI
State:
19.5% of AGI
(% of AGI for various income ranges: 8.8% for AGIs below $10k, 7.6% for AGIs $10k-25k, 6.4% for AGIs $25k-50k, 6.9% for AGIs $50k-75k, 8.8% for AGIs $75k-100k, 8.7% for AGIs over 100k)
Charity contributions deductions: $4,227 (5% of AGI, reported on 12.8% of returns)
Here:
$4,227
State:
$3,719
Here:
4.5% of AGI
State:
3.4% of AGI
(% of AGI for various income ranges: 0.4% for AGIs below $10k, 0.8% for AGIs $10k-25k, 0.9% for AGIs $25k-50k, 1.1% for AGIs $50k-75k, 1.9% for AGIs $75k-100k, 2.6% for AGIs over 100k)
Total tax: $5,318 (reported on 71.4% of returns)
62450:
$5,318
State:
$9,882
(% of AGI for various income ranges: 2.6% for AGIs below $10k, 4.0% for AGIs $10k-25k, 6.7% for AGIs $25k-50k, 8.4% for AGIs $50k-75k, 10.4% for AGIs $75k-100k, 20.1% for AGIs over 100k)
Earned income credit: $1,503 (reported on 17.0% of returns)
Here:
$1,503
State:
$1,788
Percentage of individuals using paid preparers for their 2004 taxes: 72.1%
Here:
72%
State:
61%
(% for various income ranges: 64.2% for AGIs below $10k, 72.7% for AGIs $10k-25k, 76.1% for AGIs $25k-50k, 74.9% for AGIs $50k-75k, 74.2% for AGIs $75k-100k, 80.3% for AGIs over 100k)
Household received Food Stamps/SNAP in the past 12 months: 1,060 Household did not receive Food Stamps/SNAP in the past 12 months: 4,189
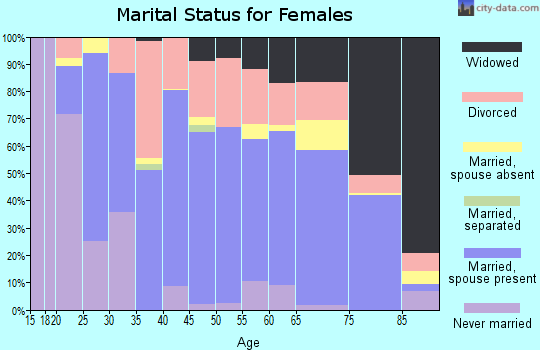
Women who had a birth in the past 12 months: 109 (68 now married, 41 unmarried) Women who did not have a birth in the past 12 months: 2,340 (990 now married, 1,347 unmarried)
Housing units in zip code 62450 with a mortgage: 1,586 (47 second mortgage, 19 home equity loan, 8 both second mortgage and home equity loan) Houses without a mortgage: 48
Median monthly owner costs for units with a mortgage: $1,011 Median monthly owner costs for units without a mortgage: $434
Residents with income below the poverty level in 2022:
This zip code:
15.0%
Whole state:
11.9%
Residents with income below 50% of the poverty level in 2022:
This zip code:
8.8%
Whole state:
5.7%
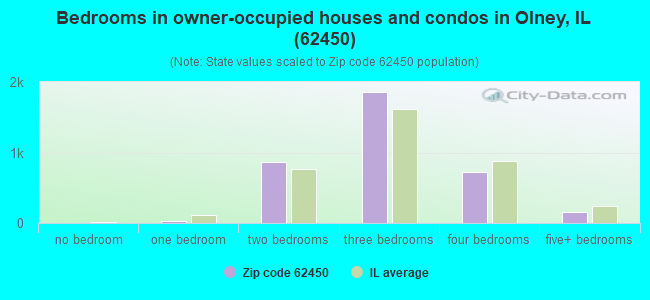
Median number of rooms in houses and condos:
Here:
6.4
State:
6.4
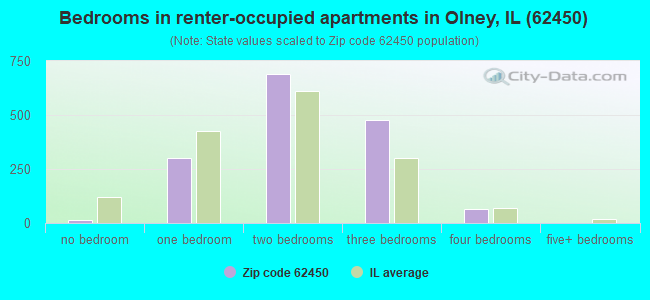
Median number of rooms in apartments:
Here:
4.8
State:
4.1
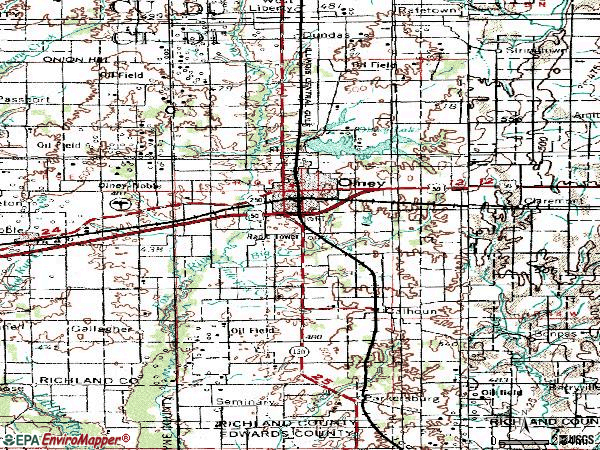
Notable locations in this zip code not listed on our city pages
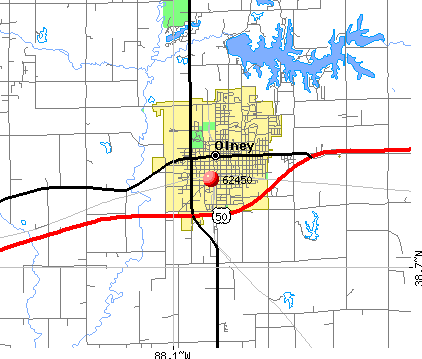
Notable locations in zip code 62450: Clover Farms (A), Richland Country Club (B), Olney Public Library (C), Richland County Jail (D), Olney Fire Department (E), Fox Creek Vineyards (F), Richland County Courthouse (G). Display/hide their locations on the map
Churches in zip code 62450 include: Antioch Church (A), First Assembly of God Church (B), Pleasant Ridge Church (C), Ebenezer Church (D), Sugar Creek Church (E), Eureka Church (F), Trinity Lutheran Church (G), Calvary Baptist Church (H), Church of Christ (I). Display/hide their locations on the map
Cemeteries: Bethel Cemetery (1), Blain Cemetery (2), Liberty Lawn Cemetery (3), Maple Dale Cemetery (4), Mount Zion Cemetery (5), Olive Branch Cemetery (6), Parry Cemetery (7). Display/hide their locations on the map
Lakes and reservoirs: Lake Montclare (A), Jordan Lake (B), Hahn Lake (C), M D Borah Lake (D), Millers Lake (E), East Fork Lake (F), McCarthy Lake (G), Vernor Lake (H). Display/hide their locations on the map
Streams, rivers, and creeks: East Fork Fox River (A), Big Creek (B), Mash Creek (C), Rock Branch (D), Little Fox Creek (E), Susan Branch (F), Sugar Creek (G), Gentry Creek (H). Display/hide their locations on the map
Parks in zip code 62450 include: Big Creek Woods Memorial Nature Preserve (1), Bower Park (2), Gassmann Park (3), City Park (4), Elliott Street Historic District (5). Display/hide their locations on the map
1,448 married couples with children.
885 single-parent households (368 men, 517 women).
95.8% of residents of 62450 zip code speak English at home.
2.6% of residents speak Spanish at home (46% very well, 21% well, 32% not well).
1.1% of residents speak other Indo-European language at home (24% very well, 2% well, 71% not well, 3% not at all).
0.2% of residents speak Asian or Pacific Island language at home (50% very well, 50% well).
Foreign born population: 254 (2.1%) (45.1% of them are naturalized citizens)
This zip code:
2.1%
Whole state:
14.4%
52%Honduras
7%France
6%China, excluding Hong Kong and Taiwan
6%Greece
5%Malaysia
5%Poland
3%Denmark
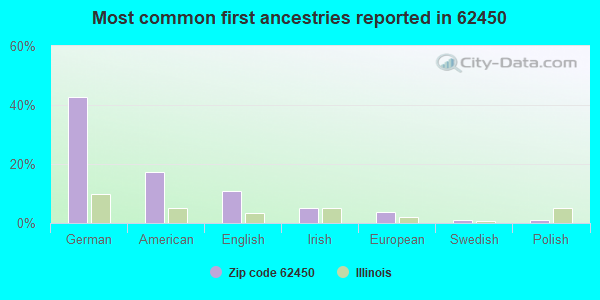
43%German
17%American
11%English
5%Irish
4%European
1%Swedish
1%Polish
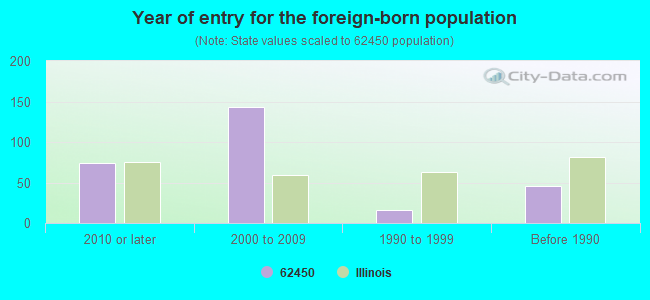
Year of entry for the foreign-born population
742010 or later
1432000 to 2009
161990 to 1999
46Before 1990
Major facilities with environmental interests located in this zip code:
PACIFIC CYCLE (4730 EAST RADIO TOWER LANE in OLNEY, IL)
STATE MASTER (Illinois EPA Project) - SOLID WASTE PROGRAM, HAZARDOUS WASTE PROGRAM, AIR PROGRAM, National Pollutant Discharge Elimination System Permit, AIR MINOR (AIRS/AFS) COMPLIANCE ACTIVITY (Tracking inspections of insecticide, fungicide, and rodenticide, and toxic substances) CRITERIA AND HAZARDOUS AIR POLLUTANT INVENTORY (Inventory of air pollution sources) Conditionally Exempt Small Quantity Generators, less than 100 kg/month of hazardous waste (Resource Conservation and Recovery Act (tracking hazardous waste)) HAZARDOUS WASTE BIENNIAL REPORTER (Resource Conservation and Recovery Act (tracking hazardous waste)) TSD (Resource Conservation and Recovery Act (tracking hazardous waste)) TRI REPORTER (Tracking of toxic chemicals releasing facilities) Business SIC classification: MOTORCYCLES, BICYCLES, AND PARTS; GAMES, TOYS, AND CHILDREN'S VEHICLES, EXCEPT DOLLS AND BICYCLES Business NAICS classification: MOTORCYCLE, BICYCLE, AND PARTS MANUFACTURING.; MOTORCYCLE, BICYCLE, AND PARTS MANUFACTURING. Organizations: CITY OF OLNEY (CONTACT/OWNER)
Alternative names: BRUNSWICK BICYCLES, PACIFIC CYCLE LLC, ROADMASTER CORPORATION, ROADMASTER CORPORATION-OLNEY, ROADMASTER DIV OF BRUNSWICK CORP
IMPERIAL TRAILER MFG & SALES (3519 N UNION DRIVE in OLNEY, IL)
STATE MASTER (Illinois EPA Project) - SOLID WASTE PROGRAM, HAZARDOUS WASTE PROGRAM, AIR PROGRAM AIR MINOR (AIRS/AFS) CRITERIA AND HAZARDOUS AIR POLLUTANT INVENTORY (Inventory of air pollution sources) Small Quantity Generators, between 100 kg and 1000 kg of hazardous waste/month (Resource Conservation and Recovery Act (tracking hazardous waste)) Business SIC classification: FABRICATED METAL PRODUCTS; MOTORCYCLES, BICYCLES, AND PARTS Business NAICS classification: TRUCK TRAILER MANUFACTURING. Organizations: IMPERIAL TRAILER MFG INC (CONTACT/OPERATOR)
, DARRELL D FEHRENBACHER (CONTACT/OWNER)
Alternative names: WEINMANN INC
CSX TRANSPORTATION INC (S FAIR & NORTH ST in OLNEY, IL)
STATE MASTER (Illinois EPA Project) - HAZARDOUS WASTE PROGRAM, SOLID WASTE PROGRAM (Resource Conservation and Recovery Act (tracking hazardous waste)) Business NAICS classification: LINE-HAUL RAILROADS.
KNAPP OIL CO INC (221 W LOCUST ST in OLNEY, IL)
STATE MASTER (Illinois EPA Project) - AIR PROGRAM AIR MINOR (AIRS/AFS) CRITERIA AND HAZARDOUS AIR POLLUTANT INVENTORY (Inventory of air pollution sources) Business SIC classification: PETROLEUM BULK STATIONS AND TERMINALS
MAGI-CARE CLEANERS (315 WHITTLE AVE in OLNEY, IL)
STATE MASTER (Illinois EPA Project) - HAZARDOUS WASTE PROGRAM (Resource Conservation and Recovery Act (tracking hazardous waste))
MARWI USA INC (3571 N UNION DR in OLNEY, IL)
STATE MASTER (Illinois EPA Project) - HAZARDOUS WASTE PROGRAM (Resource Conservation and Recovery Act (tracking hazardous waste))
RUB-R-TEK INC (3476 N. UNION DR. in OLNEY, IL)
STATE MASTER (Illinois EPA Project) - AIR PROGRAM AIR MINOR (AIRS/AFS) CRITERIA AND HAZARDOUS AIR POLLUTANT INVENTORY (Inventory of air pollution sources) Business SIC classification: CLAY REFRACTORIES
OLNEY STP (1001 SOUTH OAK STREET in OLNEY, IL)
STATE MASTER (Illinois EPA Project) - National Pollutant Discharge Elimination System Permit, National Pollutant Discharge Elimination System MAJOR (Tracking pollutant discharge elimination systems) - permit National Pollutant Discharge Elimination System NON-MAJOR (Tracking pollutant discharge elimination systems) - permit Business SIC classification: SEWERAGE SYSTEMS Alternative names: OLNEY SEWAGE TREATMENT PLANT, OLNEY STP CITY OF
RICHLAND MEMORIAL HOSPITAL INC (800 E LOCUST ST in OLNEY, IL)
STATE MASTER (Illinois EPA Project) - SOLID WASTE PROGRAM, AIR PROGRAM AIR MINOR (AIRS/AFS) CRITERIA AND HAZARDOUS AIR POLLUTANT INVENTORY (Inventory of air pollution sources) Business SIC and NAICS classification: GENERAL MEDICAL AND SURGICAL HOSPITALS
MID-ILLINOIS CONCRETE INC (1741 SOUTH WHITTLE AVENUE in OLNEY, IL)
STATE MASTER (Illinois EPA Project) - AIR PROGRAM AIR MINOR (AIRS/AFS) CRITERIA AND HAZARDOUS AIR POLLUTANT INVENTORY (Inventory of air pollution sources) Business SIC classification: READY-MIXED CONCRETE Business NAICS classification: READY-MIX CONCRETE MANUFACTURING. Alternative names: OLNEY READY MIX
OLNEY CLEANERS (410 E MAIN ST in OLNEY, IL)
STATE MASTER (Illinois EPA Project) - AIR PROGRAM AIR MINOR (AIRS/AFS) CRITERIA AND HAZARDOUS AIR POLLUTANT INVENTORY (Inventory of air pollution sources) Business SIC classification: DRYCLEANING PLANTS, EXCEPT RUG CLEANING
RICH LAW SERVICE COMPANY (1201 SOUTH WHITTLE AVENUE in OLNEY, IL)
AIR MINOR (AIRS/AFS) ENFORCEMENT/COMPLIANCE ACTIVITY (Integrated Compliance Information System) COMPLIANCE ACTIVITY (Tracking inspections of insecticide, fungicide, and rodenticide, and toxic substances) CRITERIA AND HAZARDOUS AIR POLLUTANT INVENTORY (Inventory of air pollution sources) (Resource Conservation and Recovery Act (tracking hazardous waste)) Business SIC classification: FARM SUPPLIES; BOOKS, PERIODICALS, AND NEWSPAPERS Alternative names: WABASH VALEY SERVICE GROUP, WABASH VALLEY SERVICE GROUP
PHILLIPS PETROLEUM CO (PINE & MULBERRY in OLNEY, IL)
STATE MASTER (Illinois EPA Project) - AIR PROGRAM AIR MINOR (AIRS/AFS) Business SIC classification: PETROLEUM BULK STATIONS AND TERMINALS
Housing units lacking complete plumbing facilities: 2.9% Housing units lacking complete kitchen facilities: 5.2%
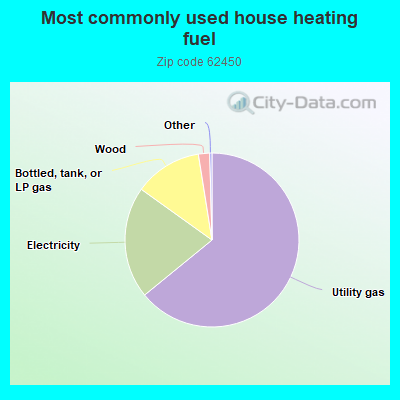
64.1%Utility gas
20.8%Electricity
12.6%Bottled, tank, or LP gas
2.1%Wood
Population in 1990: 11,163. Population change in the 1990s: +737 (+6.6%).
Place of birth for U.S.-born residents:
This state: 9,199
Northeast: 293
Midwest: 1,591
South: 543
West: 213
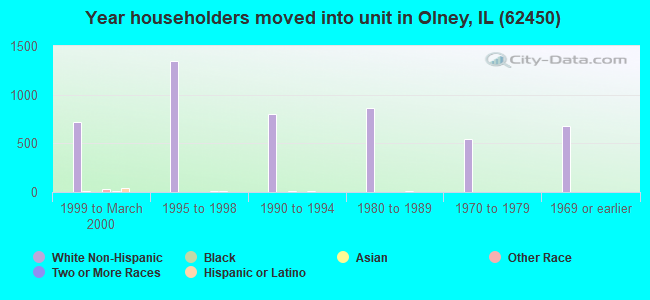
61% of the 62450 zip code residents lived in the same house 5 years ago. Out of people who lived in different houses, 59% lived in this county. Out of people who lived in different counties, 50% lived in Illinois.
89% of the 62450 zip code residents lived in the same house 1 year ago. Out of people who lived in different houses, 65% moved from this county. Out of people who lived in different houses, 27% moved from different county within same state. Out of people who lived in different houses, 6% moved from different state.
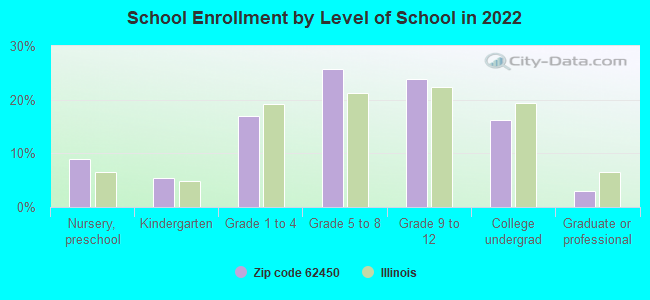
Private vs. public school enrollment:
Students in private schools in grades 1 to 8 (elementary and middle school): 260
Here:
22.5%
Illinois:
13.3%
Students in private schools in grades 9 to 12 (high school): 42
Here:
6.7%
Illinois:
9.9%
Students in private undergraduate colleges: 52
Here:
12.2%
Illinois:
27.4%
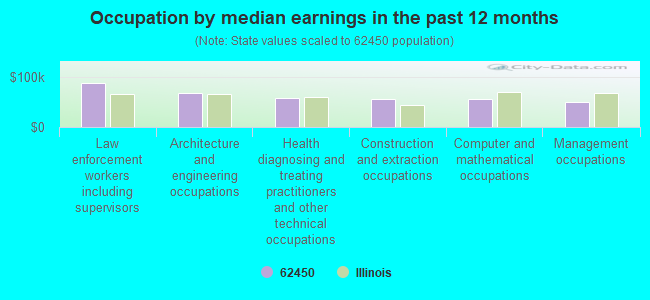
Occupation by median earnings in the past 12 months ($)
88,498Law enforcement workers including supervisors
68,850Architecture and engineering occupations
58,547Health diagnosing and treating practitioners and other technical occupations
57,035Construction and extraction occupations
55,971Computer and mathematical occupations
49,397Management occupations
Top industries in this zip code by the number of employees in 2005:
273 people in nursing facilities/skilled-nursing facilities
35 people in other noninstitutional facilities
29 people in local jails and other municipal confinement facilities
21 people in group homes intended for adults
6 people in residential treatment centers for adults
People in group quarters in 2000:
92 people in nursing homes
15 people in mental (psychiatric) hospitals or wards
12 people in other noninstitutional group quarters
10 people in local jails and other confinement facilities (including police lockups)
10 people in other group homes
Fatal accident statistics in 2012:
Fatal accident count: 2
Vehicles involved in fatal accidents: 3
Fatal accidents caused by drunken drivers: 1
Fatalities: 2
Persons involved in fatal accidents: 3
Pedestrians involved in fatal accidents: 0
2002 - 2018 National Fire Incident Reporting System (NFIRS) incidents
Based on the data from the years 2002 - 2018 the average number of fire incidents per year is 63. The highest number of fire incidents - 103 took place in 2012, and the least - 2 in 2003. The data has a dropping trend.
When looking into fire subcategories, the most incidents belonged to: Structure Fires (43.3%), and Outside Fires (37.4%).
Fire incident types reported to NFIRS in Zip Code 62450
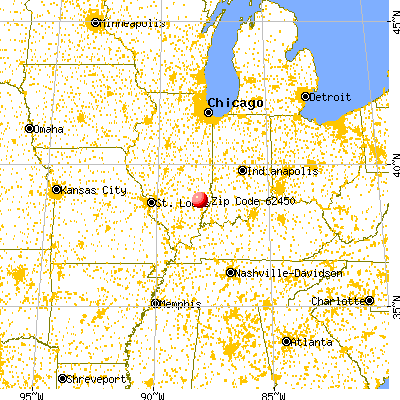


 Nearest zip codes: 62425, 62419, 62868, 62452, 62421, 62475.


 Based on the data from the years 2002 - 2018 the average number of fire incidents per year is 63. The highest number of fire incidents - 103 took place in 2012, and the least - 2 in 2003. The data has a dropping trend.
 When looking into fire subcategories, the most incidents belonged to: Structure Fires (43.3%), and Outside Fires (37.4%).