Estimated zip code population in 2022: 2,211 Zip code population in 2010: 2,661 Zip code population in 2000: 1,566
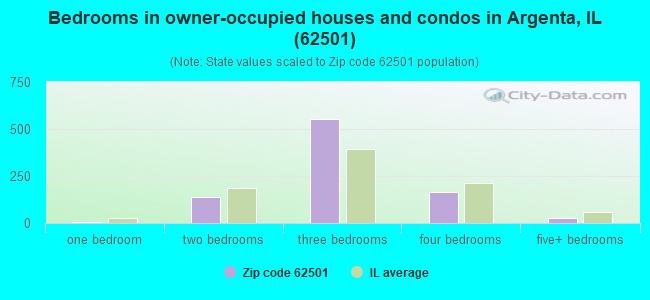
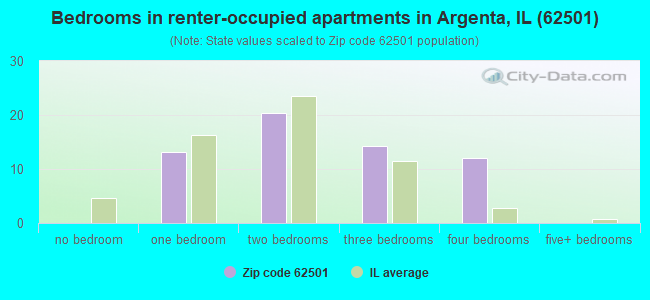
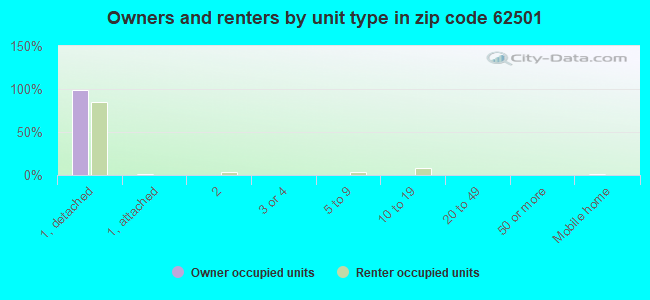
Houses and condos: 1,063 Renter-occupied apartments: 61
% of renters here:
6%
State:
33%
March 2022 cost of living index in zip code 62501: 85.2 (less than average, U.S. average is 100)
Land area: 79.3 sq. mi. Water area: 0.3 sq. mi.
Population density: 28 people per square mile
(very low).
OSM Map
General Map
Google Map
MSN Map
OSM Map
General Map
Google Map
MSN Map
OSM Map
General Map
Google Map
MSN Map
OSM Map
General Map
Google Map
MSN Map
Please wait while loading the map...
Real estate property taxes paid for housing units in 2022:
This zip code:
1.8% ($3,334)
Illinois:
2.0% ($4,912)
Median real estate property taxes paid for housing units with mortgages in 2022: $3,148 (1.5%) Median real estate property taxes paid for housing units with no mortgage in 2022: $3,500 (2.1%)
Business Search- 14 Million verified businesses
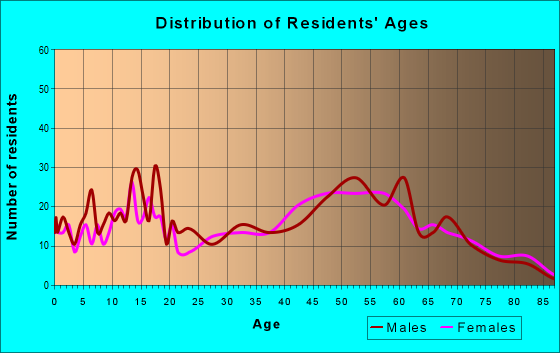
Males: 1,105
(50.0%)
Females: 1,106
(50.0%)
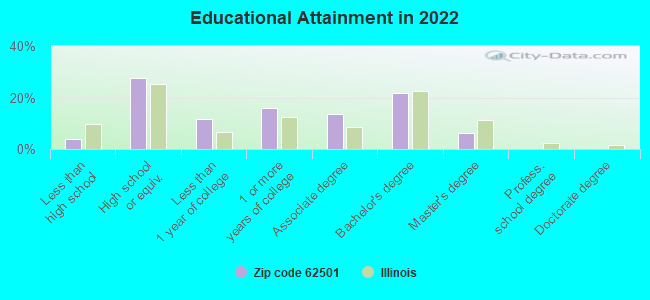
For population 25 years and over in 62501:
High school or higher: 95.4%
Bachelor's degree or higher: 27.6%
Graduate or professional degree: 6.1%
Unemployed: 4.9%
Mean travel time to work (commute): 23.2 minutes
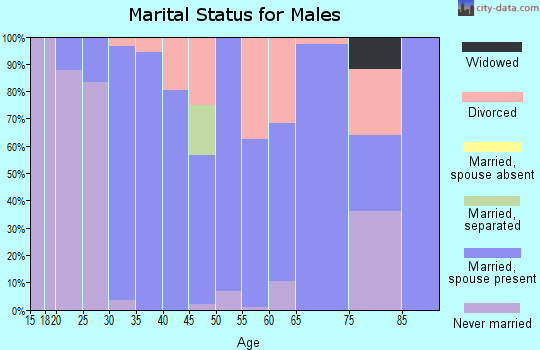
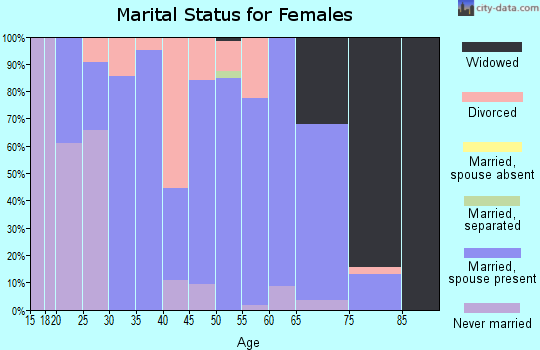
For population 15 years and over in 62501:
Never married: 17.1%
Now married: 69.3%
Separated: 0.4%
Widowed: 2.5%
Divorced: 10.7%
Zip code 62501 compared to state average:
Black race population percentage significantly below state average.
Hispanic race population percentage significantly below state average.
Median age significantly above state average.
Foreign-born population percentage significantly below state average.
Renting percentage significantly below state average.
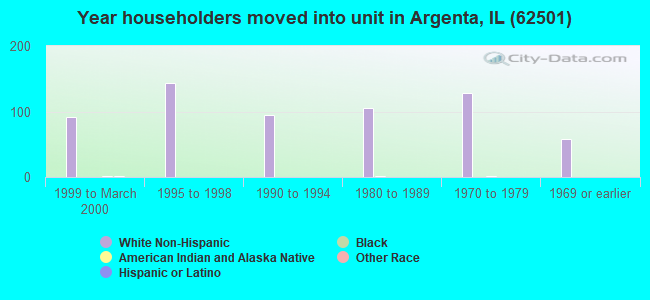
Length of stay since moving in significantly above state average.
Estimated median house/condo value in 2022: $185,412
62501:
$185,412
Illinois:
$251,600
According to our research of Illinois and other state lists, there were 2 registered sex offenders living in 62501 zip code as of April 25, 2024. The ratio of all residents to sex offenders in zip code 62501 is 1,430 to 1. The ratio of registered sex offenders to all residents in this zip code is lower than the state average.
Median resident age:
This zip code:
48.1 years
Illinois median age:
39.1 years
Average household size:
This zip code:
2.3 people
Illinois:
2.4 people
Averages for the 2020 tax year for zip code 62501, filed in 2021:
Average Adjusted Gross Income (AGI) in 2020: $72,487 (Individual Income Tax Returns)
Here:
$72,487
State:
$82,626
Salary/wage: $61,950 (reported on 77.7% of returns)
Here:
$61,950
State:
$66,640
(% of AGI for various income ranges: 915.5% for AGIs below $25k, 3223.5% for AGIs $25k-50k, 5693.3% for AGIs $50k-75k, 8850.0% for AGIs $75k-100k, 14183.8% for AGIs $100k-200k)
Taxable interest for individuals: $960 (reported on 43.8% of returns)
This zip code:
$960
Illinois:
$2,376
(% of AGI for various income ranges: 40.5% for AGIs below $25k, 23.5% for AGIs $25k-50k, 32.7% for AGIs $50k-75k, 49.0% for AGIs $75k-100k, 88.8% for AGIs $100k-200k)
Ordinary dividends: $2,406 (reported on 25.6% of returns)
Here:
$2,406
State:
$9,061
(% of AGI for various income ranges: 20.5% for AGIs below $25k, 46.0% for AGIs $25k-50k, 80.7% for AGIs $50k-75k, 78.0% for AGIs $75k-100k, 175.0% for AGIs $100k-200k)
Net capital gain/loss in AGI: +$11,070 (reported on 19.0% of returns)
Here:
+$11,070
State:
+$31,684
(% of AGI for various income ranges: 9.1% for AGIs below $25k, 74.0% for AGIs $25k-50k, 86.7% for AGIs $50k-75k, 76.0% for AGIs $75k-100k, 391.2% for AGIs $100k-200k)
Profit/loss from business: +$10,607 (reported on 12.4% of returns)
Here:
+$10,607
State:
+$12,175
(% of AGI for various income ranges: 57.3% for AGIs below $25k, 192.5% for AGIs $25k-50k, 153.0% for AGIs $75k-100k, 579.4% for AGIs $100k-200k)
Taxable individual retirement arrangement distribution: $15,850 (reported on 14.9% of returns)
62501:
$15,850
Illinois:
$21,613
(% of AGI for various income ranges: 103.2% for AGIs below $25k, 186.5% for AGIs $25k-50k, 482.7% for AGIs $50k-75k, 955.6% for AGIs $100k-200k)
Total itemized deductions: $27,383 (reported on 5.0% of returns)
Here:
$27,383
State:
$34,948
(% of AGI for various income ranges: 494.0% for AGIs $50k-75k, 563.8% for AGIs $100k-200k)
Charity contributions: $9,650 (reported on 3.3% of returns)
Here:
$9,650
State:
$13,122
(% of AGI for various income ranges: 241.2% for AGIs $100k-200k)
Taxes paid: $7,833 (reported on 5.0% of returns)
62501:
$7,833
State:
$8,563
(% of AGI for various income ranges: 118.7% for AGIs $50k-75k, 182.5% for AGIs $100k-200k)
Earned income credit: $2,162 (reported on 10.7% of returns)
Here:
$2,162
State:
$2,311
(% of AGI for various income ranges: 71.4% for AGIs below $25k, 62.0% for AGIs $25k-50k)
Percentage of individuals using paid preparers for their 2020 taxes: 93.4%
Here:
93%
State:
93%
(% for various income ranges: 93.3% for AGIs below $25k, 92.6% for AGIs $25k-50k, 90.5% for AGIs $50k-75k, 92.9% for AGIs $75k-100k, 95.8% for AGIs $100k-200k, 100.0% for AGIs over 200k)
Averages for the 2012 tax year for zip code 62501, filed in 2013:
Average Adjusted Gross Income (AGI) in 2012: $62,545 (Individual Income Tax Returns)
Here:
$62,545
State:
$68,058
Salary/wage: $51,128 (reported on 84.4% of returns)
Here:
$51,128
State:
$55,396
(% of AGI for various income ranges: 68.5% for AGIs below $25k, 67.6% for AGIs $25k-50k, 75.3% for AGIs $50k-75k, 68.2% for AGIs $75k-100k, 79.8% for AGIs $100k-200k, 46.3% for AGIs over 200k)
Taxable interest for individuals: $772 (reported on 47.5% of returns)
This zip code:
$772
Illinois:
$1,969
(% of AGI for various income ranges: 1.9% for AGIs below $25k, 0.8% for AGIs $25k-50k, 0.5% for AGIs $50k-75k, 0.5% for AGIs $75k-100k, 0.4% for AGIs $100k-200k, 0.6% for AGIs over 200k)
Ordinary dividends: $2,600 (reported on 21.3% of returns)
Here:
$2,600
State:
$7,786
(% of AGI for various income ranges: 0.6% for AGIs below $25k, 0.4% for AGIs $25k-50k, 0.8% for AGIs $50k-75k, 0.6% for AGIs $75k-100k, 0.8% for AGIs $100k-200k, 2.0% for AGIs over 200k)
Net capital gain/loss in AGI: +$5,894 (reported on 13.9% of returns)
Here:
+$5,894
State:
+$22,183
(% of AGI for various income ranges: 0.2% for AGIs $50k-75k, 1.2% for AGIs $100k-200k, 5.6% for AGIs over 200k)
Profit/loss from business: +$7,462 (reported on 13.1% of returns)
Here:
+$7,462
State:
+$12,903
(% of AGI for various income ranges: 4.7% for AGIs below $25k, 3.4% for AGIs $25k-50k, 2.0% for AGIs $50k-75k, 1.9% for AGIs $75k-100k, 0.6% for AGIs $100k-200k)
Taxable individual retirement arrangement distribution: $9,800 (reported on 13.1% of returns)
62501:
$9,800
Illinois:
$17,929
(% of AGI for various income ranges: 2.5% for AGIs below $25k, 2.2% for AGIs $25k-50k, 1.8% for AGIs $50k-75k, 3.9% for AGIs $75k-100k, 2.0% for AGIs $100k-200k)
Total itemized deductions: $18,981 (17% of AGI, reported on 29.5% of returns)
Here:
$18,981
State:
$26,433
Here:
16.9% of AGI
State:
19.2% of AGI
(% of AGI for various income ranges: 5.4% for AGIs below $25k, 6.9% for AGIs $25k-50k, 8.5% for AGIs $50k-75k, 9.0% for AGIs $75k-100k, 10.8% for AGIs $100k-200k, 9.0% for AGIs over 200k)
Charity contributions: $3,781 (reported on 22.1% of returns)
Here:
$3,781
State:
$4,525
(% of AGI for various income ranges: 0.7% for AGIs $25k-50k, 1.2% for AGIs $50k-75k, 1.4% for AGIs $75k-100k, 1.4% for AGIs $100k-200k, 2.3% for AGIs over 200k)
Taxes paid: $8,592 (reported on 29.5% of returns)
62501:
$8,592
State:
$11,968
(% of AGI for various income ranges: 1.1% for AGIs below $25k, 2.2% for AGIs $25k-50k, 3.4% for AGIs $50k-75k, 3.4% for AGIs $75k-100k, 5.5% for AGIs $100k-200k, 5.2% for AGIs over 200k)
Earned income credit: $2,383 (reported on 9.8% of returns)
Here:
$2,383
State:
$2,349
(% of AGI for various income ranges: 4.9% for AGIs below $25k, 0.6% for AGIs $25k-50k)
Percentage of individuals using paid preparers for their 2012 taxes: 65.6%
Here:
66%
State:
57%
(% for various income ranges: 58.5% for AGIs below $25k, 66.7% for AGIs $25k-50k, 68.4% for AGIs $50k-75k, 70.6% for AGIs $75k-100k, 70.6% for AGIs $100k-200k, 75.0% for AGIs over 200k)
Averages for the 2004 tax year for zip code 62501, filed in 2005:
Average Adjusted Gross Income (AGI) in 2004: $48,452 (Individual Income Tax Returns)
Here:
$48,452
State:
$54,625
Salary/wage: $43,813 (reported on 86.2% of returns)
Here:
$43,813
State:
$46,811
(% of AGI for various income ranges: 97.7% for AGIs below $10k, 65.1% for AGIs $10k-25k, 80.7% for AGIs $25k-50k, 79.5% for AGIs $50k-75k, 85.2% for AGIs $75k-100k, 71.9% for AGIs over 100k)
Taxable interest for individuals: $1,130 (reported on 61.7% of returns)
This zip code:
$1,130
Illinois:
$2,101
(% of AGI for various income ranges: 5.3% for AGIs below $10k, 3.6% for AGIs $10k-25k, 1.3% for AGIs $25k-50k, 1.1% for AGIs $50k-75k, 1.0% for AGIs $75k-100k, 1.4% for AGIs over 100k)
Taxable dividends: $1,889 (reported on 27.4% of returns)
Here:
$1,889
State:
$4,306
(% of AGI for various income ranges: 2.4% for AGIs below $10k, 1.0% for AGIs $10k-25k, 0.7% for AGIs $25k-50k, 1.2% for AGIs $50k-75k, 0.5% for AGIs $75k-100k, 1.5% for AGIs over 100k)
Net capital gain/loss: +$2,839 (reported on 15.4% of returns)
Here:
+$2,839
State:
+$17,321
(% of AGI for various income ranges: -2.2% for AGIs below $10k, 0.2% for AGIs $10k-25k, 0.6% for AGIs $25k-50k, 0.7% for AGIs $50k-75k, 0.8% for AGIs $75k-100k, 1.7% for AGIs over 100k)
Profit/loss from business: +$4,467 (reported on 14.8% of returns)
Here:
+$4,467
State:
+$11,771
(% of AGI for various income ranges: 4.4% for AGIs below $10k, 3.2% for AGIs $10k-25k, 1.7% for AGIs $25k-50k, 1.8% for AGIs $50k-75k, 0.6% for AGIs $75k-100k, 0.7% for AGIs over 100k)
Profit/loss from farming: +$388 (reported on 5.4% of returns)
Here:
+$388
State:
+$2,327
(% of AGI for various income ranges: -7.3% for AGIs below $10k, -1.3% for AGIs $25k-50k, -0.6% for AGIs $50k-75k, 1.8% for AGIs over 100k)
IRA payment deduction: $3,333 (reported on 3.1% of returns)
62501:
$3,333
Illinois:
$3,087
Total itemized deductions: $15,168 (18% of AGI, reported on 25.3% of returns)
Here:
$15,168
State:
$20,239
Here:
18.0% of AGI
State:
19.5% of AGI
(% of AGI for various income ranges: 5.3% for AGIs $10k-25k, 8.0% for AGIs $25k-50k, 7.3% for AGIs $50k-75k, 9.4% for AGIs $75k-100k, 8.4% for AGIs over 100k)
Charity contributions deductions: $3,307 (4% of AGI, reported on 21.2% of returns)
Here:
$3,307
State:
$3,719
Here:
3.7% of AGI
State:
3.4% of AGI
(% of AGI for various income ranges: 0.4% for AGIs $10k-25k, 0.9% for AGIs $25k-50k, 1.2% for AGIs $50k-75k, 1.6% for AGIs $75k-100k, 2.2% for AGIs over 100k)
Total tax: $6,965 (reported on 78.7% of returns)
62501:
$6,965
State:
$9,882
(% of AGI for various income ranges: 2.0% for AGIs below $10k, 4.3% for AGIs $10k-25k, 6.6% for AGIs $25k-50k, 8.7% for AGIs $50k-75k, 10.8% for AGIs $75k-100k, 18.9% for AGIs over 100k)
Earned income credit: $1,560 (reported on 8.8% of returns)
Here:
$1,560
State:
$1,788
Percentage of individuals using paid preparers for their 2004 taxes: 60.6%
Here:
61%
State:
61%
(% for various income ranges: 45.8% for AGIs below $10k, 64.1% for AGIs $10k-25k, 66.2% for AGIs $25k-50k, 65.6% for AGIs $50k-75k, 57.1% for AGIs $75k-100k, 64.1% for AGIs over 100k)
Household received Food Stamps/SNAP in the past 12 months: 51 Household did not receive Food Stamps/SNAP in the past 12 months: 880
Women who had a birth in the past 12 months: 16 (4 now married, 11 unmarried) Women who did not have a birth in the past 12 months: 381 (261 now married, 116 unmarried)
Housing units in zip code 62501 with a mortgage: 388 (12 second mortgage, 9 both second mortgage and home equity loan) Houses without a mortgage: 27
Median monthly owner costs for units with a mortgage: $1,341 Median monthly owner costs for units without a mortgage: $568
Residents with income below the poverty level in 2022:
This zip code:
10.5%
Whole state:
11.9%
Residents with income below 50% of the poverty level in 2022:
This zip code:
8.6%
Whole state:
5.7%
Median number of rooms in houses and condos:
Here:
6.8
State:
6.4
Median number of rooms in apartments:
Here:
5.4
State:
4.1
Notable locations in this zip code not listed on our city pages
Size of family households: 425 2-persons, 172 3-persons, 72 4-persons, 57 5-persons, 1 6-persons, 2 7-or-more-persons
Size of nonfamily households: 169 1-person, 37 2-persons
357 married couples with children.
103 single-parent households (43 men, 60 women).
97.7% of residents of 62501 zip code speak English at home.
0.2% of residents speak Spanish at home (100% very well).
1.7% of residents speak other Indo-European language at home (100% very well).
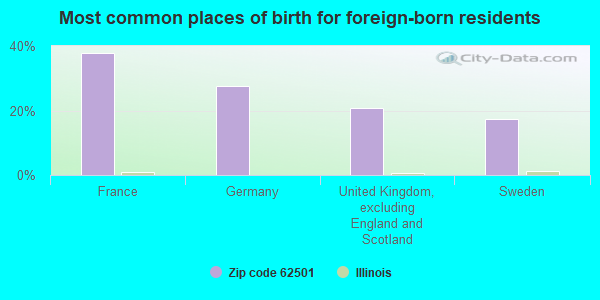
Foreign born population: 29 (1.3%) (62.3% of them are naturalized citizens)
This zip code:
1.3%
Whole state:
14.4%
38%France
28%Germany
21%United Kingdom, excluding England and Scotland
17%Sweden
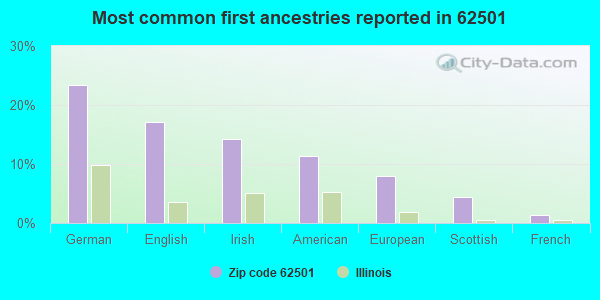
23%German
17%English
14%Irish
11%American
8%European
4%Scottish
1%French
Year of entry for the foreign-born population
02010 or later
02000 to 2009
01990 to 1999
28Before 1990
Facilities with environmental interests located in this zip code:
ASHLAND CHEMICAL INC- I C & S DIV (281 WEST ELM STREET in ARGENTA, IL)
STATE MASTER (Illinois EPA Project) - SOLID WASTE PROGRAM, AIR PROGRAM AIR MINOR (AIRS/AFS) Large Quantity Generators, more that 1000 kg of hazardous waste/month (Resource Conservation and Recovery Act (tracking hazardous waste)) - notification TRANSPORTER (Resource Conservation and Recovery Act (tracking hazardous waste)) - notification Business SIC classification: PETROLEUM BULK STATIONS AND TERMINALS Alternative names: ASHLAND CHEMICAL CO
CLARKSON GRAIN CO (RURAL ROUTE in OAKLEY, IL)
STATE MASTER (Illinois EPA Project) - AIR PROGRAM AIR MINOR (AIRS/AFS) CRITERIA AND HAZARDOUS AIR POLLUTANT INVENTORY (Inventory of air pollution sources) Business SIC classification: GRAIN AND FIELD BEANS
ALMOST HOME (1520 N ILLINI RD in OAKLEY, IL)
STATE MASTER (Illinois EPA Project) - AIR PROGRAM AIR MINOR (AIRS/AFS) Business SIC classification: FUNERAL SERVICE AND CREMATORIES
ARGENTA WTP (131 NORTH KENWOOD STREET in ARGENTA, IL)
STATE MASTER (Illinois EPA Project) - National Pollutant Discharge Elimination System Permit National Pollutant Discharge Elimination System NON-MAJOR (Tracking pollutant discharge elimination systems) - permit Business SIC classification: WATER SUPPLY Alternative names: ARGENTA WTP, VILLAGE OF
ARGENTA-OREANA HIGH SCHOOL (500 N MAIN ST in ARGENTA, IL)
STATE MASTER (Illinois EPA Project) - HAZARDOUS WASTE PROGRAM Small Quantity Generators, between 100 kg and 1000 kg of hazardous waste/month (Resource Conservation and Recovery Act (tracking hazardous waste))
PC LTD (9223 N. ROUTE 48 in ARGENTA, IL)
STATE MASTER (Illinois EPA Project) - AIR PROGRAM AIR MINOR (AIRS/AFS) Business SIC classification: FERTILIZERS, MIXING ONLY
CISCO COOPERATIVE GRAIN CO (NORTH in ARGENTA, IL)
STATE MASTER (Illinois EPA Project) - AIR PROGRAM AIR MINOR (AIRS/AFS) Business SIC classification: GRAIN AND FIELD BEANS
ARGENTA-OREANA HIGH SCHOOL (PO BOX 469 in ARGENTA, IL)
(Geographic Names Information System) (National Center for Education Statistics) - STATE ID-3905500100001 Organizations: ARGENTA-OREANA COMM UNIT SCH D 1 (SCHOOL DISTRICT)
ARGENTA-OREANA EARLY LEARNING CTR (PO BOX 470 in ARGENTA, IL)
(National Center for Education Statistics) - STATE ID-3905500102005 Organizations: ARGENTA-OREANA COMM UNIT SCH D 1 (SCHOOL DISTRICT)
ARGENTA-OREANA JR HIGH SCHOOL (PO BOX 439 in ARGENTA, IL)
(National Center for Education Statistics) - STATE ID-3905500101001 Organizations: ARGENTA-OREANA COMM UNIT SCH D 1 (SCHOOL DISTRICT)
ILDOT STA 789 54 75 (FAI RTE 72 OVER RT 48 SEC S8 6 in NEAR ARGENTA, IL)
(Resource Conservation and Recovery Act (tracking hazardous waste)) Organizations: IL DEPT OF TRANSPORTATION (CONTACT/OWNER)
Housing units lacking complete plumbing facilities: 2.2% Housing units lacking complete kitchen facilities: 2.4%
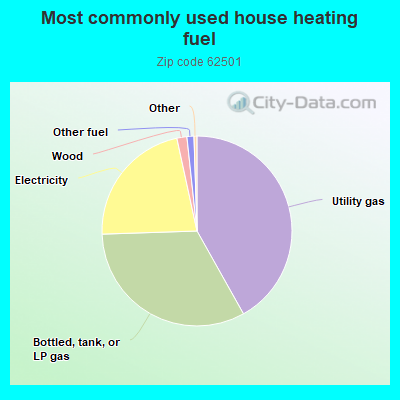
42.0%Utility gas
32.7%Bottled, tank, or LP gas
22.2%Electricity
1.7%Wood
1.2%Other fuel
Population in 1990: 1,444. Population change in the 1990s: +122 (+8.4%).
Place of birth for U.S.-born residents:
This state: 1,939
Northeast: 18
Midwest: 103
South: 72
West: 37
64% of the 62501 zip code residents lived in the same house 5 years ago. Out of people who lived in different houses, 70% lived in this county. Out of people who lived in different counties, 50% lived in Illinois.
99% of the 62501 zip code residents lived in the same house 1 year ago. Out of people who lived in different houses, 78% moved from this county. Out of people who lived in different houses, 22% moved from different county within same state.
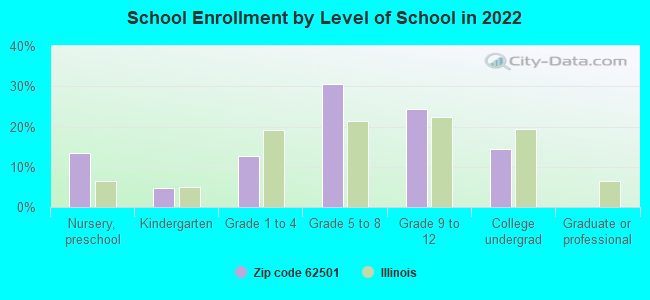
Private vs. public school enrollment:
Students in private schools in grades 1 to 8 (elementary and middle school): 38
Here:
17.9%
Illinois:
13.3%
Students in private schools in grades 9 to 12 (high school): 11
Here:
10.0%
Illinois:
9.9%
Students in private undergraduate colleges: 6
Here:
9.3%
Illinois:
27.4%
Occupation by median earnings in the past 12 months ($)
82,935Management occupations
68,769Installation, maintenance, and repair occupations
60,576Construction and extraction occupations
59,246Health technologists and technicians
56,697Life, physical, and social science occupations
52,377Community and social service occupations
Top industries in this zip code by the number of employees in 2005:
Administrative and Support and Waste Management and Remediation Services: Landscaping Services (10-19 employees: 2 establishments, 5-9 employees: 1 establishment, 1-4 employees: 5 establishments)
Finance and Insurance: Commercial Banking (20-49: 1)
Administrative and Support and Waste Management and Remediation Services: Janitorial Services (10-19: 2, 1-4: 1)
Construction: Commercial and Institutional Building Construction (10-19: 1, 5-9: 1)
Construction: Industrial Building Construction (10-19: 1)
Construction: Other Heavy and Civil Engineering Construction (10-19: 1)
Construction: Masonry Contractors (10-19: 1)
Construction: Roofing Contractors (10-19: 1)
Fatal accident statistics in 2014:
Fatal accident count: 2
Vehicles involved in fatal accidents: 2
Fatal accidents caused by drunken drivers: 1
Fatalities: 2
Persons involved in fatal accidents: 6
Pedestrians involved in fatal accidents: 0
Fatal accident statistics in 2013:
Fatal accident count: 2
Vehicles involved in fatal accidents: 3
Fatal accidents caused by drunken drivers: 0
Fatalities: 2
Persons involved in fatal accidents: 3
Pedestrians involved in fatal accidents: 0
Home Mortgage Disclosure Act Aggregated Statistics For Year 2009 (Based on 4 partial tracts)
A) FHA, FSA/RHS & VA Home Purchase Loans
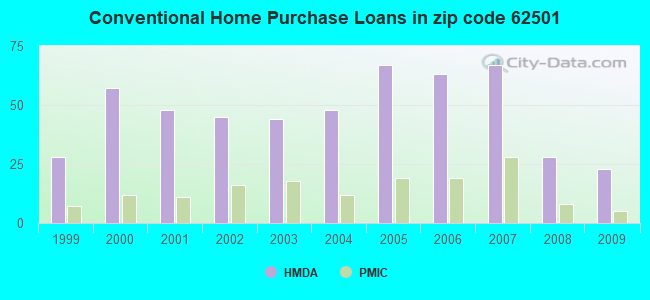
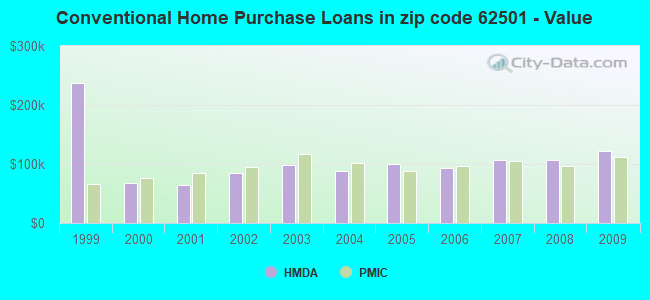
B) Conventional Home Purchase Loans
C) Refinancings
D) Home Improvement Loans
F) Non-occupant Loans on < 5 Family Dwellings (A B C & D)
G) Loans On Manufactured Home Dwelling (A B C & D)
Number
Average Value
Number
Average Value
Number
Average Value
Number
Average Value
Number
Average Value
Number
Average Value
LOANS ORIGINATED
21
$95,609
23
$121,277
85
$135,011
6
$65,283
5
$51,578
0
$0
APPLICATIONS APPROVED, NOT ACCEPTED
1
$70,390
3
$83,827
6
$119,117
1
$68,890
1
$33,700
0
$0
APPLICATIONS DENIED
2
$79,675
3
$93,800
21
$112,627
4
$41,050
1
$86,110
1
$27,850
APPLICATIONS WITHDRAWN
1
$102,520
1
$73,890
20
$114,862
1
$51,770
0
$0
0
$0
FILES CLOSED FOR INCOMPLETENESS
0
$0
0
$0
3
$120,120
0
$0
0
$0
0
$0
Aggregated Statistics For Year 2008 (Based on 4 partial tracts)
A) FHA, FSA/RHS & VA Home Purchase Loans
B) Conventional Home Purchase Loans
C) Refinancings
D) Home Improvement Loans
E) Loans on Dwellings For 5+ Families
F) Non-occupant Loans on < 5 Family Dwellings (A B C & D)
G) Loans On Manufactured Home Dwelling (A B C & D)
Number
Average Value
Number
Average Value
Number
Average Value
Number
Average Value
Number
Average Value
Number
Average Value
Number
Average Value
LOANS ORIGINATED
24
$94,144
28
$107,272
44
$142,469
9
$59,178
1
$349,160
8
$42,640
0
$0
APPLICATIONS APPROVED, NOT ACCEPTED
1
$114,570
2
$111,930
6
$210,100
1
$93,670
0
$0
0
$0
0
$0
APPLICATIONS DENIED
0
$0
5
$93,990
30
$130,898
13
$58,047
0
$0
1
$81,040
1
$77,660
APPLICATIONS WITHDRAWN
3
$63,830
3
$80,297
11
$107,383
1
$57,660
0
$0
0
$0
0
$0
FILES CLOSED FOR INCOMPLETENESS
0
$0
0
$0
3
$181,630
0
$0
0
$0
0
$0
0
$0
Aggregated Statistics For Year 2007 (Based on 4 partial tracts)
A) FHA, FSA/RHS & VA Home Purchase Loans
B) Conventional Home Purchase Loans
C) Refinancings
D) Home Improvement Loans
F) Non-occupant Loans on < 5 Family Dwellings (A B C & D)
G) Loans On Manufactured Home Dwelling (A B C & D)
Number
Average Value
Number
Average Value
Number
Average Value
Number
Average Value
Number
Average Value
Number
Average Value
LOANS ORIGINATED
9
$96,831
67
$106,944
50
$106,950
15
$53,668
10
$67,022
1
$83,790
APPLICATIONS APPROVED, NOT ACCEPTED
0
$0
5
$136,366
10
$96,178
1
$89,560
4
$154,440
0
$0
APPLICATIONS DENIED
0
$0
8
$79,101
38
$89,054
22
$56,055
2
$13,955
1
$23,840
APPLICATIONS WITHDRAWN
0
$0
1
$75,950
21
$111,517
4
$120,275
1
$45,300
0
$0
FILES CLOSED FOR INCOMPLETENESS
1
$79,460
2
$73,445
5
$122,560
1
$127,300
1
$17,220
0
$0
Aggregated Statistics For Year 2006 (Based on 4 partial tracts)
A) FHA, FSA/RHS & VA Home Purchase Loans
B) Conventional Home Purchase Loans
C) Refinancings
D) Home Improvement Loans
E) Loans on Dwellings For 5+ Families
F) Non-occupant Loans on < 5 Family Dwellings (A B C & D)
G) Loans On Manufactured Home Dwelling (A B C & D)
Number
Average Value
Number
Average Value
Number
Average Value
Number
Average Value
Number
Average Value
Number
Average Value
Number
Average Value
LOANS ORIGINATED
13
$87,002
63
$92,741
40
$86,940
14
$34,356
1
$158,750
6
$54,555
1
$60,290
APPLICATIONS APPROVED, NOT ACCEPTED
0
$0
6
$83,192
7
$91,136
1
$27,450
0
$0
0
$0
0
$0
APPLICATIONS DENIED
0
$0
13
$82,015
39
$76,717
12
$57,072
0
$0
3
$49,110
1
$24,520
APPLICATIONS WITHDRAWN
0
$0
6
$115,820
23
$100,289
3
$56,160
0
$0
0
$0
0
$0
FILES CLOSED FOR INCOMPLETENESS
0
$0
0
$0
6
$91,667
1
$28,940
0
$0
0
$0
0
$0
Aggregated Statistics For Year 2005 (Based on 4 partial tracts)
A) FHA, FSA/RHS & VA Home Purchase Loans
B) Conventional Home Purchase Loans
C) Refinancings
D) Home Improvement Loans
F) Non-occupant Loans on < 5 Family Dwellings (A B C & D)
G) Loans On Manufactured Home Dwelling (A B C & D)
Number
Average Value
Number
Average Value
Number
Average Value
Number
Average Value
Number
Average Value
Number
Average Value
LOANS ORIGINATED
10
$92,865
67
$99,963
56
$95,966
18
$40,761
9
$51,130
0
$0
APPLICATIONS APPROVED, NOT ACCEPTED
1
$46,320
1
$131,130
15
$83,815
0
$0
1
$114,370
1
$67,100
APPLICATIONS DENIED
0
$0
10
$60,583
40
$82,996
6
$47,782
0
$0
3
$26,000
APPLICATIONS WITHDRAWN
0
$0
4
$136,515
29
$93,292
2
$117,265
0
$0
0
$0
FILES CLOSED FOR INCOMPLETENESS
0
$0
1
$70,840
7
$92,060
0
$0
0
$0
0
$0
Aggregated Statistics For Year 2004 (Based on 4 partial tracts)
A) FHA, FSA/RHS & VA Home Purchase Loans
B) Conventional Home Purchase Loans
C) Refinancings
D) Home Improvement Loans
E) Loans on Dwellings For 5+ Families
F) Non-occupant Loans on < 5 Family Dwellings (A B C & D)
G) Loans On Manufactured Home Dwelling (A B C & D)
Number
Average Value
Number
Average Value
Number
Average Value
Number
Average Value
Number
Average Value
Number
Average Value
Number
Average Value
LOANS ORIGINATED
14
$69,674
48
$88,866
82
$94,215
14
$35,514
1
$138,530
8
$73,398
1
$60,460
APPLICATIONS APPROVED, NOT ACCEPTED
0
$0
3
$108,610
11
$81,396
2
$48,335
0
$0
0
$0
0
$0
APPLICATIONS DENIED
0
$0
8
$54,516
46
$79,863
4
$36,265
0
$0
2
$41,545
2
$18,220
APPLICATIONS WITHDRAWN
1
$135,530
4
$88,788
26
$89,178
2
$10,995
0
$0
1
$53,910
0
$0
FILES CLOSED FOR INCOMPLETENESS
1
$50,170
0
$0
2
$63,280
0
$0
0
$0
0
$0
0
$0
Aggregated Statistics For Year 2003 (Based on 4 partial tracts)
A) FHA, FSA/RHS & VA Home Purchase Loans
B) Conventional Home Purchase Loans
C) Refinancings
D) Home Improvement Loans
F) Non-occupant Loans on < 5 Family Dwellings (A B C & D)
Number
Average Value
Number
Average Value
Number
Average Value
Number
Average Value
Number
Average Value
LOANS ORIGINATED
15
$73,152
44
$98,328
194
$83,741
10
$36,890
9
$57,401
APPLICATIONS APPROVED, NOT ACCEPTED
0
$0
1
$72,790
13
$82,289
1
$37,440
0
$0
APPLICATIONS DENIED
0
$0
5
$73,276
41
$66,123
7
$22,223
2
$43,055
APPLICATIONS WITHDRAWN
1
$59,160
2
$105,490
26
$75,462
0
$0
0
$0
FILES CLOSED FOR INCOMPLETENESS
0
$0
2
$124,630
2
$61,450
0
$0
0
$0
Aggregated Statistics For Year 2002 (Based on 4 partial tracts)
A) FHA, FSA/RHS & VA Home Purchase Loans
B) Conventional Home Purchase Loans
C) Refinancings
D) Home Improvement Loans
E) Loans on Dwellings For 5+ Families
F) Non-occupant Loans on < 5 Family Dwellings (A B C & D)
Number
Average Value
Number
Average Value
Number
Average Value
Number
Average Value
Number
Average Value
Number
Average Value
LOANS ORIGINATED
16
$64,841
45
$84,827
141
$91,528
12
$24,183
1
$122,750
9
$52,340
APPLICATIONS APPROVED, NOT ACCEPTED
0
$0
2
$65,240
10
$105,445
3
$27,887
0
$0
0
$0
APPLICATIONS DENIED
0
$0
10
$59,370
46
$75,020
5
$18,838
1
$75,630
0
$0
APPLICATIONS WITHDRAWN
0
$0
1
$84,810
13
$71,278
0
$0
0
$0
0
$0
FILES CLOSED FOR INCOMPLETENESS
0
$0
0
$0
2
$110,225
0
$0
0
$0
0
$0
Aggregated Statistics For Year 2001 (Based on 4 partial tracts)
A) FHA, FSA/RHS & VA Home Purchase Loans
B) Conventional Home Purchase Loans
C) Refinancings
D) Home Improvement Loans
F) Non-occupant Loans on < 5 Family Dwellings (A B C & D)
Number
Average Value
Number
Average Value
Number
Average Value
Number
Average Value
Number
Average Value
LOANS ORIGINATED
14
$66,067
48
$64,368
126
$74,758
12
$15,576
7
$47,389
APPLICATIONS APPROVED, NOT ACCEPTED
1
$86,670
2
$58,070
16
$57,968
1
$10,420
0
$0
APPLICATIONS DENIED
0
$0
15
$41,433
51
$63,819
14
$14,730
2
$34,965
APPLICATIONS WITHDRAWN
0
$0
4
$50,535
16
$65,611
2
$16,745
1
$38,190
FILES CLOSED FOR INCOMPLETENESS
0
$0
0
$0
3
$53,420
0
$0
0
$0
Aggregated Statistics For Year 2000 (Based on 4 partial tracts)
A) FHA, FSA/RHS & VA Home Purchase Loans
B) Conventional Home Purchase Loans
C) Refinancings
D) Home Improvement Loans
F) Non-occupant Loans on < 5 Family Dwellings (A B C & D)
Number
Average Value
Number
Average Value
Number
Average Value
Number
Average Value
Number
Average Value
LOANS ORIGINATED
7
$65,860
57
$68,452
34
$54,300
18
$10,493
6
$53,985
APPLICATIONS APPROVED, NOT ACCEPTED
1
$41,180
4
$60,525
8
$47,024
6
$21,918
1
$14,230
APPLICATIONS DENIED
1
$67,100
24
$47,395
28
$44,082
9
$12,454
1
$17,370
APPLICATIONS WITHDRAWN
0
$0
3
$43,987
17
$60,154
1
$56,640
0
$0
FILES CLOSED FOR INCOMPLETENESS
0
$0
0
$0
2
$54,990
0
$0
0
$0
Aggregated Statistics For Year 1999 (Based on 2 partial tracts)
A) FHA, FSA/RHS & VA Home Purchase Loans
B) Conventional Home Purchase Loans
C) Refinancings
D) Home Improvement Loans
F) Non-occupant Loans on < 5 Family Dwellings (A B C & D)
Detailed PMIC statistics for the following Tracts:0022.00
, 0030.00
2002 - 2018 National Fire Incident Reporting System (NFIRS) incidents
According to the data from the years 2002 - 2018 the average number of fire incidents per year is 20. The highest number of fire incidents - 40 took place in 2017, and the least - 1 in 2005. The data has a growing trend.
When looking into fire subcategories, the most reports belonged to: Outside Fires (39.1%), and Structure Fires (33.8%).
Fire incident types reported to NFIRS in Zip Code 62501
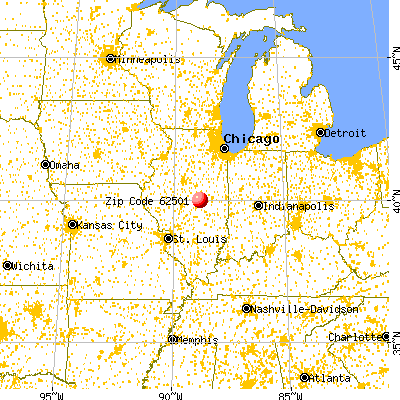


 Nearest zip codes: 62554, 61818, 61830, 61855, 61936, 62535.


 According to the data from the years 2002 - 2018 the average number of fire incidents per year is 20. The highest number of fire incidents - 40 took place in 2017, and the least - 1 in 2005. The data has a growing trend.
 When looking into fire subcategories, the most reports belonged to: Outside Fires (39.1%), and Structure Fires (33.8%).