Estimated zip code population in 2022: 2,904 Zip code population in 2010: 3,042 Zip code population in 2000: 3,338
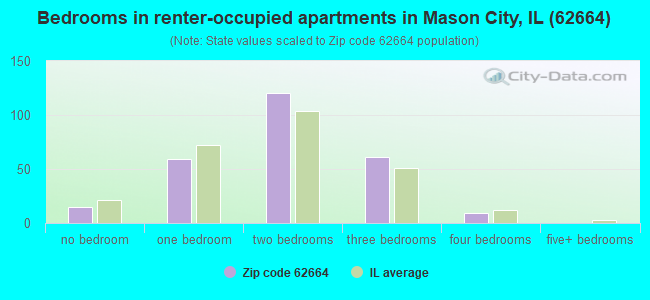
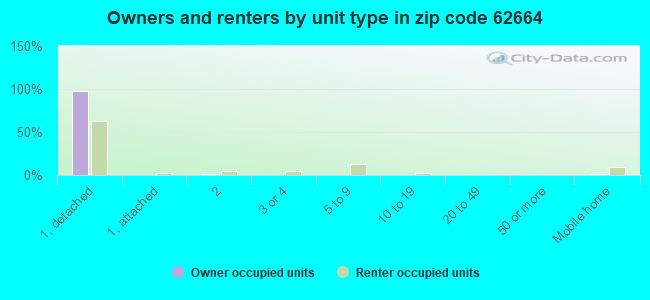
Houses and condos: 1,424 Renter-occupied apartments: 264
% of renters here:
20%
State:
33%
March 2022 cost of living index in zip code 62664: 83.6 (less than average, U.S. average is 100)
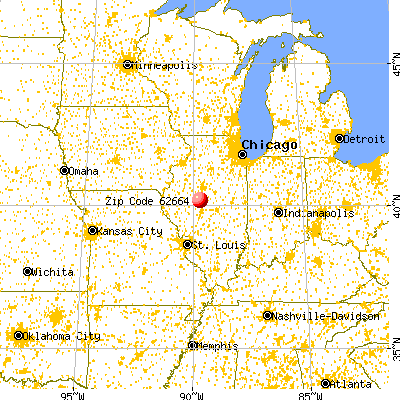
Land area: 109.1 sq. mi. Water area: 0.3 sq. mi.
Population density: 27 people per square mile
(very low).
OSM Map
General Map
Google Map
MSN Map
OSM Map
General Map
Google Map
MSN Map
OSM Map
General Map
Google Map
MSN Map
OSM Map
General Map
Google Map
MSN Map
Please wait while loading the map...
Real estate property taxes paid for housing units in 2022:
This zip code:
2.2% ($2,199)
Illinois:
2.0% ($4,912)
Median real estate property taxes paid for housing units with mortgages in 2022: $2,256 (2.2%) Median real estate property taxes paid for housing units with no mortgage in 2022: $2,174 (2.1%)
Business Search- 14 Million verified businesses
Males: 1,411
(48.6%)
Females: 1,492
(51.4%)
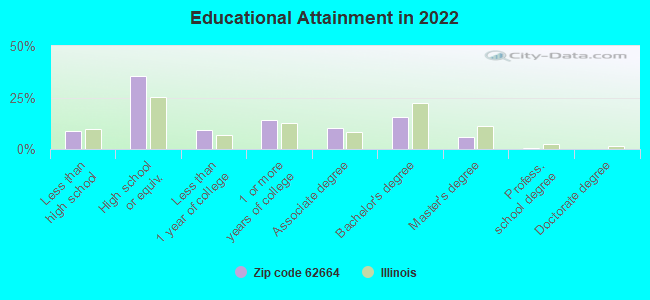
For population 25 years and over in 62664:
High school or higher: 89.9%
Bachelor's degree or higher: 22.1%
Graduate or professional degree: 6.6%
Unemployed: 1.5%
Mean travel time to work (commute): 26.4 minutes
For population 15 years and over in 62664:
Never married: 24.7%
Now married: 53.6%
Separated: 2.2%
Widowed: 10.0%
Divorced: 9.5%
Zip code 62664 compared to state average:
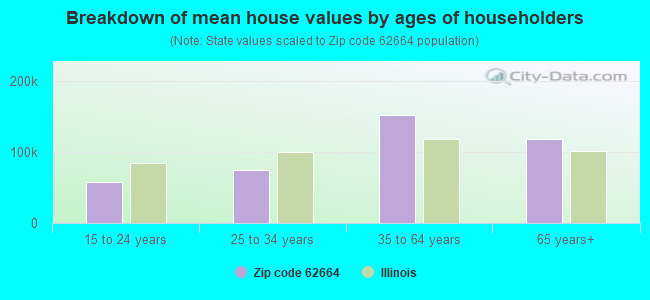
Median house value significantly below state average.
Unemployed percentage significantly below state average.
Black race population percentage significantly below state average.
Hispanic race population percentage significantly below state average.
Median age above state average.
Foreign-born population percentage significantly below state average.
Renting percentage below state average.
Length of stay since moving in significantly above state average.
Number of college students below state average.
Percentage of population with a bachelor's degree or higher below state average.
Averages for the 2020 tax year for zip code 62664, filed in 2021:
Average Adjusted Gross Income (AGI) in 2020: $58,589 (Individual Income Tax Returns)
Here:
$58,589
State:
$82,626
Salary/wage: $44,775 (reported on 78.9% of returns)
Here:
$44,775
State:
$66,640
(% of AGI for various income ranges: 1133.7% for AGIs below $25k, 3550.4% for AGIs $25k-50k, 6196.7% for AGIs $50k-75k, 9128.8% for AGIs $75k-100k, 13773.0% for AGIs $100k-200k)
Taxable interest for individuals: $1,156 (reported on 44.4% of returns)
This zip code:
$1,156
Illinois:
$2,376
(% of AGI for various income ranges: 26.0% for AGIs below $25k, 39.3% for AGIs $25k-50k, 54.0% for AGIs $50k-75k, 83.8% for AGIs $75k-100k, 274.0% for AGIs $100k-200k)
Ordinary dividends: $4,030 (reported on 17.3% of returns)
Here:
$4,030
State:
$9,061
(% of AGI for various income ranges: 17.0% for AGIs below $25k, 35.2% for AGIs $25k-50k, 97.3% for AGIs $50k-75k, 180.0% for AGIs $75k-100k, 344.0% for AGIs $100k-200k)
Net capital gain/loss in AGI: +$9,283 (reported on 13.5% of returns)
Here:
+$9,283
State:
+$31,684
(% of AGI for various income ranges: 13.0% for AGIs below $25k, 22.2% for AGIs $25k-50k, 57.3% for AGIs $50k-75k, 67.5% for AGIs $75k-100k, 262.0% for AGIs $100k-200k)
Profit/loss from business: +$9,175 (reported on 12.0% of returns)
Here:
+$9,175
State:
+$12,175
(% of AGI for various income ranges: 76.7% for AGIs below $25k, 37.4% for AGIs $25k-50k, 216.2% for AGIs $75k-100k, 964.0% for AGIs $100k-200k)
Taxable individual retirement arrangement distribution: $14,517 (reported on 9.0% of returns)
62664:
$14,517
Illinois:
$21,613
(% of AGI for various income ranges: 109.6% for AGIs $25k-50k, 250.7% for AGIs $50k-75k, 452.5% for AGIs $75k-100k, 708.0% for AGIs $100k-200k)
Total itemized deductions: $32,933 (reported on 2.3% of returns)
Here:
$32,933
State:
$34,948
(% of AGI for various income ranges: 658.7% for AGIs $50k-75k)
Taxes paid: $4,700 (reported on 2.3% of returns)
62664:
$4,700
State:
$8,563
(% of AGI for various income ranges: 47.0% for AGIs below $25k)
Earned income credit: $2,158 (reported on 14.3% of returns)
Here:
$2,158
State:
$2,311
(% of AGI for various income ranges: 90.7% for AGIs below $25k, 51.1% for AGIs $25k-50k)
Percentage of individuals using paid preparers for their 2020 taxes: 95.5%
Here:
95%
State:
93%
(% for various income ranges: 95.1% for AGIs below $25k, 97.1% for AGIs $25k-50k, 95.5% for AGIs $50k-75k, 92.9% for AGIs $75k-100k, 94.4% for AGIs $100k-200k, 100.0% for AGIs over 200k)
Averages for the 2012 tax year for zip code 62664, filed in 2013:
Average Adjusted Gross Income (AGI) in 2012: $51,983 (Individual Income Tax Returns)
Here:
$51,983
State:
$68,058
Salary/wage: $38,456 (reported on 79.6% of returns)
Here:
$38,456
State:
$55,396
(% of AGI for various income ranges: 69.7% for AGIs below $25k, 74.7% for AGIs $25k-50k, 68.6% for AGIs $50k-75k, 67.0% for AGIs $75k-100k, 63.9% for AGIs $100k-200k)
Taxable interest for individuals: $1,073 (reported on 46.5% of returns)
This zip code:
$1,073
Illinois:
$1,969
(% of AGI for various income ranges: 1.9% for AGIs below $25k, 1.2% for AGIs $25k-50k, 1.3% for AGIs $50k-75k, 0.3% for AGIs $75k-100k, 0.9% for AGIs $100k-200k, 0.5% for AGIs over 200k)
Ordinary dividends: $2,653 (reported on 21.1% of returns)
Here:
$2,653
State:
$7,786
(% of AGI for various income ranges: 1.2% for AGIs below $25k, 0.6% for AGIs $25k-50k, 1.3% for AGIs $50k-75k, 0.4% for AGIs $75k-100k, 1.5% for AGIs $100k-200k, 1.4% for AGIs over 200k)
Net capital gain/loss in AGI: +$6,212 (reported on 11.3% of returns)
Here:
+$6,212
State:
+$22,183
(% of AGI for various income ranges: 0.2% for AGIs $25k-50k, 0.7% for AGIs $50k-75k, 0.2% for AGIs $75k-100k, 4.9% for AGIs $100k-200k)
Profit/loss from business: +$13,233 (reported on 12.7% of returns)
Here:
+$13,233
State:
+$12,903
(% of AGI for various income ranges: 4.9% for AGIs below $25k, 1.8% for AGIs $25k-50k, 4.3% for AGIs $50k-75k, 7.2% for AGIs $100k-200k)
Taxable individual retirement arrangement distribution: $10,721 (reported on 9.9% of returns)
62664:
$10,721
Illinois:
$17,929
(% of AGI for various income ranges: 2.6% for AGIs below $25k, 2.3% for AGIs $25k-50k, 1.6% for AGIs $50k-75k, 2.7% for AGIs $75k-100k, 2.7% for AGIs $100k-200k)
Total itemized deductions: $19,217 (17% of AGI, reported on 16.9% of returns)
Here:
$19,217
State:
$26,433
Here:
16.9% of AGI
State:
19.2% of AGI
(% of AGI for various income ranges: 6.0% for AGIs below $25k, 5.3% for AGIs $25k-50k, 6.5% for AGIs $50k-75k, 5.2% for AGIs $75k-100k, 7.1% for AGIs $100k-200k, 7.2% for AGIs over 200k)
Charity contributions: $4,388 (reported on 12.0% of returns)
Here:
$4,388
State:
$4,525
(% of AGI for various income ranges: 0.7% for AGIs $25k-50k, 1.0% for AGIs $50k-75k, 1.3% for AGIs $75k-100k, 1.3% for AGIs $100k-200k, 1.3% for AGIs over 200k)
Taxes paid: $7,592 (reported on 16.9% of returns)
62664:
$7,592
State:
$11,968
(% of AGI for various income ranges: 1.1% for AGIs below $25k, 1.4% for AGIs $25k-50k, 1.8% for AGIs $50k-75k, 2.4% for AGIs $75k-100k, 3.5% for AGIs $100k-200k, 3.9% for AGIs over 200k)
Earned income credit: $2,073 (reported on 15.5% of returns)
Here:
$2,073
State:
$2,349
(% of AGI for various income ranges: 5.4% for AGIs below $25k, 0.9% for AGIs $25k-50k)
Percentage of individuals using paid preparers for their 2012 taxes: 68.3%
Here:
68%
State:
57%
(% for various income ranges: 63.5% for AGIs below $25k, 63.9% for AGIs $25k-50k, 73.9% for AGIs $50k-75k, 73.3% for AGIs $75k-100k, 84.6% for AGIs $100k-200k, 66.7% for AGIs over 200k)
Averages for the 2004 tax year for zip code 62664, filed in 2005:
Average Adjusted Gross Income (AGI) in 2004: $36,915 (Individual Income Tax Returns)
Here:
$36,915
State:
$54,625
Salary/wage: $32,370 (reported on 80.2% of returns)
Here:
$32,370
State:
$46,811
(% of AGI for various income ranges: 79.4% for AGIs below $10k, 68.2% for AGIs $10k-25k, 74.0% for AGIs $25k-50k, 74.9% for AGIs $50k-75k, 74.3% for AGIs $75k-100k, 53.5% for AGIs over 100k)
Taxable interest for individuals: $1,884 (reported on 50.0% of returns)
This zip code:
$1,884
Illinois:
$2,101
(% of AGI for various income ranges: 7.8% for AGIs below $10k, 4.9% for AGIs $10k-25k, 2.3% for AGIs $25k-50k, 1.8% for AGIs $50k-75k, 2.5% for AGIs $75k-100k, 1.8% for AGIs over 100k)
Taxable dividends: $2,179 (reported on 24.4% of returns)
Here:
$2,179
State:
$4,306
(% of AGI for various income ranges: 3.0% for AGIs below $10k, 0.7% for AGIs $10k-25k, 0.9% for AGIs $25k-50k, 1.4% for AGIs $50k-75k, 0.9% for AGIs $75k-100k, 3.0% for AGIs over 100k)
Net capital gain/loss: +$2,161 (reported on 15.2% of returns)
Here:
+$2,161
State:
+$17,321
(% of AGI for various income ranges: -1.3% for AGIs below $10k, 0.5% for AGIs $10k-25k, 1.1% for AGIs $25k-50k, 0.4% for AGIs $50k-75k, 0.0% for AGIs $75k-100k, 2.8% for AGIs over 100k)
Profit/loss from business: +$6,265 (reported on 13.7% of returns)
Here:
+$6,265
State:
+$11,771
(% of AGI for various income ranges: 6.6% for AGIs below $10k, 2.6% for AGIs $10k-25k, 1.9% for AGIs $25k-50k, 1.6% for AGIs $50k-75k, 5.3% for AGIs $75k-100k, 0.5% for AGIs over 100k)
Profit/loss from farming: +$12,323 (reported on 6.6% of returns)
Here:
+$12,323
State:
+$2,327
(% of AGI for various income ranges: 1.7% for AGIs $10k-25k, 1.5% for AGIs $25k-50k, 2.1% for AGIs $50k-75k, 2.9% for AGIs $75k-100k, 3.4% for AGIs over 100k)
IRA payment deduction: $2,969 (reported on 2.2% of returns)
62664:
$2,969
Illinois:
$3,087
Self-employed pension: $7,643 (reported on 1.0% of returns)
Here:
$7,643
Illinois:
$16,965
Total itemized deductions: $14,677 (25% of AGI, reported on 16.0% of returns)
Here:
$14,677
State:
$20,239
Here:
25.2% of AGI
State:
19.5% of AGI
(% of AGI for various income ranges: 8.0% for AGIs $10k-25k, 6.4% for AGIs $25k-50k, 6.5% for AGIs $50k-75k, 5.4% for AGIs $75k-100k, 6.7% for AGIs over 100k)
Charity contributions deductions: $3,154 (5% of AGI, reported on 12.8% of returns)
Here:
$3,154
State:
$3,719
Here:
4.9% of AGI
State:
3.4% of AGI
(% of AGI for various income ranges: 1.1% for AGIs $10k-25k, 0.8% for AGIs $25k-50k, 1.4% for AGIs $50k-75k, 1.0% for AGIs $75k-100k, 1.4% for AGIs over 100k)
Total tax: $4,580 (reported on 73.9% of returns)
62664:
$4,580
State:
$9,882
(% of AGI for various income ranges: 2.4% for AGIs below $10k, 4.1% for AGIs $10k-25k, 6.7% for AGIs $25k-50k, 8.7% for AGIs $50k-75k, 11.6% for AGIs $75k-100k, 16.2% for AGIs over 100k)
Earned income credit: $1,648 (reported on 14.3% of returns)
Here:
$1,648
State:
$1,788
Percentage of individuals using paid preparers for their 2004 taxes: 67.1%
Here:
67%
State:
61%
(% for various income ranges: 56.1% for AGIs below $10k, 69.5% for AGIs $10k-25k, 66.1% for AGIs $25k-50k, 72.9% for AGIs $50k-75k, 69.1% for AGIs $75k-100k, 83.3% for AGIs over 100k)
Household received Food Stamps/SNAP in the past 12 months: 196 Household did not receive Food Stamps/SNAP in the past 12 months: 1,112
Women who had a birth in the past 12 months: 34 (18 now married, 16 unmarried) Women who did not have a birth in the past 12 months: 509 (205 now married, 304 unmarried)
Housing units in zip code 62664 with a mortgage: 470 (19 second mortgage, 16 both second mortgage and home equity loan) Median monthly owner costs for units with a mortgage: $1,077 Median monthly owner costs for units without a mortgage: $538
Residents with income below the poverty level in 2022:
This zip code:
15.2%
Whole state:
11.9%
Residents with income below 50% of the poverty level in 2022:
This zip code:
11.2%
Whole state:
5.7%
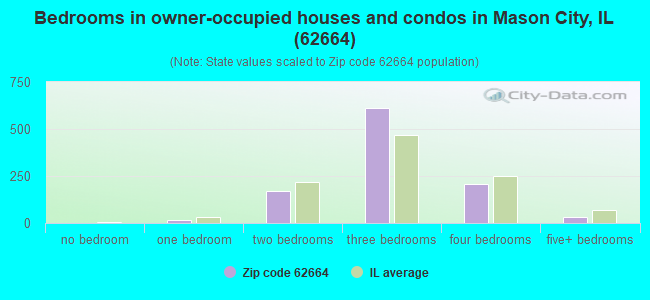
Median number of rooms in houses and condos:
Here:
6.6
State:
6.4
Median number of rooms in apartments:
Here:
5.3
State:
4.1
Notable locations in this zip code not listed on our city pages
Notable locations in zip code 62664: Mason County Ambulance Service (A), Mason City City Hall (B), Mason City Fire Protection District (C), Salt Creek Townhall (D). Display/hide their locations on the map
Churches in zip code 62664 include: Pennsylvania Lane Church (A), Christ Lutheran Church (B), First Baptist Church of Mason City (C), First Christian Church (D), Mason City United Methodist Church (E), Saint Columba Catholic Church (F). Display/hide their locations on the map
Cemeteries: Allens Grove Cemetery (1), Big Grove Cemetery (2), Leases Grove Cemetery (3), Mason City Cemetery (4), Crites Cemetery (5), Swing Grove Cemetery (6), Cherry Grove Cemetery (7). Display/hide their locations on the map
In group quarters: 67 (-1 institutionalized population)
Size of family households: 408 2-persons, 149 3-persons, 175 4-persons, 26 5-persons, 11 6-persons, 24 7-or-more-persons
Size of nonfamily households: 463 1-person, 42 2-persons, 11 3-persons
458 married couples with children.
137 single-parent households (72 men, 65 women).
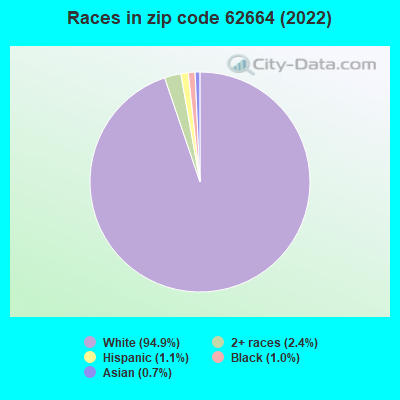
97.4% of residents of 62664 zip code speak English at home.
0.5% of residents speak Spanish at home (100% very well).
1.2% of residents speak other Indo-European language at home (100% very well).
0.7% of residents speak Asian or Pacific Island language at home (100% very well).
Foreign born population: 20 (0.7%) (100.0% of them are naturalized citizens)
This zip code:
0.7%
Whole state:
14.4%
95%Malaysia
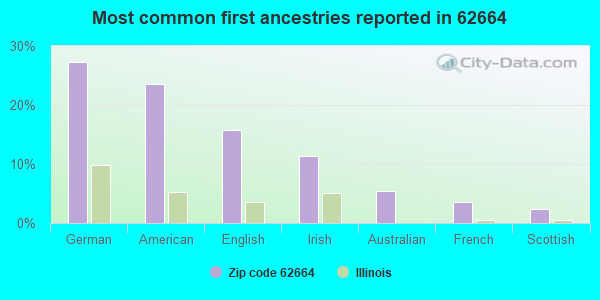
27%German
24%American
16%English
11%Irish
5%Australian
4%French
2%Scottish
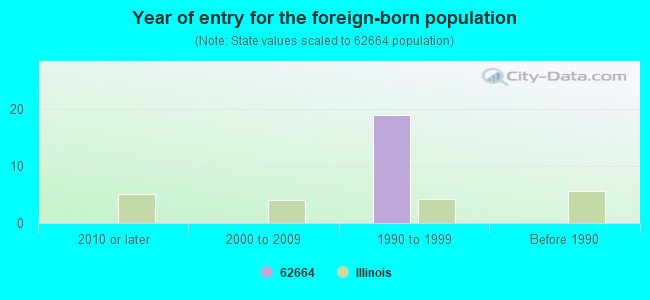
Year of entry for the foreign-born population
02010 or later
02000 to 2009
191990 to 1999
0Before 1990
Major facilities with environmental interests located in this zip code:
CURRY READY MIX OF MASON CITY INC (210 E ELM in MASON CITY, IL)
STATE MASTER (Illinois EPA Project) - AIR PROGRAM STATE MASTER (Illinois EPA Project) - AIR PROGRAM, National Pollutant Discharge Elimination System Permit AIR MINOR (AIRS/AFS) CRITERIA AND HAZARDOUS AIR POLLUTANT INVENTORY (Inventory of air pollution sources) National Pollutant Discharge Elimination System NON-MAJOR (Tracking pollutant discharge elimination systems) - permit Business SIC classification: READY-MIXED CONCRETE; GRAIN AND FIELD BEANS Business NAICS classification: READY-MIX CONCRETE MANUFACTURING. Organizations: C&R MATERIALS (CONTACT/OWNER)
Alternative names: C & R MATERIALS INCORPORATED, MASON CITY READY MIX
MONSANTO CO (36142 EAST STATE ROUTE 10 in MASON CITY, IL)
STATE MASTER (Illinois EPA Project) - SOLID WASTE PROGRAM, HAZARDOUS WASTE PROGRAM, AIR PROGRAM AIR MINOR (AIRS/AFS) CRITERIA AND HAZARDOUS AIR POLLUTANT INVENTORY (Inventory of air pollution sources) Small Quantity Generators, between 100 kg and 1000 kg of hazardous waste/month (Resource Conservation and Recovery Act (tracking hazardous waste)) - notification Business SIC classification: CROP PREPARATION SERVICES FOR MARKET, EXCEPT COTTON GINNING Alternative names: DEKALB GENETICS CORPORATION
MASON CITY STP (1.5 MILES SOUTH OF MASON CITY in MASON CITY, IL)
STATE MASTER (Illinois EPA Project) - National Pollutant Discharge Elimination System Permit National Pollutant Discharge Elimination System NON-MAJOR (Tracking pollutant discharge elimination systems) - permit National Pollutant Discharge Elimination System NON-MAJOR (Tracking pollutant discharge elimination systems) - permit Business SIC classification: SEWERAGE SYSTEMS Alternative names: MASON CITY, CITY OF, MASON CITY STP, CITY OF
HORIZON GENETICS LLC (MAIN RT. 10 E in MASON CITY, IL)
STATE MASTER (Illinois EPA Project) - AIR PROGRAM AIR MINOR (AIRS/AFS) CRITERIA AND HAZARDOUS AIR POLLUTANT INVENTORY (Inventory of air pollution sources) Business SIC classification: CROP PREPARATION SERVICES FOR MARKET, EXCEPT COTTON GINNING Alternative names: HORIZON GENETICS, L.L.C.
HULL TRUCKING (308 E. ARCH ST. in MASON CITY, IL)
STATE MASTER (Illinois EPA Project) - SOLID WASTE PROGRAM National Pollutant Discharge Elimination System NON-MAJOR (Tracking pollutant discharge elimination systems) - permit
MASON COUNTY SERVICE CO (RR-MASON CITY TWP in MASON CITY, IL)
STATE MASTER (Illinois EPA Project) - AIR PROGRAM AIR MINOR (AIRS/AFS) Business SIC classification: NONCLASSIFIABLE ESTABLISHMENTS
NATIONAL BY PRODUCTS INC (SOUTH MAIN STREET in MASON CITY, IL)
STATE MASTER (Illinois EPA Project) - National Pollutant Discharge Elimination System Permit Conditionally Exempt Small Quantity Generators, less than 100 kg/month of hazardous waste (Resource Conservation and Recovery Act (tracking hazardous waste)) TRI REPORTER (Tracking of toxic chemicals releasing facilities) Business SIC classification: DOG AND CAT FOOD; PREPARED FEEDS AND FEED INGREDIENTS FOR ANIMALS AND FOWLS, EXCEPT DOGS AND CATS; ANIMAL AND MARINE FATS AND OILS Organizations: NATIONAL BYPRODUCTS INC (CONTACT/OWNER)
ONEY FOOD STORES (201 ELM ST in MASON CITY, IL)
STATE MASTER (Illinois EPA Project) - AIR PROGRAM AIR MINOR (AIRS/AFS) CRITERIA AND HAZARDOUS AIR POLLUTANT INVENTORY (Inventory of air pollution sources) Business SIC classification: GROCERY STORES Alternative names: ONEY FOODS
ILLICO INDEPENDENT OIL CO (TONICA ST in MASON CITY, IL)
STATE MASTER (Illinois EPA Project) - AIR PROGRAM AIR MINOR (AIRS/AFS) Business SIC classification: PETROLEUM BULK STATIONS AND TERMINALS
MAINSTREET AUTOBODY (715 S MAIN in MASON CITY, IL)
STATE MASTER (Illinois EPA Project) - SOLID WASTE PROGRAM, HAZARDOUS WASTE PROGRAM Conditionally Exempt Small Quantity Generators, less than 100 kg/month of hazardous waste (Resource Conservation and Recovery Act (tracking hazardous waste)) Business NAICS classification: AUTOMOTIVE BODY, PAINT, AND INTERIOR REPAIR AND MAINTENANCE. Organizations: MAIN STREET AUTO BODY (CONTACT/OPERATOR)
Alternative names: MAIN STREET AUTO BODY
MASON COUNTY SERVICES CO (RURAL in MASON CITY, IL)
STATE MASTER (Illinois EPA Project) - AIR PROGRAM AIR MINOR (AIRS/AFS) Business SIC classification: FERTILIZERS, MIXING ONLY
MCCREERY GRAIN CO (W CHESTNUT ST ROAD in MASON CITY, IL)
STATE MASTER (Illinois EPA Project) - AIR PROGRAM AIR MINOR (AIRS/AFS) Business SIC classification: GRAIN AND FIELD BEANS
AGRATECH SEED CO. - FACILITY #2 (200 SOUTH TONICA in MASON CITY, IL)
STATE MASTER (Illinois EPA Project) - AIR PROGRAM AIR SYNTHETIC MINOR (AIRS/AFS) CRITERIA AND HAZARDOUS AIR POLLUTANT INVENTORY (Inventory of air pollution sources) Business SIC classification: CROP PREPARATION SERVICES FOR MARKET, EXCEPT COTTON GINNING
Housing units lacking complete plumbing facilities: 2.5% Housing units lacking complete kitchen facilities: 1.2%
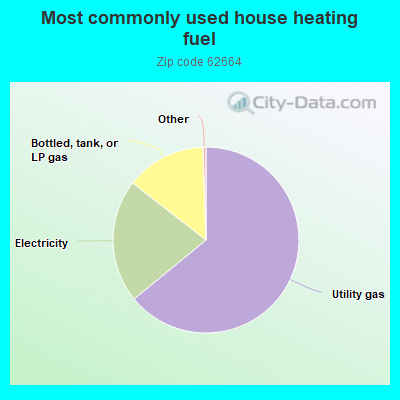
64.2%Utility gas
21.5%Electricity
14.0%Bottled, tank, or LP gas
Population in 1990: 2,968. Population change in the 1990s: +370 (+12.5%).
Place of birth for U.S.-born residents:
This state: 2,522
Northeast: 26
Midwest: 158
South: 121
West: 40
63% of the 62664 zip code residents lived in the same house 5 years ago. Out of people who lived in different houses, 63% lived in this county. Out of people who lived in different counties, 50% lived in Illinois.
94% of the 62664 zip code residents lived in the same house 1 year ago. Out of people who lived in different houses, 60% moved from this county. Out of people who lived in different houses, 23% moved from different county within same state. Out of people who lived in different houses, 3% moved from different state. Out of people who lived in different houses, 12% moved from abroad.
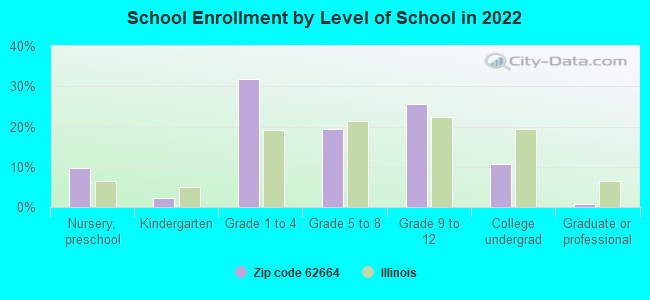
Private vs. public school enrollment:
Students in private schools in grades 1 to 8 (elementary and middle school): 46
Here:
14.5%
Illinois:
13.3%
Students in private schools in grades 9 to 12 (high school): 5
Here:
3.6%
Illinois:
9.9%
Students in private undergraduate colleges: 35
Here:
51.6%
Illinois:
27.4%
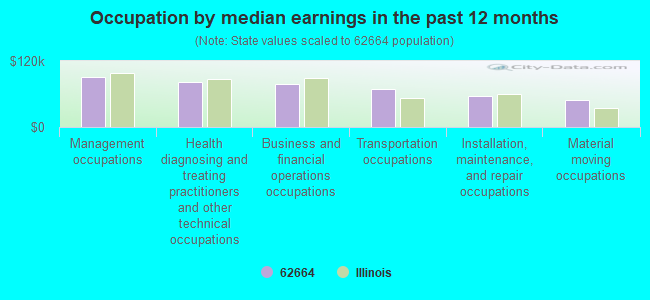
Occupation by median earnings in the past 12 months ($)
90,115Management occupations
81,810Health diagnosing and treating practitioners and other technical occupations
77,483Business and financial operations occupations
68,257Transportation occupations
55,683Installation, maintenance, and repair occupations
48,665Material moving occupations
Top industries in this zip code by the number of employees in 2005:
Health Care and Social Assistance: Nursing Care Facilities (50-99 employees: 1 establishment)
Finance and Insurance: Commercial Banking (20-49: 1, 5-9: 1)
Health Care and Social Assistance: Child Day Care Services (20-49: 1, 1-4: 1)
Accommodation and Food Services: Full-Service Restaurants (10-19: 1, 1-4: 4)
Other Services (except Public Administration): Religious Organizations (5-9: 1, 1-4: 4)
People in group quarters in 2010:
68 people in nursing facilities/skilled-nursing facilities
People in group quarters in 2000:
79 people in nursing homes
5 people in homes for the mentally retarded
Fatal accident statistics in 2012:
Fatal accident count: 1
Vehicles involved in fatal accidents: 1
Fatal accidents caused by drunken drivers: 1
Fatalities: 1
Persons involved in fatal accidents: 3
Pedestrians involved in fatal accidents: 0
2002 - 2018 National Fire Incident Reporting System (NFIRS) incidents
Based on the data from the years 2002 - 2018 the average number of fires per year is 17. The highest number of fires - 39 took place in 2012, and the least - 1 in 2005. The data has a growing trend.
When looking into fire subcategories, the most reports belonged to: Outside Fires (42.0%), and Structure Fires (31.1%).
Fire incident types reported to NFIRS in Zip Code 62664


 Nearest zip codes: 62642, 62682, 62633, 61532, 62671, 61534.
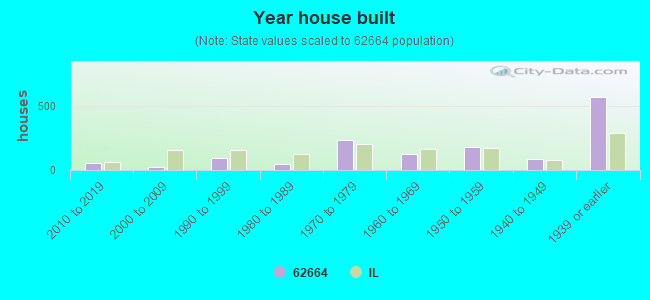


 Based on the data from the years 2002 - 2018 the average number of fires per year is 17. The highest number of fires - 39 took place in 2012, and the least - 1 in 2005. The data has a growing trend.
 When looking into fire subcategories, the most reports belonged to: Outside Fires (42.0%), and Structure Fires (31.1%).