Estimated zip code population in 2022: 25,607 Zip code population in 2010: 23,389 Zip code population in 2000: 51,252
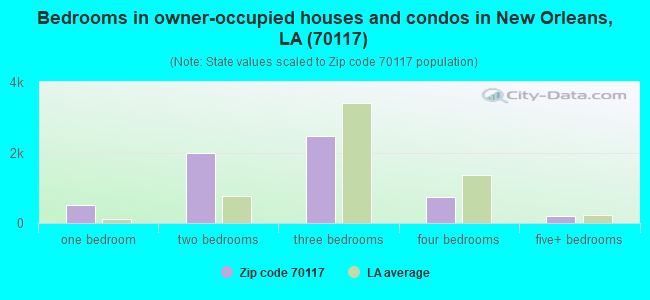
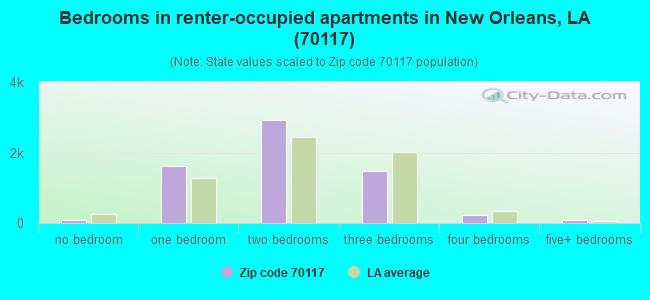
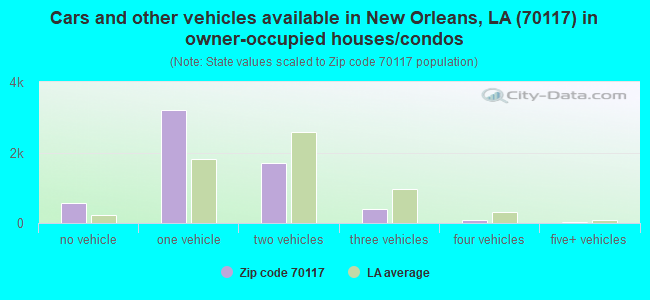
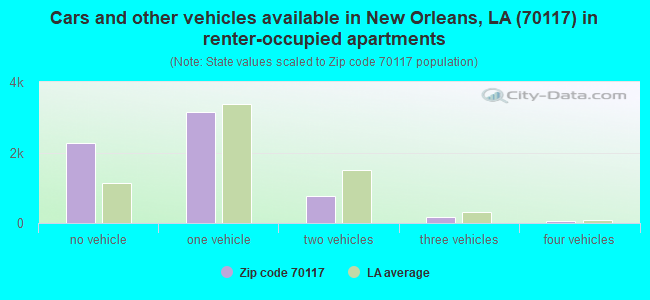
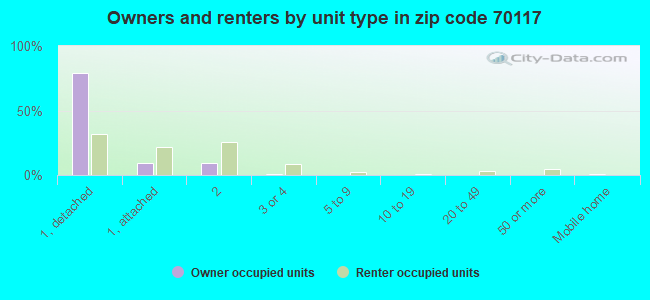
Houses and condos: 15,930 Renter-occupied apartments: 6,428
% of renters here:
52%
State:
32%
March 2022 cost of living index in zip code 70117: 98.8 (near average, U.S. average is 100)
Land area: 5.5 sq. mi. Water area: 0.8 sq. mi.
Population density: 4,673 people per square mile
(average).
OSM Map
General Map
Google Map
MSN Map
OSM Map
General Map
Google Map
MSN Map
OSM Map
General Map
Google Map
MSN Map
OSM Map
General Map
Google Map
MSN Map
Please wait while loading the map...
Real estate property taxes paid for housing units in 2022:
This zip code:
0.6% ($1,591)
Louisiana:
0.5% ($1,127)
Median real estate property taxes paid for housing units with mortgages in 2022: $2,418 (0.8%) Median real estate property taxes paid for housing units with no mortgage in 2022: $1,073 (0.5%)
Averages for the 2020 tax year for zip code 70117, filed in 2021:
Average Adjusted Gross Income (AGI) in 2020: $37,386 (Individual Income Tax Returns)
Here:
$37,386
State:
$60,757
Salary/wage: $33,934 (reported on 82.1% of returns)
Here:
$33,934
State:
$50,882
(% of AGI for various income ranges: 1003.9% for AGIs below $25k, 3511.3% for AGIs $25k-50k, 6995.6% for AGIs $50k-75k, 10700.0% for AGIs $75k-100k, 19874.5% for AGIs $100k-200k, 53908.6% for AGIs over 200k)
Taxable interest for individuals: $731 (reported on 14.0% of returns)
This zip code:
$731
Louisiana:
$1,576
(% of AGI for various income ranges: 3.1% for AGIs below $25k, 6.3% for AGIs $25k-50k, 18.2% for AGIs $50k-75k, 39.1% for AGIs $75k-100k, 90.0% for AGIs $100k-200k, 515.7% for AGIs over 200k)
Ordinary dividends: $4,469 (reported on 8.9% of returns)
Here:
$4,469
State:
$7,743
(% of AGI for various income ranges: 7.8% for AGIs below $25k, 15.3% for AGIs $25k-50k, 72.4% for AGIs $50k-75k, 170.0% for AGIs $75k-100k, 326.1% for AGIs $100k-200k, 2674.3% for AGIs over 200k)
Net capital gain/loss in AGI: +$13,563 (reported on 8.3% of returns)
Here:
+$13,563
State:
+$16,917
(% of AGI for various income ranges: 3.6% for AGIs below $25k, 16.8% for AGIs $25k-50k, 106.9% for AGIs $50k-75k, 267.7% for AGIs $75k-100k, 759.4% for AGIs $100k-200k, 13145.7% for AGIs over 200k)
Profit/loss from business: +$4,783 (reported on 25.5% of returns)
Here:
+$4,783
State:
+$7,679
(% of AGI for various income ranges: 61.0% for AGIs below $25k, 68.6% for AGIs $25k-50k, 280.2% for AGIs $50k-75k, 454.3% for AGIs $75k-100k, 1375.5% for AGIs $100k-200k, 2512.9% for AGIs over 200k)
Taxable individual retirement arrangement distribution: $14,581 (reported on 2.9% of returns)
70117:
$14,581
Louisiana:
$20,716
(% of AGI for various income ranges: 10.5% for AGIs below $25k, 27.0% for AGIs $25k-50k, 127.1% for AGIs $50k-75k, 154.3% for AGIs $75k-100k, 731.0% for AGIs $100k-200k)
Self-employed (Keogh) retirement plans: $16,220 (reported on 0.4% of returns)
70117:
$16,220
Louisiana:
$27,459
(% of AGI for various income ranges: 3.4% for AGIs below $25k, 202.3% for AGIs $100k-200k)
Total itemized deductions: $24,603 (reported on 4.6% of returns)
Here:
$24,603
State:
$36,265
(% of AGI for various income ranges: 16.0% for AGIs below $25k, 87.9% for AGIs $25k-50k, 288.4% for AGIs $50k-75k, 463.1% for AGIs $75k-100k, 1269.0% for AGIs $100k-200k, 4120.0% for AGIs over 200k)
Charity contributions: $6,929 (reported on 3.4% of returns)
Here:
$6,929
State:
$13,106
(% of AGI for various income ranges: 2.6% for AGIs below $25k, 25.4% for AGIs $25k-50k, 56.8% for AGIs $50k-75k, 79.1% for AGIs $75k-100k, 207.4% for AGIs $100k-200k, 931.4% for AGIs over 200k)
Taxes paid: $6,722 (reported on 4.4% of returns)
70117:
$6,722
State:
$6,643
(% of AGI for various income ranges: 1.8% for AGIs below $25k, 16.8% for AGIs $25k-50k, 76.9% for AGIs $50k-75k, 132.3% for AGIs $75k-100k, 376.5% for AGIs $100k-200k, 1172.9% for AGIs over 200k)
Earned income credit: $2,471 (reported on 35.0% of returns)
Here:
$2,471
State:
$2,671
(% of AGI for various income ranges: 157.5% for AGIs below $25k, 90.1% for AGIs $25k-50k)
Percentage of individuals using paid preparers for their 2020 taxes: 92.6%
Here:
93%
State:
92%
(% for various income ranges: 92.8% for AGIs below $25k, 92.7% for AGIs $25k-50k, 91.5% for AGIs $50k-75k, 92.5% for AGIs $75k-100k, 93.3% for AGIs $100k-200k, 94.4% for AGIs over 200k)
Averages for the 2012 tax year for zip code 70117, filed in 2013:
Average Adjusted Gross Income (AGI) in 2012: $28,671 (Individual Income Tax Returns)
Here:
$28,671
State:
$56,730
Salary/wage: $26,547 (reported on 85.6% of returns)
Here:
$26,547
State:
$45,545
(% of AGI for various income ranges: 80.1% for AGIs below $25k, 88.5% for AGIs $25k-50k, 82.0% for AGIs $50k-75k, 82.1% for AGIs $75k-100k, 72.4% for AGIs $100k-200k, 42.2% for AGIs over 200k)
Taxable interest for individuals: $897 (reported on 13.2% of returns)
This zip code:
$897
Louisiana:
$1,804
(% of AGI for various income ranges: 0.2% for AGIs below $25k, 0.1% for AGIs $25k-50k, 0.3% for AGIs $50k-75k, 0.2% for AGIs $75k-100k, 0.5% for AGIs $100k-200k, 2.4% for AGIs over 200k)
Ordinary dividends: $3,982 (reported on 6.8% of returns)
Here:
$3,982
State:
$7,610
(% of AGI for various income ranges: 0.6% for AGIs below $25k, 0.4% for AGIs $25k-50k, 0.7% for AGIs $50k-75k, 1.1% for AGIs $75k-100k, 1.4% for AGIs $100k-200k, 3.9% for AGIs over 200k)
Net capital gain/loss in AGI: +$12,571 (reported on 4.9% of returns)
Here:
+$12,571
State:
+$17,096
(% of AGI for various income ranges: 0.2% for AGIs below $25k, 0.4% for AGIs $25k-50k, 1.0% for AGIs $50k-75k, 1.5% for AGIs $75k-100k, 3.0% for AGIs $100k-200k, 17.9% for AGIs over 200k)
Profit/loss from business: +$7,406 (reported on 22.2% of returns)
Here:
+$7,406
State:
+$12,088
(% of AGI for various income ranges: 12.5% for AGIs below $25k, 1.8% for AGIs $25k-50k, 2.5% for AGIs $50k-75k, 2.0% for AGIs $75k-100k, 6.3% for AGIs $100k-200k, 5.7% for AGIs over 200k)
Taxable individual retirement arrangement distribution: $13,177 (reported on 2.6% of returns)
70117:
$13,177
Louisiana:
$16,085
(% of AGI for various income ranges: 0.6% for AGIs below $25k, 0.6% for AGIs $25k-50k, 1.9% for AGIs $50k-75k, 1.9% for AGIs $75k-100k, 3.6% for AGIs $100k-200k)
Self-employment retirement plans: $17,167 (reported on 0.3% of returns)
70117:
$17,167
Louisiana:
$25,119
Total itemized deductions: $16,539 (24% of AGI, reported on 14.1% of returns)
Here:
$16,539
State:
$23,585
Here:
24.1% of AGI
State:
18.1% of AGI
(% of AGI for various income ranges: 4.1% for AGIs below $25k, 7.7% for AGIs $25k-50k, 11.0% for AGIs $50k-75k, 11.7% for AGIs $75k-100k, 11.2% for AGIs $100k-200k, 11.0% for AGIs over 200k)
Charity contributions: $3,259 (reported on 10.1% of returns)
Here:
$3,259
State:
$5,533
(% of AGI for various income ranges: 0.4% for AGIs below $25k, 1.3% for AGIs $25k-50k, 1.8% for AGIs $50k-75k, 2.0% for AGIs $75k-100k, 1.3% for AGIs $100k-200k, 0.9% for AGIs over 200k)
Taxes paid: $4,064 (reported on 13.8% of returns)
70117:
$4,064
State:
$6,282
(% of AGI for various income ranges: 0.4% for AGIs below $25k, 1.2% for AGIs $25k-50k, 2.3% for AGIs $50k-75k, 3.1% for AGIs $75k-100k, 4.4% for AGIs $100k-200k, 5.0% for AGIs over 200k)
Earned income credit: $2,561 (reported on 45.6% of returns)
Here:
$2,561
State:
$2,633
(% of AGI for various income ranges: 13.0% for AGIs below $25k, 1.3% for AGIs $25k-50k)
Percentage of individuals using paid preparers for their 2012 taxes: 49.8%
Here:
50%
State:
57%
(% for various income ranges: 50.3% for AGIs below $25k, 44.9% for AGIs $25k-50k, 54.9% for AGIs $50k-75k, 56.2% for AGIs $75k-100k, 59.3% for AGIs $100k-200k, 71.4% for AGIs over 200k)
Averages for the 2004 tax year for zip code 70117, filed in 2005:
Average Adjusted Gross Income (AGI) in 2004: $19,438 (Individual Income Tax Returns)
Here:
$19,438
State:
$39,411
Salary/wage: $18,951 (reported on 90.4% of returns)
Here:
$18,951
State:
$34,434
(% of AGI for various income ranges: 87.8% for AGIs below $10k, 89.2% for AGIs $10k-25k, 91.4% for AGIs $25k-50k, 88.2% for AGIs $50k-75k, 80.1% for AGIs $75k-100k, 65.5% for AGIs over 100k)
Taxable interest for individuals: $646 (reported on 11.3% of returns)
This zip code:
$646
Louisiana:
$1,606
(% of AGI for various income ranges: 0.7% for AGIs below $10k, 0.3% for AGIs $10k-25k, 0.3% for AGIs $25k-50k, 0.4% for AGIs $50k-75k, 0.4% for AGIs $75k-100k, 0.6% for AGIs over 100k)
Taxable dividends: $854 (reported on 3.5% of returns)
Here:
$854
State:
$3,235
(% of AGI for various income ranges: 0.1% for AGIs below $10k, 0.1% for AGIs $10k-25k, 0.2% for AGIs $25k-50k, 0.2% for AGIs $50k-75k, 0.1% for AGIs $75k-100k, 0.5% for AGIs over 100k)
Net capital gain/loss: +$2,966 (reported on 2.5% of returns)
Here:
+$2,966
State:
+$8,531
(% of AGI for various income ranges: -0.3% for AGIs below $10k, 0.0% for AGIs $10k-25k, 0.2% for AGIs $25k-50k, 0.6% for AGIs $50k-75k, 4.0% for AGIs $75k-100k, 1.6% for AGIs over 100k)
Profit/loss from business: +$5,321 (reported on 12.1% of returns)
Here:
+$5,321
State:
+$9,128
(% of AGI for various income ranges: 11.2% for AGIs below $10k, 4.4% for AGIs $10k-25k, 0.9% for AGIs $25k-50k, 1.2% for AGIs $50k-75k, -0.6% for AGIs $75k-100k, 5.3% for AGIs over 100k)
IRA payment deduction: $2,052 (reported on 0.9% of returns)
70117:
$2,052
Louisiana:
$3,055
Total itemized deductions: $13,648 (31% of AGI, reported on 10.1% of returns)
Here:
$13,648
State:
$18,222
Here:
31.2% of AGI
State:
20.3% of AGI
(% of AGI for various income ranges: 2.4% for AGIs below $10k, 3.1% for AGIs $10k-25k, 10.1% for AGIs $25k-50k, 11.8% for AGIs $50k-75k, 12.4% for AGIs $75k-100k, 12.2% for AGIs over 100k)
Charity contributions deductions: $3,585 (8% of AGI, reported on 8.8% of returns)
Here:
$3,585
State:
$4,190
Here:
8.0% of AGI
State:
4.4% of AGI
(% of AGI for various income ranges: 0.2% for AGIs below $10k, 0.7% for AGIs $10k-25k, 2.4% for AGIs $25k-50k, 3.0% for AGIs $50k-75k, 2.7% for AGIs $75k-100k, 2.7% for AGIs over 100k)
Total tax: $2,391 (reported on 44.6% of returns)
70117:
$2,391
State:
$6,529
(% of AGI for various income ranges: 2.2% for AGIs below $10k, 2.3% for AGIs $10k-25k, 5.4% for AGIs $25k-50k, 10.2% for AGIs $50k-75k, 13.5% for AGIs $75k-100k, 19.4% for AGIs over 100k)
Earned income credit: $2,356 (reported on 59.2% of returns)
Here:
$2,356
State:
$2,103
Percentage of individuals using paid preparers for their 2004 taxes: 68.0%
Here:
68%
State:
61%
(% for various income ranges: 69.4% for AGIs below $10k, 71.8% for AGIs $10k-25k, 59.2% for AGIs $25k-50k, 55.1% for AGIs $50k-75k, 51.1% for AGIs $75k-100k, 66.3% for AGIs over 100k)
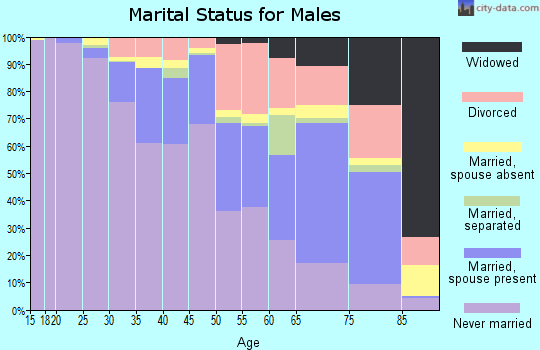
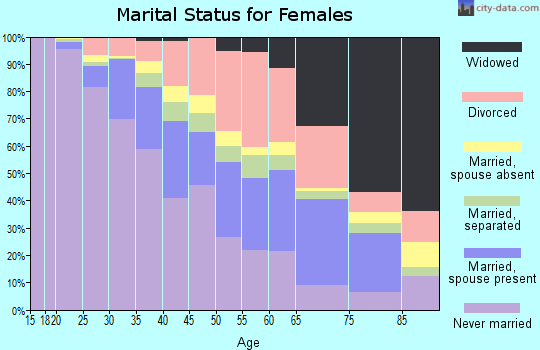
Likely homosexual households (counted as self-reported same-sex unmarried-partner households)
Lesbian couples: 0.3% of all households
Gay men: 0.7% of all households
Household received Food Stamps/SNAP in the past 12 months: 3,239 Household did not receive Food Stamps/SNAP in the past 12 months: 9,280
Women who had a birth in the past 12 months: 159 (81 now married, 77 unmarried) Women who did not have a birth in the past 12 months: 6,054 (1,422 now married, 4,662 unmarried)
Housing units in zip code 70117 with a mortgage: 2,830 (165 second mortgage, 6 home equity loan, 101 both second mortgage and home equity loan) Houses without a mortgage: 25
Median monthly owner costs for units with a mortgage: $1,707 Median monthly owner costs for units without a mortgage: $544
Residents with income below the poverty level in 2022:
This zip code:
28.2%
Whole state:
18.6%
Residents with income below 50% of the poverty level in 2022:
This zip code:
16.3%
Whole state:
10.1%
Median number of rooms in houses and condos:
Here:
5.9
State:
6.2
Median number of rooms in apartments:
Here:
4.5
State:
4.4
Notable locations in this zip code not listed on our city pages
Notable locations in zip code 70117: New Orleans Sewerage Pumping Station Number 26 (A), New Orleans Sewerage Pumping Station Number 25 (B), New Orleans Sewerage Pumping Station Number 24 (C), New Orleans Sewerage Pumping Station Number 16 (D), New Orleans Sewerage Pumping Station B (E), Press Street Wharf (F), Poland Street Wharf (G), Piety Street Wharf (H), Pauline Street Wharf (I), Mandeville Street Wharf (J), Louisa Street Wharf (K), Galvez Street Wharf (L), Florida Avenue Wharf (M), Esplanade Avenue Wharf (N), Congress Street Wharf (O), Alabo Street Wharf (P), Washington Square (Q), New Orleans Police Department Fifth District (R), Stallings Center (S), Mandeville Commuity Center (T). Display/hide their locations on the map
Churches in zip code 70117 include: Living Water Baptist Church (A), Greater Mount Carmel Baptist Church (B), Greater Ebenezer Baptist Church (C), Eagles Wing Ministry (D), Daily Walking With Christ Church (E), Abundant Life Full Gospel (F), Word Harvesters Church (G), Timothy Trumpet of Truth Church (H), Thessalonians Church of God in Christ (I). Display/hide their locations on the map
Parks in zip code 70117 include: Odile Davis Playground (1), Mickey Markey Playground (2), Lee Playground (3), Bunny Friend Playground (4), Bonart Playground (5), Bywater Historic District (6), Holy Cross Historic District (7). Display/hide their locations on the map
Tourist attractions (not listed on the city page) : The Jackson Barracks Military Museum (Cultural Attractions- Events- & Facilities; 6400 Saint Claude Avenue), Boettcher Incentive Company (Tours & Charters; 911 Gallier Street), Empowerment Travel and Services (Tours & Charters; 6024 Royal Street).
1,179 married couples with children.
2,268 single-parent households (175 men, 2,093 women).
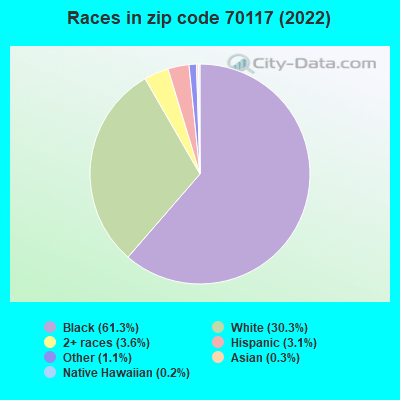
94.1% of residents of 70117 zip code speak English at home.
2.8% of residents speak Spanish at home (79% very well, 13% well, 5% not well, 2% not at all).
2.6% of residents speak other Indo-European language at home (77% very well, 8% well, 15% not well).
0.4% of residents speak Asian or Pacific Island language at home (90% very well, 5% well, 5% not at all).
0.1% of residents speak other language at home (100% very well).
Foreign born population: 975 (3.8%) (47.9% of them are naturalized citizens)
Major facilities with environmental interests located in this zip code:
EAST BANK WASTEWATER TREATMENT PLANT (6501 FLORIDA AVENUE in NEW ORLEANS, LA)
(Integrated Compliance Information System) - ICIS-06-1993-0011, FORMAL ENFORCEMENT ACTION, ICIS-06-2005-2147, ENFORCEMENT/COMPLIANCE ACTIVITY National Pollutant Discharge Elimination System MAJOR (Tracking pollutant discharge elimination systems) - permit - ICIS-, ENFORCEMENT/COMPLIANCE ACTIVITY National Pollutant Discharge Elimination System MAJOR (Tracking pollutant discharge elimination systems) - permit - ICIS-, ENFORCEMENT/COMPLIANCE ACTIVITY Conditionally Exempt Small Quantity Generators, less than 100 kg/month of hazardous waste (Resource Conservation and Recovery Act (tracking hazardous waste)) Business SIC classification: SEWERAGE SYSTEMS Organizations: US FILTER (CONTACT/OPERATOR)
, CITY OF NEW ORLEANS (CONTACT/OWNER)
Alternative names: ATTN: KEVIN SERVAT, NEW ORLEANS, CITY OF (EAST BAN, NEW ORLEANS SEWERAGE & WTR BRD, SEWERAGE & WATER BD - EAST BK, US FILTER OPERATING SERVICES
ALFRED LAWLESS ELEMENTARY SCHOOL (5300 LAW STREET in NEW ORLEANS, LA)
(Geographic Names Information System) (National Center for Education Statistics) - STATE ID-036072 Organizations: ORLEANS PARISH SCHOOL BOARD (SCHOOL DISTRICT)
Alternative names: LAWLESS HIGH SCHOOL
GALLAGHER TRANSFER & STORAGE CO INC (2401 ELYSIAN FIELDS AVE in NEW ORLEANS, LA)
NEW ORLEANS CENTER FOR CREATIVE ARTS (2800 CHARTRES STREET in NEW ORLEANS, LA)
(National Center for Education Statistics) - STATE ID-334001 Organizations: NEW ORLEANS CENTER FOR CREATIVE ARTS - AGENCY (SCHOOL DISTRICT)
FREDRICK A. DOUGLASS HIGH SCHOOL (3820 SAINT CLAUDE AVENUE in NEW ORLEANS, LA)
(National Center for Education Statistics) - STATE ID-036102 Organizations: ORLEANS PARISH SCHOOL BOARD (SCHOOL DISTRICT)
EAST NEW ORLEANS EDUCATIONAL CENTER (2521 MARAIS STREET in NEW ORLEANS, LA)
(National Center for Education Statistics) - STATE ID-036137 Organizations: ORLEANS PARISH SCHOOL BOARD (SCHOOL DISTRICT)
ORETHA CASTLE HALEY ELEMENTARY SCHOOL (2515 NORTH ROBERTSON STREET in NEW ORLEANS, LA)
(National Center for Education Statistics) - STATE ID-036047 Organizations: ORLEANS PARISH SCHOOL BOARD (SCHOOL DISTRICT)
ALL STAR CLEANERS (1525 ELYSIAN FIELDS AVENUE in NEW ORLEANS, LA)
AIR MINOR (AIRS/AFS) Conditionally Exempt Small Quantity Generators, less than 100 kg/month of hazardous waste (Resource Conservation and Recovery Act (tracking hazardous waste)) - notification Business SIC classification: DRYCLEANING PLANTS, EXCEPT RUG CLEANING Organizations: DAVID PESSES (CONTACT/OPERATOR)
Alternative names: ALL STAR DRY CLEANERS
NORFOLK SOUTHERN CORP (ALABAMA GREAT SOUTHERN RAILRD in NEW ORLEANS, LA)
National Pollutant Discharge Elimination System NON-MAJOR (Tracking pollutant discharge elimination systems) - permit National Pollutant Discharge Elimination System NON-MAJOR (Tracking pollutant discharge elimination systems) - permit Alternative names: NORFOLK SOUTHER CORP
EVERKLEEN DRY CLEANER (6110 ST CLAUDE AVENUE in NEW ORLEANS, LA)
AIR MINOR (AIRS/AFS) Conditionally Exempt Small Quantity Generators, less than 100 kg/month of hazardous waste (Resource Conservation and Recovery Act (tracking hazardous waste)) - notification Business SIC classification: DRYCLEANING PLANTS, EXCEPT RUG CLEANING Organizations: RUBY AARON (CONTACT/OWNER)
Alternative names: EVERKLEEN CLNRS
ALVARDALE CLEANERS (2040 MAZANT ST in NEW ORLEANS, LA)
(Resource Conservation and Recovery Act (tracking hazardous waste)) Organizations: FRANK JEE (CONTACT/OWNER)
7 UP RC BOTTLING CO (1400 MONTEGUT ST in NEW ORLEANS, LA)
(Resource Conservation and Recovery Act (tracking hazardous waste)) Organizations: 7 UP RC BOTTLING CO INC (CONTACT/OWNER)
BASF WYANDOTTE CORP TRANS INTERNATIONAL (5630 DOUGLASS STREET BLDGS27 2 in NEW ORLEANS, LA)
Housing units lacking complete plumbing facilities: 9.4% Housing units lacking complete kitchen facilities: 11.5%
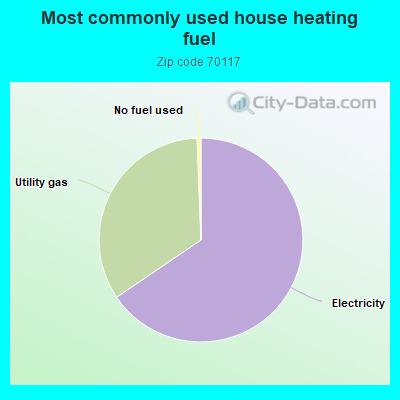
65.2%Electricity
33.7%Utility gas
0.6%No fuel used
Population in 1990: 56,494.
Place of birth for U.S.-born residents:
This state: 17,122
Northeast: 1,356
Midwest: 1,872
South: 3,049
West: 1,089
65% of the 70117 zip code residents lived in the same house 5 years ago. Out of people who lived in different houses, 85% lived in this county. Out of people who lived in different counties, 50% lived in Louisiana.
88% of the 70117 zip code residents lived in the same house 1 year ago. Out of people who lived in different houses, 71% moved from this county. Out of people who lived in different houses, 5% moved from different county within same state. Out of people who lived in different houses, 18% moved from different state. Out of people who lived in different houses, 4% moved from abroad.
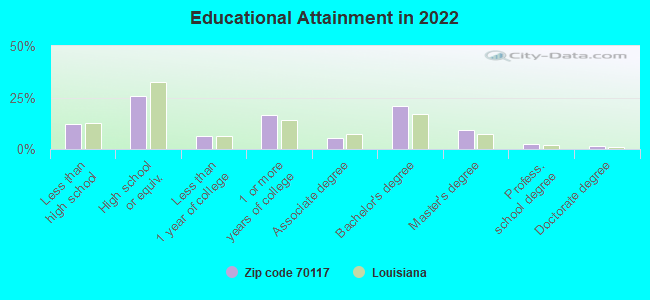
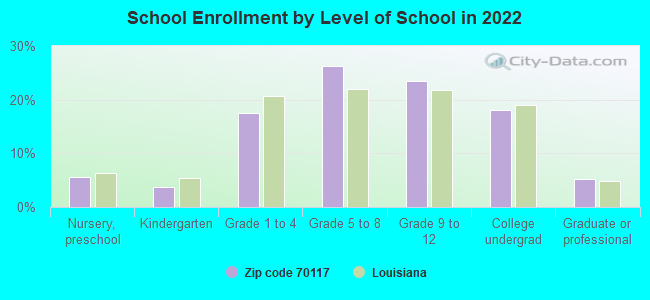
Private vs. public school enrollment:
Students in private schools in grades 1 to 8 (elementary and middle school): 309
Here:
12.9%
Louisiana:
19.6%
Students in private schools in grades 9 to 12 (high school): 234
Here:
17.9%
Louisiana:
18.3%
Students in private undergraduate colleges: 235
Here:
23.6%
Louisiana:
17.4%
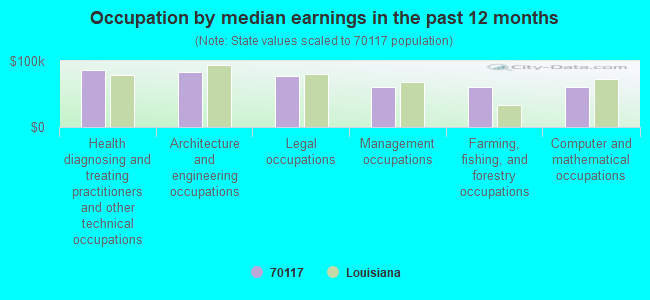
Occupation by median earnings in the past 12 months ($)
85,888Health diagnosing and treating practitioners and other technical occupations
83,024Architecture and engineering occupations
76,972Legal occupations
61,190Management occupations
60,179Farming, fishing, and forestry occupations
59,852Computer and mathematical occupations
Companies with federal contracts located in this zip code (NEW ORLEANS, LA):
NODC LABS,INC (2237 FELICIANA ST; small business) : $1,001,193 in 57 contractsfrom 1999 to 2005
Contracts for Office Supplies, Antennas, Waveguides, and Related Equipment, Radio and Television Communication Equipment, Except Airborne, Radio Navigation Equipment, Except Airborne, and moreby Department of Veterans Affairs, Air Force, NASA, Bureau of Citizenship and Immigration, and others Signed by year:2000: $131,612; 2001: $80,520; 2002: $270,534; 2003: $238,578; 2004: $156,948; 2005: $53,997; 2006: $0.
Biggest contracts:
$98,715 with Department of Veterans Affairs for Office Supplies. Signed on 2004-09-28. Completion date: 2005-05-31.
$85,571 with Air Force for Antennas, Waveguides, and Related Equipment. Signed on 2002-07-03. Completion date: 2002-07-17.
$57,000 with NASA for Radio and Television Communication Equipment, Except Airborne. Signed on 1999-12-15. Completion date: 2000-02-15.
$52,776 with Air Force for Office Supplies. Signed on 2003-12-11. Completion date: 2004-01-05.
GULF BEST ELECTRIC INC (4525 N CLAIBORNE AVE) : $129,823 in 9 contractsfrom 2001 to 2005
Contracts for Electric Services, Maintenance, Repair and Rebuilding of Equipment -- Ship and Marine Equipment, Maintenance, Repair and Rebuilding of Equipment -- Electrical and Electronic Equipment Components, Miscellaneous Electrical and Electronic Components, and moreby U.S. Army Corps of Engineers - civil program financing only, Army Signed by year:2000: $0; 2001: $78,015; 2002: $33,282; 2003: $0; 2004: $7,928; 2005: $10,598; 2006: $0.
Biggest contracts:
$77,000 with U.S. Army Corps of Engineers - civil program financing only for Electric Services. Signed on 2001-03-22. Completion date: 2002-03-22.
$29,082 with U.S. Army Corps of Engineers - civil program financing only for Maintenance, Repair and Rebuilding of Equipment -- Ship and Marine Equipment. Signed on 2002-12-19. Completion date: 2002-12-01.
$5,299 with U.S. Army Corps of Engineers - civil program financing only for Maintenance, Repair and Rebuilding of Equipment -- Electrical and Electronic Equipment Components. Signed on 2005-03-30. Completion date: 2005-09-30.
$5,299 with Army for Maintenance, Repair and Rebuilding of Equipment -- Electrical and Electronic Equipment Components. Signed on 2005-03-30. Completion date: 2005-09-30.
BAILEY HVAC LLC (632 ALVAR ST; small business) : $126,534 in 4 contractsfrom 2002 to 2005
$58,020 with Army for Air Conditioning Equipment. Signed on 2005-07-19. Completion date: 2005-11-28.
$58,020 with U.S. Army Corps of Engineers - civil program financing only for Air Conditioning Equipment. Signed on 2005-07-19. Completion date: 2005-11-28.
$6,142, same as above.Signed on 2003-05-22. Completion date: 2003-05-27.
$4,352 with U.S. Army Corps of Engineers - civil program financing only for Refrigeration and Air Conditioning Components. Signed on 2002-07-24. Completion date: 2002-04-29.
DREYFUS-CORTNEY , INC (4500 N GALVEZ ST; small business) : $118,134 in 4 contractsfrom 2003 to 2004
$47,500 with Navy for Electrical and Electronic assemblies, Boards, Cards, and Associated Hardware. Signed on 2003-02-06. Completion date: 2003-06-02.
$38,025 with National Oceanic and Atmospheric Administration/Under Secretary for Oceans and Atmosphere for Chain and Wire Rope. Signed on 2003-10-21. Completion date: 2004-02-15.
$29,280, same as above.Signed on 2003-04-15. Completion date: 2003-07-15.
$3,329 with Navy for Blocks, Tackle, Rigging, and Slings. Signed on 2004-09-08. Completion date: 2004-09-20.
BAILEY REFRIGERATION OF NEW OR (632 ALVAR ST; small business)
$94,400 with U.S. Army Corps of Engineers - civil program financing only for Maintenance, Repair and Rebuilding of Equipment -- Refrigeration, Air Conditioning, and Air Circulating Equipment. Signed on 2001-06-12. Completion date: 2001-12-31.
BEME WHOLESALE SUPPLY LLC (1615 LAMANCHE ST STE A; small business)
$85,051 with Air Force for ADP Central Processing Unit (CPU, Computer), Analog. Taking place in CA. Signed on 2000-09-29. Completion date: 2000-10-30.
BUBBA'S PRODUCE CO INC (400 MARIGNY ST; small business) : $70,593 in 11 contractsfrom 2005 to 2006
Contracts for Fruits and Vegetables by Defense Logistics Agency Signed by year:2000: $0; 2001: $0; 2002: $0; 2003: $0; 2004: $0; 2005: $46,667; 2006: $23,926.
Biggest contracts:
$13,652 with Defense Logistics Agency for Fruits and Vegetables. Signed on 2005-08-25. Completion date: 2005-08-25.
$13,474, same as above.Signed on 2005-08-25. Completion date: 2005-08-25.
$8,690, same as above.Signed on 2005-09-02. Completion date: 2005-09-02.
$8,203, same as above.Signed on 2005-08-30. Completion date: 2005-08-30.
METFAB, INC. (4566 ST. CLAUDE AVENUE; small business)
$57,594 with U.S. Army Corps of Engineers - civil program financing only for Structural Shapes. Signed on 2000-06-06. Completion date: 2000-07-31.
MASSETT & COMPANY INC (1330 PRESS ST; small business) : $10,982 in 5 contractsfrom 2003 to 2005
Contracts for Maintenance, Repair and Rebuilding of Equipment -- Miscellaneous, Fencing, Fences, Gates and Components, Maintenance, Repair and Rebuilding of Equipment -- Tractors by Navy Signed by year:2000: $0; 2001: $0; 2002: $0; 2003: $6,082; 2004: $4,900; 2005: $0; 2006: $0.
Biggest contracts:
$13,430 with Navy for Maintenance, Repair and Rebuilding of Equipment -- Miscellaneous. Signed on 2005-08-04. Completion date: 2005-12-01.
$4,900 with Navy for Fencing, Fences, Gates and Components. Signed on 2004-08-26. Completion date: 2004-09-07.
$4,750 with Navy for Maintenance, Repair and Rebuilding of Equipment -- Tractors. Signed on 2003-05-30. Completion date: 2003-06-15.
$1,332, same as above.Signed on 2003-07-14. Completion date: 2003-06-15.
APOLLO MARINE SPECIALTIES, INC (4227 ROYAL ST; small business) : $6,191 in 2 contractsfrom 2003 to 2004
$6,500 with Army for Miscellaneous Aircraft Accessories and Components. Signed on 2003-10-30. Completion date: 2003-11-10.
-$309, same as above.Signed on 2004-10-06. Completion date: 2003-11-10.
Top industries in this zip code by the number of employees in 2005:
Administrative and Support and Waste Management and Remediation Services: Janitorial Services (250-499: 1, 20-49: 1, 5-9: 1, 1-4: 2)
Other Services (except Public Administration): Religious Organizations (50-99: 1, 20-49: 2, 10-19: 3, 5-9: 3, 1-4: 6)
Administrative and Support and Waste Management and Remediation Services: Security Guards and Patrol Services (100-249: 1, 10-19: 1)
Other Services (except Public Administration): Commercial and Industrial Machinery and Equipment (except Automotive and Electronic) Repair and Maintenance (100-249: 1, 5-9: 1)
Educational Services: Elementary and Secondary Schools (100-249: 1, 5-9: 1)
Health Care and Social Assistance: Nursing Care Facilities (100-249: 1)
Health Care and Social Assistance: General Medical and Surgical Hospitals (100-249: 1)
People in group quarters in 2010:
109 people in nursing facilities/skilled-nursing facilities
36 people in other noninstitutional facilities
20 people in emergency and transitional shelters (with sleeping facilities) for people experiencing homelessness
16 people in residential treatment centers for adults
10 people in workers' group living quarters and job corps centers
8 people in correctional residential facilities
6 people in group homes intended for adults
6 people in maritime/merchant vessels
People in group quarters in 2000:
88 people in nursing homes
52 people in hospitals/wards and hospices for chronically ill
45 people in homes or halfway houses for drug/alcohol abuse
39 people in other group homes
37 people in hospices or homes for chronically ill
37 people in other noninstitutional group quarters
29 people in religious group quarters
28 people in homes for the mentally ill
26 people in military barracks, etc.
12 people in military hospitals or wards for chronically ill
3 people in other hospitals or wards for chronically ill
Fatal accident statistics in 2014:
Fatal accident count: 9
Vehicles involved in fatal accidents: 13
Fatal accidents caused by drunken drivers: 0
Fatalities: 9
Persons involved in fatal accidents: 14
Pedestrians involved in fatal accidents: 5
Fatal accident statistics in 2013:
Fatal accident count: 4
Vehicles involved in fatal accidents: 7
Fatal accidents caused by drunken drivers: 2
Fatalities: 4
Persons involved in fatal accidents: 10
Pedestrians involved in fatal accidents: 1
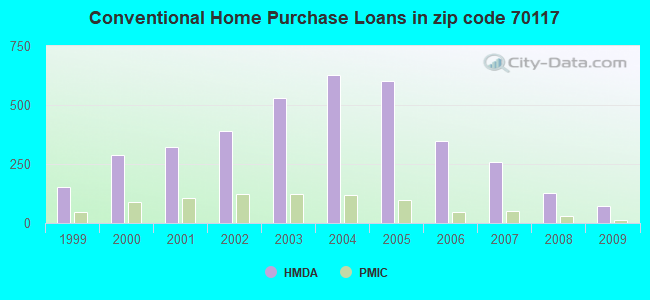
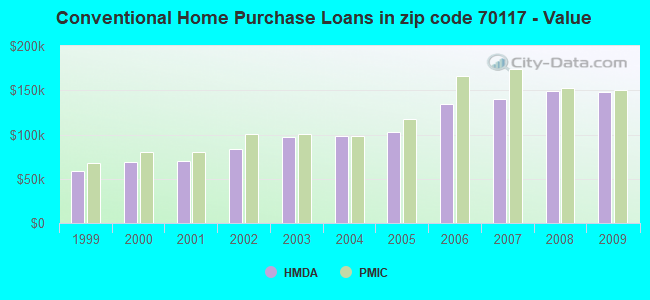
Home Mortgage Disclosure Act Aggregated Statistics For Year 2009 (Based on 16 full and 16 partial tracts)
A) FHA, FSA/RHS & VA Home Purchase Loans
B) Conventional Home Purchase Loans
C) Refinancings
D) Home Improvement Loans
E) Loans on Dwellings For 5+ Families
F) Non-occupant Loans on < 5 Family Dwellings (A B C & D)
G) Loans On Manufactured Home Dwelling (A B C & D)
Number
Average Value
Number
Average Value
Number
Average Value
Number
Average Value
Number
Average Value
Number
Average Value
Number
Average Value
LOANS ORIGINATED
48
$147,064
74
$148,227
252
$138,637
50
$60,017
9
$466,733
161
$119,695
2
$34,500
APPLICATIONS APPROVED, NOT ACCEPTED
2
$90,795
6
$93,068
23
$107,436
6
$100,223
1
$153,000
16
$126,868
0
$0
APPLICATIONS DENIED
14
$151,536
29
$119,156
159
$117,558
113
$38,868
1
$221,300
71
$98,718
7
$91,310
APPLICATIONS WITHDRAWN
11
$142,010
20
$145,748
42
$157,116
11
$54,760
0
$0
16
$139,408
1
$81,000
FILES CLOSED FOR INCOMPLETENESS
2
$101,805
6
$152,370
20
$118,841
11
$98,547
0
$0
9
$117,126
1
$39,000
Aggregated Statistics For Year 2008 (Based on 16 full and 16 partial tracts)
A) FHA, FSA/RHS & VA Home Purchase Loans
B) Conventional Home Purchase Loans
C) Refinancings
D) Home Improvement Loans
E) Loans on Dwellings For 5+ Families
F) Non-occupant Loans on < 5 Family Dwellings (A B C & D)
G) Loans On Manufactured Home Dwelling (A B C & D)
Number
Average Value
Number
Average Value
Number
Average Value
Number
Average Value
Number
Average Value
Number
Average Value
Number
Average Value
LOANS ORIGINATED
27
$158,030
126
$148,629
297
$131,547
64
$70,631
12
$304,717
245
$139,496
11
$61,655
APPLICATIONS APPROVED, NOT ACCEPTED
3
$113,153
18
$156,896
37
$95,253
9
$31,993
0
$0
18
$129,124
6
$113,037
APPLICATIONS DENIED
10
$133,470
87
$125,173
258
$125,102
187
$42,292
3
$246,630
161
$113,247
6
$86,963
APPLICATIONS WITHDRAWN
6
$124,960
30
$164,635
74
$116,463
14
$46,231
0
$0
34
$124,802
0
$0
FILES CLOSED FOR INCOMPLETENESS
0
$0
8
$117,604
29
$118,645
4
$222,528
0
$0
10
$132,525
0
$0
Aggregated Statistics For Year 2007 (Based on 16 full and 16 partial tracts)
A) FHA, FSA/RHS & VA Home Purchase Loans
B) Conventional Home Purchase Loans
C) Refinancings
D) Home Improvement Loans
E) Loans on Dwellings For 5+ Families
F) Non-occupant Loans on < 5 Family Dwellings (A B C & D)
G) Loans On Manufactured Home Dwelling (A B C & D)
Number
Average Value
Number
Average Value
Number
Average Value
Number
Average Value
Number
Average Value
Number
Average Value
Number
Average Value
LOANS ORIGINATED
16
$128,442
257
$139,687
378
$137,896
71
$54,638
5
$457,152
350
$129,612
5
$77,606
APPLICATIONS APPROVED, NOT ACCEPTED
0
$0
52
$147,122
74
$140,324
17
$42,108
0
$0
49
$147,101
5
$166,664
APPLICATIONS DENIED
8
$125,991
119
$132,785
240
$129,445
162
$49,659
1
$128,000
210
$118,045
6
$101,693
APPLICATIONS WITHDRAWN
8
$159,881
51
$126,901
64
$129,779
10
$75,505
1
$175,000
45
$118,883
1
$75,000
FILES CLOSED FOR INCOMPLETENESS
0
$0
23
$134,118
51
$149,932
4
$79,935
0
$0
24
$127,000
0
$0
Aggregated Statistics For Year 2006 (Based on 18 full and 16 partial tracts)
A) FHA, FSA/RHS & VA Home Purchase Loans
B) Conventional Home Purchase Loans
C) Refinancings
D) Home Improvement Loans
E) Loans on Dwellings For 5+ Families
F) Non-occupant Loans on < 5 Family Dwellings (A B C & D)
G) Loans On Manufactured Home Dwelling (A B C & D)
Number
Average Value
Number
Average Value
Number
Average Value
Number
Average Value
Number
Average Value
Number
Average Value
Number
Average Value
LOANS ORIGINATED
10
$157,584
348
$134,643
250
$149,112
44
$41,771
5
$231,178
280
$130,569
3
$38,727
APPLICATIONS APPROVED, NOT ACCEPTED
4
$73,445
39
$105,889
53
$122,768
14
$51,289
0
$0
31
$116,990
4
$55,395
APPLICATIONS DENIED
2
$133,235
135
$121,420
109
$113,784
134
$38,774
1
$131,000
94
$109,360
4
$48,250
APPLICATIONS WITHDRAWN
7
$100,634
45
$118,761
48
$170,177
9
$113,063
0
$0
17
$119,143
2
$195,460
FILES CLOSED FOR INCOMPLETENESS
0
$0
24
$131,232
22
$148,615
2
$50,000
0
$0
18
$118,661
3
$121,350
Aggregated Statistics For Year 2005 (Based on 18 full and 16 partial tracts)
A) FHA, FSA/RHS & VA Home Purchase Loans
B) Conventional Home Purchase Loans
C) Refinancings
D) Home Improvement Loans
E) Loans on Dwellings For 5+ Families
F) Non-occupant Loans on < 5 Family Dwellings (A B C & D)
G) Loans On Manufactured Home Dwelling (A B C & D)
Number
Average Value
Number
Average Value
Number
Average Value
Number
Average Value
Number
Average Value
Number
Average Value
Number
Average Value
LOANS ORIGINATED
29
$91,008
601
$102,466
773
$106,978
113
$38,343
9
$250,146
575
$108,327
1
$28,100
APPLICATIONS APPROVED, NOT ACCEPTED
10
$75,744
152
$79,259
236
$90,926
36
$30,406
0
$0
115
$102,597
16
$38,688
APPLICATIONS DENIED
9
$82,811
307
$79,802
894
$85,049
225
$37,574
2
$107,500
267
$94,470
18
$40,186
APPLICATIONS WITHDRAWN
6
$76,388
132
$96,116
368
$87,329
46
$112,243
2
$100,460
112
$98,262
1
$57,370
FILES CLOSED FOR INCOMPLETENESS
0
$0
33
$88,088
166
$94,326
3
$192,930
0
$0
29
$98,891
0
$0
Aggregated Statistics For Year 2004 (Based on 18 full and 16 partial tracts)
A) FHA, FSA/RHS & VA Home Purchase Loans
B) Conventional Home Purchase Loans
C) Refinancings
D) Home Improvement Loans
E) Loans on Dwellings For 5+ Families
F) Non-occupant Loans on < 5 Family Dwellings (A B C & D)
G) Loans On Manufactured Home Dwelling (A B C & D)
Number
Average Value
Number
Average Value
Number
Average Value
Number
Average Value
Number
Average Value
Number
Average Value
Number
Average Value
LOANS ORIGINATED
46
$78,000
628
$98,678
1,108
$88,773
169
$45,549
7
$609,550
792
$90,301
3
$56,167
APPLICATIONS APPROVED, NOT ACCEPTED
3
$54,503
166
$88,242
263
$75,926
55
$38,550
0
$0
142
$73,963
3
$66,470
APPLICATIONS DENIED
24
$88,073
212
$71,857
1,019
$72,646
327
$31,324
3
$117,290
216
$75,981
8
$53,172
APPLICATIONS WITHDRAWN
9
$76,409
112
$87,566
333
$76,770
27
$47,926
0
$0
81
$82,174
3
$52,410
FILES CLOSED FOR INCOMPLETENESS
7
$84,056
31
$105,019
257
$79,432
9
$56,566
0
$0
45
$83,265
0
$0
Aggregated Statistics For Year 2003 (Based on 18 full and 16 partial tracts)
A) FHA, FSA/RHS & VA Home Purchase Loans
B) Conventional Home Purchase Loans
C) Refinancings
D) Home Improvement Loans
E) Loans on Dwellings For 5+ Families
F) Non-occupant Loans on < 5 Family Dwellings (A B C & D)
Number
Average Value
Number
Average Value
Number
Average Value
Number
Average Value
Number
Average Value
Number
Average Value
LOANS ORIGINATED
67
$84,253
528
$97,072
1,055
$85,431
140
$26,781
7
$163,390
574
$83,881
APPLICATIONS APPROVED, NOT ACCEPTED
11
$67,550
128
$67,501
267
$69,426
43
$30,874
2
$103,715
91
$69,948
APPLICATIONS DENIED
18
$75,976
175
$67,190
1,022
$67,171
210
$20,727
1
$80,000
188
$59,604
APPLICATIONS WITHDRAWN
14
$88,737
76
$88,592
394
$72,879
8
$27,269
0
$0
69
$81,045
FILES CLOSED FOR INCOMPLETENESS
10
$74,642
23
$86,380
58
$79,303
2
$18,500
0
$0
10
$70,213
Aggregated Statistics For Year 2002 (Based on 18 full and 16 partial tracts)
A) FHA, FSA/RHS & VA Home Purchase Loans
B) Conventional Home Purchase Loans
C) Refinancings
D) Home Improvement Loans
E) Loans on Dwellings For 5+ Families
F) Non-occupant Loans on < 5 Family Dwellings (A B C & D)
Number
Average Value
Number
Average Value
Number
Average Value
Number
Average Value
Number
Average Value
Number
Average Value
LOANS ORIGINATED
126
$71,442
390
$83,382
759
$76,417
125
$23,071
10
$207,571
428
$70,907
APPLICATIONS APPROVED, NOT ACCEPTED
16
$79,671
59
$83,471
262
$60,118
57
$26,812
0
$0
55
$63,049
APPLICATIONS DENIED
21
$78,369
140
$72,710
664
$60,138
217
$18,546
4
$116,540
137
$51,446
APPLICATIONS WITHDRAWN
9
$84,156
47
$66,433
292
$65,310
6
$26,188
0
$0
36
$53,695
FILES CLOSED FOR INCOMPLETENESS
6
$61,615
13
$53,932
155
$77,874
0
$0
0
$0
23
$54,266
Aggregated Statistics For Year 2001 (Based on 18 full and 16 partial tracts)
A) FHA, FSA/RHS & VA Home Purchase Loans
B) Conventional Home Purchase Loans
C) Refinancings
D) Home Improvement Loans
E) Loans on Dwellings For 5+ Families
F) Non-occupant Loans on < 5 Family Dwellings (A B C & D)
Number
Average Value
Number
Average Value
Number
Average Value
Number
Average Value
Number
Average Value
Number
Average Value
LOANS ORIGINATED
195
$70,658
320
$69,622
712
$69,753
149
$21,517
4
$302,685
317
$55,962
APPLICATIONS APPROVED, NOT ACCEPTED
13
$64,752
55
$51,765
197
$54,538
58
$18,883
0
$0
46
$52,537
APPLICATIONS DENIED
27
$63,863
116
$61,462
758
$57,641
305
$17,043
2
$230,000
135
$47,169
APPLICATIONS WITHDRAWN
17
$78,591
65
$61,837
313
$58,326
33
$27,377
0
$0
46
$45,828
FILES CLOSED FOR INCOMPLETENESS
4
$97,910
19
$51,343
151
$65,909
4
$43,528
0
$0
14
$50,074
Aggregated Statistics For Year 2000 (Based on 18 full and 16 partial tracts)
A) FHA, FSA/RHS & VA Home Purchase Loans
B) Conventional Home Purchase Loans
C) Refinancings
D) Home Improvement Loans
E) Loans on Dwellings For 5+ Families
F) Non-occupant Loans on < 5 Family Dwellings (A B C & D)
Number
Average Value
Number
Average Value
Number
Average Value
Number
Average Value
Number
Average Value
Number
Average Value
LOANS ORIGINATED
141
$63,818
289
$68,972
434
$58,510
157
$19,582
2
$149,880
206
$53,295
APPLICATIONS APPROVED, NOT ACCEPTED
21
$60,130
69
$54,736
207
$44,944
78
$23,161
0
$0
44
$42,793
APPLICATIONS DENIED
52
$59,907
162
$53,988
851
$48,374
345
$17,424
2
$3,111,670
122
$46,966
APPLICATIONS WITHDRAWN
13
$72,626
66
$47,913
427
$43,684
35
$24,440
0
$0
38
$44,294
FILES CLOSED FOR INCOMPLETENESS
7
$50,620
38
$59,923
259
$51,204
6
$22,282
0
$0
41
$51,965
Aggregated Statistics For Year 1999 (Based on 17 full and 7 partial tracts)
A) FHA, FSA/RHS & VA Home Purchase Loans
B) Conventional Home Purchase Loans
C) Refinancings
D) Home Improvement Loans
E) Loans on Dwellings For 5+ Families
F) Non-occupant Loans on < 5 Family Dwellings (A B C & D)
2002 - 2018 National Fire Incident Reporting System (NFIRS) incidents
Based on the data from the years 2002 - 2018 the average number of fire incidents per year is 224. The highest number of fire incidents - 630 took place in 2002, and the least - 0 in 2017. The data has a decreasing trend.
When looking into fire subcategories, the most incidents belonged to: Mobile Property/Vehicle Fires (40.7%), and Structure Fires (39.3%).
Fire incident types reported to NFIRS in Zip Code 70117


 Nearest zip codes: 70114, 70032, 70116, 70139, 70112, 70163.
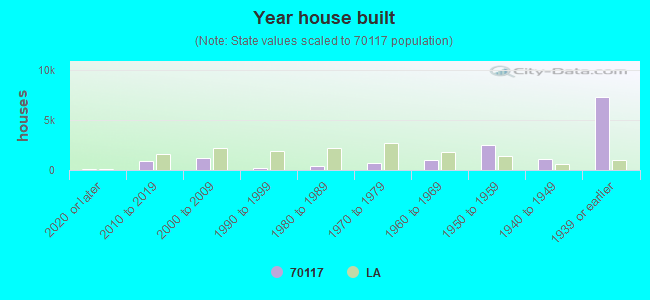


 Based on the data from the years 2002 - 2018 the average number of fire incidents per year is 224. The highest number of fire incidents - 630 took place in 2002, and the least - 0 in 2017. The data has a decreasing trend.
 When looking into fire subcategories, the most incidents belonged to: Mobile Property/Vehicle Fires (40.7%), and Structure Fires (39.3%).