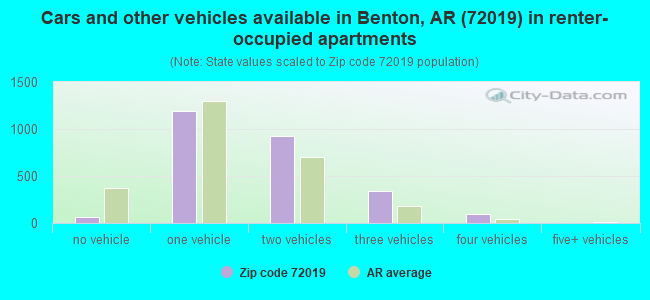
Houses and condos: 11,878 Renter-occupied apartments: 2,687
% of renters here:
23%
State:
34%
March 2022 cost of living index in zip code 72019: 80.0 (low, U.S. average is 100)
Land area: 164.6 sq. mi. Water area: 0.5 sq. mi.
Population density: 181 people per square mile
(very low).
OSM Map
Google Map
MSN Map
OSM Map
General Map
Google Map
MSN Map
OSM Map
Google Map
MSN Map
OSM Map
Google Map
MSN Map
Please wait while loading the map...
Real estate property taxes paid for housing units in 2022:
This zip code:
0.6% ($1,592)
Arkansas:
0.5% ($977)
Median real estate property taxes paid for housing units with mortgages in 2022: $1,721 (0.6%) Median real estate property taxes paid for housing units with no mortgage in 2022: $1,454 (0.6%)
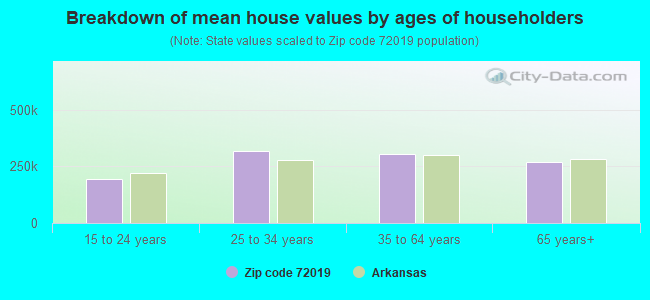
Estimated median house/condo value in 2022: $260,843
72019:
$260,843
Arkansas:
$179,800
According to our research of Arkansas and other state lists, there were 23 registered sex offenders living in 72019 zip code as of April 23, 2024. The ratio of all residents to sex offenders in zip code 72019 is 1,065 to 1. The ratio of registered sex offenders to all residents in this zip code is lower than the state average.
Median resident age:
This zip code:
39.2 years
Arkansas median age:
38.9 years
Average household size:
This zip code:
2.6 people
Arkansas:
2.4 people
Averages for the 2020 tax year for zip code 72019, filed in 2021:
Average Adjusted Gross Income (AGI) in 2020: $77,536 (Individual Income Tax Returns)
Here:
$77,536
State:
$64,872
Salary/wage: $65,968 (reported on 82.3% of returns)
Here:
$65,968
State:
$50,644
(% of AGI for various income ranges: 1187.4% for AGIs below $25k, 3615.0% for AGIs $25k-50k, 6388.1% for AGIs $50k-75k, 9696.5% for AGIs $75k-100k, 17927.4% for AGIs $100k-200k, 51181.9% for AGIs over 200k)
Taxable interest for individuals: $1,408 (reported on 31.3% of returns)
This zip code:
$1,408
Arkansas:
$1,857
(% of AGI for various income ranges: 19.2% for AGIs below $25k, 22.5% for AGIs $25k-50k, 36.6% for AGIs $50k-75k, 54.5% for AGIs $75k-100k, 97.1% for AGIs $100k-200k, 798.5% for AGIs over 200k)
Ordinary dividends: $4,223 (reported on 17.0% of returns)
Here:
$4,223
State:
$21,681
(% of AGI for various income ranges: 21.9% for AGIs below $25k, 30.4% for AGIs $25k-50k, 60.4% for AGIs $50k-75k, 77.4% for AGIs $75k-100k, 172.2% for AGIs $100k-200k, 1404.1% for AGIs over 200k)
Net capital gain/loss in AGI: +$10,854 (reported on 15.7% of returns)
Here:
+$10,854
State:
+$22,815
(% of AGI for various income ranges: 11.0% for AGIs below $25k, 15.8% for AGIs $25k-50k, 75.6% for AGIs $50k-75k, 151.7% for AGIs $75k-100k, 373.6% for AGIs $100k-200k, 4761.9% for AGIs over 200k)
Profit/loss from business: +$11,552 (reported on 17.2% of returns)
Here:
+$11,552
State:
+$9,743
(% of AGI for various income ranges: 112.9% for AGIs below $25k, 170.6% for AGIs $25k-50k, 179.3% for AGIs $50k-75k, 380.9% for AGIs $75k-100k, 345.5% for AGIs $100k-200k, 2793.3% for AGIs over 200k)
Taxable individual retirement arrangement distribution: $19,266 (reported on 9.4% of returns)
72019:
$19,266
Arkansas:
$18,502
(% of AGI for various income ranges: 65.1% for AGIs below $25k, 112.5% for AGIs $25k-50k, 207.2% for AGIs $50k-75k, 358.3% for AGIs $75k-100k, 608.4% for AGIs $100k-200k, 1387.8% for AGIs over 200k)
Self-employed (Keogh) retirement plans: $21,033 (reported on 0.2% of returns)
72019:
$21,033
Arkansas:
$24,438
(% of AGI for various income ranges: 41.5% for AGIs $100k-200k)
Total itemized deductions: $32,371 (reported on 9.3% of returns)
Here:
$32,371
State:
$52,840
(% of AGI for various income ranges: 34.5% for AGIs below $25k, 94.2% for AGIs $25k-50k, 268.5% for AGIs $50k-75k, 376.3% for AGIs $75k-100k, 954.3% for AGIs $100k-200k, 5195.6% for AGIs over 200k)
Charity contributions: $13,232 (reported on 8.2% of returns)
Here:
$13,232
State:
$35,735
(% of AGI for various income ranges: 3.5% for AGIs below $25k, 19.6% for AGIs $25k-50k, 58.4% for AGIs $50k-75k, 102.5% for AGIs $75k-100k, 358.2% for AGIs $100k-200k, 2275.9% for AGIs over 200k)
Taxes paid: $7,805 (reported on 9.3% of returns)
72019:
$7,805
State:
$7,196
(% of AGI for various income ranges: 4.6% for AGIs below $25k, 15.0% for AGIs $25k-50k, 52.7% for AGIs $50k-75k, 96.6% for AGIs $75k-100k, 270.9% for AGIs $100k-200k, 1154.4% for AGIs over 200k)
Earned income credit: $2,275 (reported on 12.5% of returns)
Here:
$2,275
State:
$2,546
(% of AGI for various income ranges: 84.2% for AGIs below $25k, 65.5% for AGIs $25k-50k, 1.2% for AGIs $50k-75k)
Percentage of individuals using paid preparers for their 2020 taxes: 93.6%
Here:
94%
State:
94%
(% for various income ranges: 92.6% for AGIs below $25k, 94.4% for AGIs $25k-50k, 93.0% for AGIs $50k-75k, 93.7% for AGIs $75k-100k, 93.8% for AGIs $100k-200k, 95.7% for AGIs over 200k)
Averages for the 2012 tax year for zip code 72019, filed in 2013:
Average Adjusted Gross Income (AGI) in 2012: $63,459 (Individual Income Tax Returns)
Here:
$63,459
State:
$52,148
Salary/wage: $55,705 (reported on 83.7% of returns)
Here:
$55,705
State:
$41,669
(% of AGI for various income ranges: 71.3% for AGIs below $25k, 75.8% for AGIs $25k-50k, 76.9% for AGIs $50k-75k, 76.4% for AGIs $75k-100k, 79.4% for AGIs $100k-200k, 56.0% for AGIs over 200k)
Taxable interest for individuals: $1,330 (reported on 32.9% of returns)
This zip code:
$1,330
Arkansas:
$1,648
(% of AGI for various income ranges: 1.2% for AGIs below $25k, 0.8% for AGIs $25k-50k, 0.5% for AGIs $50k-75k, 0.5% for AGIs $75k-100k, 0.6% for AGIs $100k-200k, 1.0% for AGIs over 200k)
Ordinary dividends: $2,955 (reported on 17.7% of returns)
Here:
$2,955
State:
$20,675
(% of AGI for various income ranges: 1.0% for AGIs below $25k, 0.8% for AGIs $25k-50k, 0.8% for AGIs $50k-75k, 0.4% for AGIs $75k-100k, 0.8% for AGIs $100k-200k, 1.2% for AGIs over 200k)
Net capital gain/loss in AGI: +$7,591 (reported on 13.1% of returns)
Here:
+$7,591
State:
+$15,222
(% of AGI for various income ranges: 0.5% for AGIs $25k-50k, 0.2% for AGIs $50k-75k, 0.7% for AGIs $75k-100k, 1.0% for AGIs $100k-200k, 5.8% for AGIs over 200k)
Profit/loss from business: +$12,763 (reported on 17.2% of returns)
Here:
+$12,763
State:
+$9,665
(% of AGI for various income ranges: 7.6% for AGIs below $25k, 3.7% for AGIs $25k-50k, 2.7% for AGIs $50k-75k, 2.9% for AGIs $75k-100k, 2.6% for AGIs $100k-200k, 4.7% for AGIs over 200k)
Taxable individual retirement arrangement distribution: $13,167 (reported on 9.9% of returns)
72019:
$13,167
Arkansas:
$13,644
(% of AGI for various income ranges: 2.7% for AGIs below $25k, 2.5% for AGIs $25k-50k, 2.4% for AGIs $50k-75k, 2.1% for AGIs $75k-100k, 2.0% for AGIs $100k-200k, 1.4% for AGIs over 200k)
Self-employment retirement plans: $17,450 (reported on 0.4% of returns)
72019:
$17,450
Arkansas:
$20,153
Total itemized deductions: $22,639 (20% of AGI, reported on 37.8% of returns)
Here:
$22,639
State:
$23,276
Here:
20.2% of AGI
State:
19.1% of AGI
(% of AGI for various income ranges: 7.5% for AGIs below $25k, 10.5% for AGIs $25k-50k, 11.2% for AGIs $50k-75k, 13.5% for AGIs $75k-100k, 16.0% for AGIs $100k-200k, 14.6% for AGIs over 200k)
Charity contributions: $5,312 (reported on 31.7% of returns)
Here:
$5,312
State:
$5,996
(% of AGI for various income ranges: 1.0% for AGIs below $25k, 2.0% for AGIs $25k-50k, 2.1% for AGIs $50k-75k, 2.7% for AGIs $75k-100k, 3.1% for AGIs $100k-200k, 3.3% for AGIs over 200k)
Taxes paid: $8,154 (reported on 37.7% of returns)
72019:
$8,154
State:
$7,941
(% of AGI for various income ranges: 1.0% for AGIs below $25k, 2.2% for AGIs $25k-50k, 3.1% for AGIs $50k-75k, 4.4% for AGIs $75k-100k, 6.5% for AGIs $100k-200k, 6.7% for AGIs over 200k)
Earned income credit: $2,214 (reported on 14.2% of returns)
Here:
$2,214
State:
$2,455
(% of AGI for various income ranges: 5.8% for AGIs below $25k, 1.1% for AGIs $25k-50k)
Percentage of individuals using paid preparers for their 2012 taxes: 58.2%
Here:
58%
State:
61%
(% for various income ranges: 53.0% for AGIs below $25k, 58.4% for AGIs $25k-50k, 61.1% for AGIs $50k-75k, 60.2% for AGIs $75k-100k, 60.6% for AGIs $100k-200k, 79.4% for AGIs over 200k)
Household received Food Stamps/SNAP in the past 12 months: 439 Household did not receive Food Stamps/SNAP in the past 12 months: 11,171
Women who had a birth in the past 12 months: 333 (261 now married, 75 unmarried) Women who did not have a birth in the past 12 months: 7,313 (3,814 now married, 3,507 unmarried)
Housing units in zip code 72019 with a mortgage: 5,384 (474 second mortgage, 412 both second mortgage and home equity loan) Houses without a mortgage: 175
Median monthly owner costs for units with a mortgage: $1,526 Median monthly owner costs for units without a mortgage: $466
Residents with income below the poverty level in 2022:
This zip code:
8.6%
Whole state:
16.8%
Residents with income below 50% of the poverty level in 2022:
This zip code:
1.8%
Whole state:
8.5%
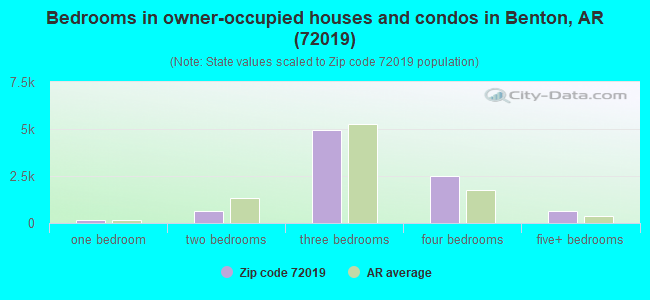
Median number of rooms in houses and condos:
Here:
6.5
State:
6.1
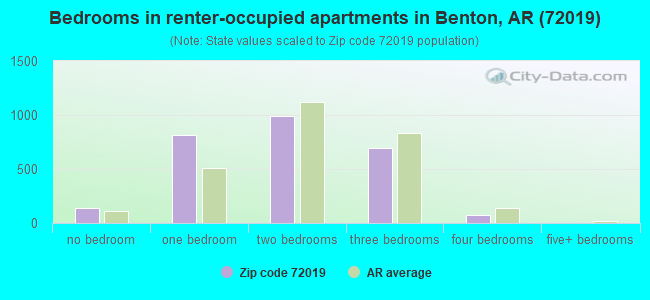
Median number of rooms in apartments:
Here:
3.7
State:
4.3
Notable locations in this zip code not listed on our city pages
Notable locations in zip code 72019: Longhills Golf Course (A), Camp Quapaw (B), Salem Fire Department Station 1 (C), Salem Fire Department Station 2 (D), Salem Fire Department Station 3 (E), Salem Fire Department Station 4 (F), Springhill Volunteer Fire Department (G), Turtle Creek Volunteer Fire Department Station 2 (H), Turtle Creek Volunteer Fire Department Station 3 (I), Benton Fire Department Station 4 (J), Lonsdale Fire Department Station 2 (K). Display/hide their locations on the map
Churches in zip code 72019 include: Fairplay Baptist Church (A), Faith Church (B), Grape Chapel (C), Gravel Hill Church (D), Kentucky Church (E), Calvary Baptist Church (F), First Lutheran Church (G), First Pentecostal Church (H), Salem Baptist Church (I). Display/hide their locations on the map
Cemeteries: Langley Cemetery (1), McPherson Cemetery (2), Scott Cemetery (3), Old Union Cemetery (4), Hammonds Cemetery (5), Fairplay Cemetery (6), Moore Cemetery (7). Display/hide their locations on the map
Lakes and reservoirs: Masoner Lake (A), Barr Lake (B), Pathway Youth Camp Lake (C), Dawson Lake (D), Buffington Lake (E), Wise Lake (F), Ledbetter Lake (G), Cecil Jones Lake (H). Display/hide their locations on the map
Streams, rivers, and creeks: Moccasin Creek (A), Mill Creek (B), McNeil Creek (C), Little Hurricane Creek (D), Alum Fork Saline River (E), Williams Creek (F), Haw Creek (G), Dotson Branch (H), Dry Creek (I). Display/hide their locations on the map
5,074 married couples with children.
1,419 single-parent households (544 men, 875 women).
92.6% of residents of 72019 zip code speak English at home.
4.4% of residents speak Spanish at home (69% very well, 24% well, 6% not well, 1% not at all).
0.6% of residents speak other Indo-European language at home (100% very well).
2.2% of residents speak Asian or Pacific Island language at home (60% very well, 9% well, 12% not well, 18% not at all).
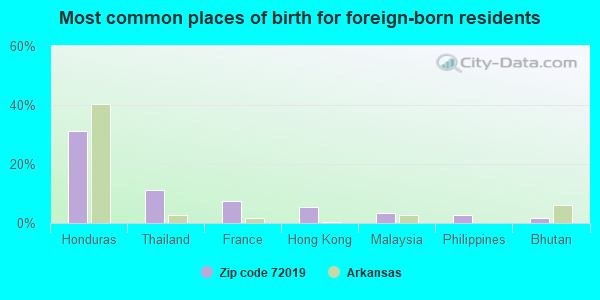
Foreign born population: 1,259 (4.2%) (47.2% of them are naturalized citizens)
This zip code:
4.2%
Whole state:
5.1%
31%Honduras
11%Thailand
7%France
5%Hong Kong
3%Malaysia
3%Philippines
2%Bhutan
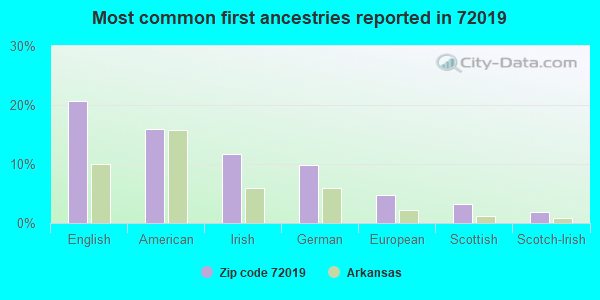
21%English
16%American
12%Irish
10%German
5%European
3%Scottish
2%Scotch-Irish
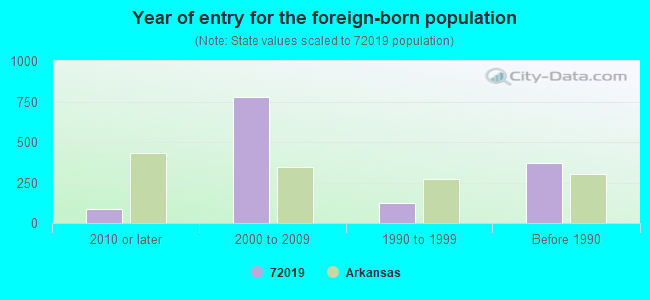
Year of entry for the foreign-born population
842010 or later
7792000 to 2009
1211990 to 1999
371Before 1990
Housing units lacking complete plumbing facilities: 1.4% Housing units lacking complete kitchen facilities: 1.4%
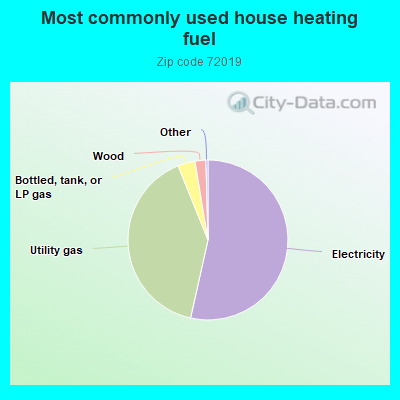
53.5%Electricity
40.4%Utility gas
3.5%Bottled, tank, or LP gas
2.2%Wood
Place of birth for U.S.-born residents:
This state: 19,506
Northeast: 399
Midwest: 2,675
South: 3,977
West: 1,775
90% of the 72019 zip code residents lived in the same house 1 year ago. Out of people who lived in different houses, 53% moved from this county. Out of people who lived in different houses, 21% moved from different county within same state. Out of people who lived in different houses, 22% moved from different state. Out of people who lived in different houses, 2% moved from abroad.
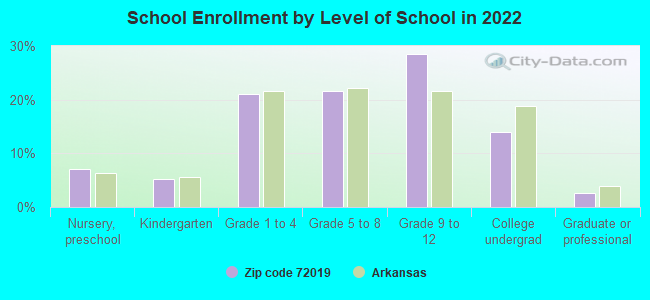
Private vs. public school enrollment:
Students in private schools in grades 1 to 8 (elementary and middle school): 164
Here:
5.7%
Arkansas:
10.5%
Students in private schools in grades 9 to 12 (high school): 169
Here:
8.8%
Arkansas:
8.7%
Students in private undergraduate colleges: 144
Here:
15.1%
Arkansas:
19.4%
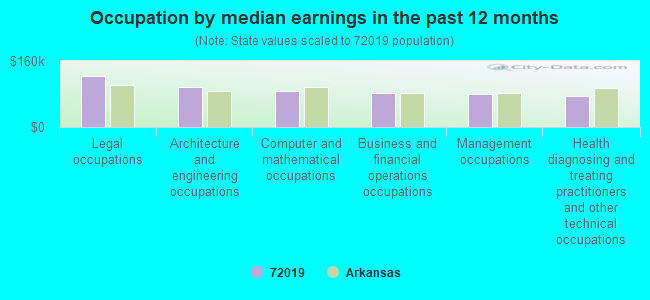
Occupation by median earnings in the past 12 months ($)
123,417Legal occupations
97,881Architecture and engineering occupations
86,482Computer and mathematical occupations
82,133Business and financial operations occupations
79,464Management occupations
74,913Health diagnosing and treating practitioners and other technical occupations
Top industries in this zip code by the number of employees in 2005:
Other Services (except Public Administration): Religious Organizations (10-19 employees: 1 establishment, 5-9 employees: 3 establishments, 1-4 employees: 1 establishment)
Accommodation and Food Services: Full-Service Restaurants (10-19: 1)
Accommodation and Food Services: Snack and Nonalcoholic Beverage Bars (5-9: 1, 1-4: 1)
Arts, Entertainment, and Recreation: Fitness and Recreational Sports Centers (5-9: 1)
Accommodation and Food Services: Hotels (except Casino Hotels) and Motels (5-9: 1)
Real Estate and Rental and Leasing: Offices of Real Estate Agents and Brokers (1-4: 2)
Professional, Scientific, and Technical Services: Engineering Services (1-4: 2)
Administrative and Support and Waste Management and Remediation Services: Janitorial Services (1-4: 2)
Construction: Electrical Contractors (1-4: 2)
Health Care and Social Assistance: Offices of Physicians (except Mental Health Specialists) (1-4: 2)
Fatal accident statistics in 2014:
Fatal accident count: 1
Vehicles involved in fatal accidents: 1
Fatal accidents caused by drunken drivers: 0
Fatalities: 1
Persons involved in fatal accidents: 1
Pedestrians involved in fatal accidents: 0
Fatal accident statistics in 2013:
Fatal accident count: 6
Vehicles involved in fatal accidents: 7
Fatal accidents caused by drunken drivers: 1
Fatalities: 6
Persons involved in fatal accidents: 9
Pedestrians involved in fatal accidents: 1
2006 - 2018 National Fire Incident Reporting System (NFIRS) incidents
Based on the data from the years 2006 - 2018 the average number of fires per year is 87. The highest number of fire incidents - 116 took place in 2017, and the least - 31 in 2006. The data has a growing trend.
When looking into fire subcategories, the most reports belonged to: Outside Fires (52.4%), and Structure Fires (38.9%).
Fire incident types reported to NFIRS in Zip Code 72019


 Based on the data from the years 2006 - 2018 the average number of fires per year is 87. The highest number of fire incidents - 116 took place in 2017, and the least - 31 in 2006. The data has a growing trend.
 When looking into fire subcategories, the most reports belonged to: Outside Fires (52.4%), and Structure Fires (38.9%).