Estimated zip code population in 2022: 5,303 Zip code population in 2010: 3,568 Zip code population in 2000: 2,712
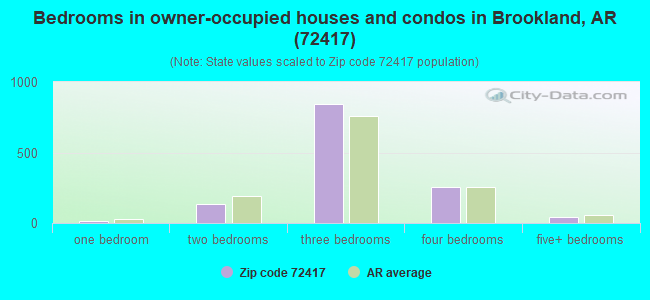
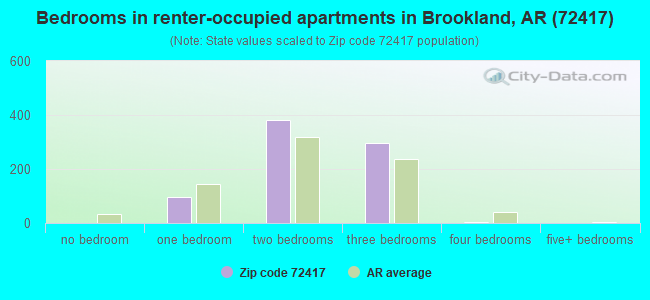
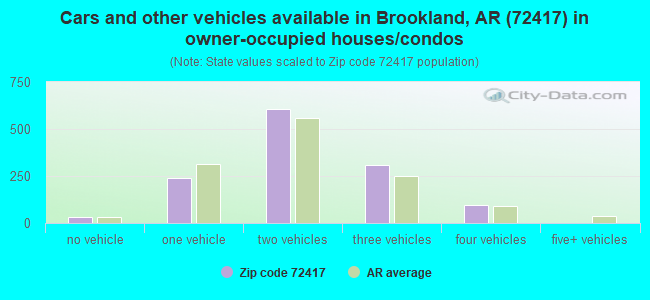
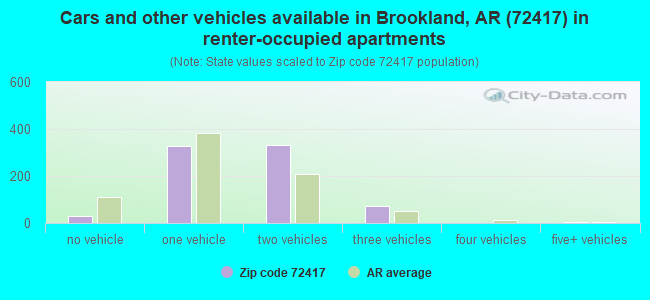
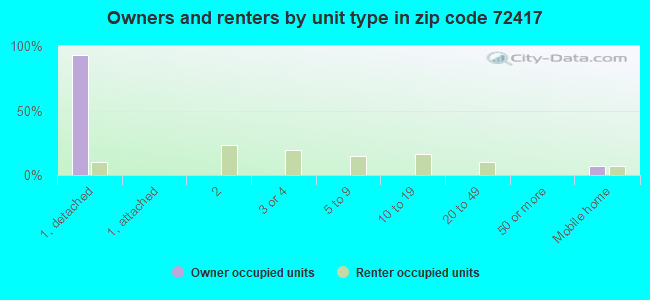
Houses and condos: 2,190 Renter-occupied apartments: 782
% of renters here:
38%
State:
34%
March 2022 cost of living index in zip code 72417: 79.4 (low, U.S. average is 100)
Land area: 45.7 sq. mi. Water area: 0.1 sq. mi.
Population density: 116 people per square mile
(very low).
OSM Map
General Map
Google Map
MSN Map
OSM Map
General Map
Google Map
MSN Map
OSM Map
General Map
Google Map
MSN Map
OSM Map
General Map
Google Map
MSN Map
Please wait while loading the map...
Real estate property taxes paid for housing units in 2022:
This zip code:
0.4% ($739)
Arkansas:
0.5% ($977)
Median real estate property taxes paid for housing units with mortgages in 2022: $705 (0.4%) Median real estate property taxes paid for housing units with no mortgage in 2022: $785 (0.5%)
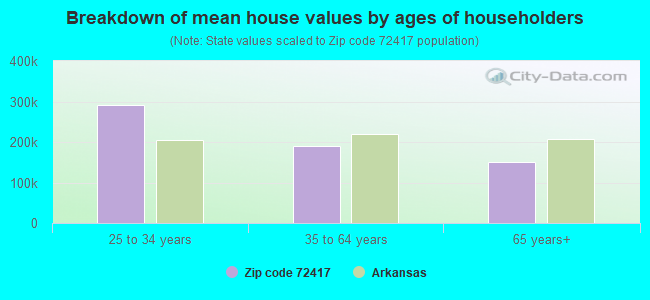
Estimated median house/condo value in 2022: $175,593
72417:
$175,593
Arkansas:
$179,800
According to our research of Arkansas and other state lists, there were 3 registered sex offenders living in 72417 zip code as of April 24, 2024. The ratio of all residents to sex offenders in zip code 72417 is 1,483 to 1. The ratio of registered sex offenders to all residents in this zip code is much lower than the state average.
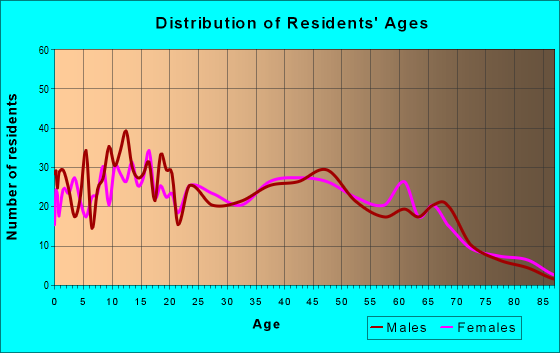
Median resident age:
This zip code:
29.2 years
Arkansas median age:
38.9 years
Average household size:
This zip code:
2.6 people
Arkansas:
2.4 people
Averages for the 2020 tax year for zip code 72417, filed in 2021:
Average Adjusted Gross Income (AGI) in 2020: $55,325 (Individual Income Tax Returns)
Here:
$55,325
State:
$64,872
Salary/wage: $49,296 (reported on 90.6% of returns)
Here:
$49,296
State:
$50,644
(% of AGI for various income ranges: 1307.6% for AGIs below $25k, 3860.2% for AGIs $25k-50k, 6640.9% for AGIs $50k-75k, 9848.4% for AGIs $75k-100k, 17176.1% for AGIs $100k-200k)
Taxable interest for individuals: $579 (reported on 19.7% of returns)
This zip code:
$579
Arkansas:
$1,857
(% of AGI for various income ranges: 6.0% for AGIs below $25k, 12.0% for AGIs $25k-50k, 14.8% for AGIs $50k-75k, 4.7% for AGIs $75k-100k, 20.6% for AGIs $100k-200k)
Ordinary dividends: $1,212 (reported on 7.0% of returns)
Here:
$1,212
State:
$21,681
(% of AGI for various income ranges: 3.1% for AGIs below $25k, 7.3% for AGIs $25k-50k, 15.2% for AGIs $50k-75k, 11.6% for AGIs $75k-100k, 39.4% for AGIs $100k-200k)
Net capital gain/loss in AGI: +$10,529 (reported on 7.0% of returns)
Here:
+$10,529
State:
+$22,815
(% of AGI for various income ranges: 5.5% for AGIs below $25k, 2.0% for AGIs $25k-50k, 43.0% for AGIs $50k-75k, 25.8% for AGIs $75k-100k, 862.8% for AGIs $100k-200k)
Profit/loss from business: +$7,402 (reported on 17.2% of returns)
Here:
+$7,402
State:
+$9,743
(% of AGI for various income ranges: 97.4% for AGIs below $25k, 78.0% for AGIs $25k-50k, 158.8% for AGIs $50k-75k, 430.5% for AGIs $75k-100k, 386.1% for AGIs $100k-200k)
Taxable individual retirement arrangement distribution: $12,700 (reported on 3.7% of returns)
72417:
$12,700
Arkansas:
$18,502
(% of AGI for various income ranges: 20.3% for AGIs below $25k, 56.8% for AGIs $25k-50k, 355.8% for AGIs $75k-100k)
Total itemized deductions: $27,800 (reported on 3.3% of returns)
Here:
$27,800
State:
$52,840
(% of AGI for various income ranges: 280.3% for AGIs $50k-75k, 721.7% for AGIs $100k-200k)
Charity contributions: $9,400 (reported on 2.5% of returns)
Here:
$9,400
State:
$35,735
(% of AGI for various income ranges: 59.4% for AGIs $50k-75k, 204.4% for AGIs $100k-200k)
Taxes paid: $6,438 (reported on 3.3% of returns)
72417:
$6,438
State:
$7,196
(% of AGI for various income ranges: 47.3% for AGIs $50k-75k, 199.4% for AGIs $100k-200k)
Earned income credit: $2,538 (reported on 19.7% of returns)
Here:
$2,538
State:
$2,546
(% of AGI for various income ranges: 117.6% for AGIs below $25k, 81.5% for AGIs $25k-50k)
Percentage of individuals using paid preparers for their 2020 taxes: 95.9%
Here:
96%
State:
94%
(% for various income ranges: 96.0% for AGIs below $25k, 95.8% for AGIs $25k-50k, 95.2% for AGIs $50k-75k, 96.0% for AGIs $75k-100k, 96.3% for AGIs $100k-200k, 100.0% for AGIs over 200k)
Averages for the 2012 tax year for zip code 72417, filed in 2013:
Average Adjusted Gross Income (AGI) in 2012: $40,928 (Individual Income Tax Returns)
Here:
$40,928
State:
$52,148
Salary/wage: $37,413 (reported on 89.9% of returns)
Here:
$37,413
State:
$41,669
(% of AGI for various income ranges: 80.8% for AGIs below $25k, 86.0% for AGIs $25k-50k, 84.9% for AGIs $50k-75k, 81.7% for AGIs $75k-100k, 75.6% for AGIs $100k-200k)
Taxable interest for individuals: $616 (reported on 23.9% of returns)
This zip code:
$616
Arkansas:
$1,648
(% of AGI for various income ranges: 0.5% for AGIs below $25k, 0.3% for AGIs $25k-50k, 0.6% for AGIs $50k-75k, 0.1% for AGIs $75k-100k, 0.2% for AGIs $100k-200k)
Ordinary dividends: $1,008 (reported on 7.5% of returns)
Here:
$1,008
State:
$20,675
(% of AGI for various income ranges: 0.4% for AGIs below $25k, 0.1% for AGIs $25k-50k, 0.3% for AGIs $50k-75k, 0.2% for AGIs $100k-200k)
Net capital gain/loss in AGI: +$3,133 (reported on 5.7% of returns)
Here:
+$3,133
State:
+$15,222
(% of AGI for various income ranges: 0.8% for AGIs $50k-75k, 1.1% for AGIs $100k-200k)
Profit/loss from business: +$9,704 (reported on 17.6% of returns)
Here:
+$9,704
State:
+$9,665
(% of AGI for various income ranges: 10.2% for AGIs below $25k, 3.2% for AGIs $25k-50k, 2.7% for AGIs $50k-75k, 2.9% for AGIs $75k-100k, 4.2% for AGIs $100k-200k)
Taxable individual retirement arrangement distribution: $7,888 (reported on 5.0% of returns)
72417:
$7,888
Arkansas:
$13,644
(% of AGI for various income ranges: 1.7% for AGIs below $25k, 1.1% for AGIs $25k-50k, 1.8% for AGIs $50k-75k)
Total itemized deductions: $17,619 (20% of AGI, reported on 17.0% of returns)
Here:
$17,619
State:
$23,276
Here:
20.4% of AGI
State:
19.1% of AGI
(% of AGI for various income ranges: 3.4% for AGIs below $25k, 4.5% for AGIs $25k-50k, 6.7% for AGIs $50k-75k, 9.6% for AGIs $75k-100k, 12.3% for AGIs $100k-200k)
Charity contributions: $3,624 (reported on 13.2% of returns)
Here:
$3,624
State:
$5,996
(% of AGI for various income ranges: 0.8% for AGIs $25k-50k, 1.4% for AGIs $50k-75k, 1.6% for AGIs $75k-100k, 1.8% for AGIs $100k-200k)
Taxes paid: $5,804 (reported on 17.0% of returns)
72417:
$5,804
State:
$7,941
(% of AGI for various income ranges: 0.4% for AGIs below $25k, 0.9% for AGIs $25k-50k, 1.8% for AGIs $50k-75k, 3.0% for AGIs $75k-100k, 5.7% for AGIs $100k-200k)
Earned income credit: $2,300 (reported on 27.7% of returns)
Here:
$2,300
State:
$2,455
(% of AGI for various income ranges: 8.5% for AGIs below $25k, 1.8% for AGIs $25k-50k)
Percentage of individuals using paid preparers for their 2012 taxes: 66.7%
Here:
67%
State:
61%
(% for various income ranges: 61.5% for AGIs below $25k, 63.8% for AGIs $25k-50k, 71.4% for AGIs $50k-75k, 80.0% for AGIs $75k-100k, 88.9% for AGIs $100k-200k)
Averages for the 2004 tax year for zip code 72417, filed in 2005:
Average Adjusted Gross Income (AGI) in 2004: $32,907 (Individual Income Tax Returns)
Here:
$32,907
State:
$39,270
Salary/wage: $30,663 (reported on 87.4% of returns)
Here:
$30,663
State:
$34,079
(% of AGI for various income ranges: 125.3% for AGIs below $10k, 77.7% for AGIs $10k-25k, 84.1% for AGIs $25k-50k, 84.2% for AGIs $50k-75k, 87.4% for AGIs $75k-100k, 58.2% for AGIs over 100k)
Taxable interest for individuals: $842 (reported on 30.3% of returns)
This zip code:
$842
Arkansas:
$1,904
(% of AGI for various income ranges: 2.0% for AGIs below $10k, 0.9% for AGIs $10k-25k, 0.7% for AGIs $25k-50k, 1.2% for AGIs $50k-75k, 0.1% for AGIs $75k-100k, 0.3% for AGIs over 100k)
Taxable dividends: $617 (reported on 11.2% of returns)
Here:
$617
State:
$5,995
(% of AGI for various income ranges: 2.6% for AGIs below $10k, 0.3% for AGIs $10k-25k, 0.1% for AGIs $25k-50k, 0.1% for AGIs $50k-75k, 0.1% for AGIs $75k-100k, 0.2% for AGIs over 100k)
Net capital gain/loss: +$3,519 (reported on 9.1% of returns)
Here:
+$3,519
State:
+$10,430
(% of AGI for various income ranges: -1.0% for AGIs below $10k, 0.1% for AGIs $10k-25k, 0.5% for AGIs $25k-50k, 1.9% for AGIs $50k-75k, 0.2% for AGIs $75k-100k, 2.5% for AGIs over 100k)
Profit/loss from business: +$6,018 (reported on 18.7% of returns)
Here:
+$6,018
State:
+$7,823
(% of AGI for various income ranges: 18.2% for AGIs below $10k, 8.7% for AGIs $10k-25k, 3.0% for AGIs $25k-50k, 2.3% for AGIs $50k-75k, 0.5% for AGIs $75k-100k)
IRA payment deduction: $2,840 (reported on 2.1% of returns)
72417:
$2,840
Arkansas:
$3,204
Total itemized deductions: $15,752 (25% of AGI, reported on 17.3% of returns)
Here:
$15,752
State:
$18,389
Here:
24.8% of AGI
State:
21.0% of AGI
(% of AGI for various income ranges: 5.5% for AGIs $10k-25k, 5.5% for AGIs $25k-50k, 8.6% for AGIs $50k-75k, 13.0% for AGIs $75k-100k, 17.2% for AGIs over 100k)
Charity contributions deductions: $3,138 (5% of AGI, reported on 14.6% of returns)
Here:
$3,138
State:
$4,725
Here:
5.0% of AGI
State:
5.1% of AGI
(% of AGI for various income ranges: 0.9% for AGIs $10k-25k, 0.9% for AGIs $25k-50k, 1.6% for AGIs $50k-75k, 2.1% for AGIs $75k-100k, 2.7% for AGIs over 100k)
Total tax: $3,492 (reported on 70.1% of returns)
72417:
$3,492
State:
$6,047
(% of AGI for various income ranges: 3.8% for AGIs below $10k, 3.9% for AGIs $10k-25k, 5.6% for AGIs $25k-50k, 7.5% for AGIs $50k-75k, 9.5% for AGIs $75k-100k, 16.6% for AGIs over 100k)
Earned income credit: $1,905 (reported on 24.9% of returns)
Here:
$1,905
State:
$1,909
Percentage of individuals using paid preparers for their 2004 taxes: 73.1%
Here:
73%
State:
67%
(% for various income ranges: 62.4% for AGIs below $10k, 77.1% for AGIs $10k-25k, 74.1% for AGIs $25k-50k, 73.8% for AGIs $50k-75k, 77.1% for AGIs $75k-100k, 82.8% for AGIs over 100k)
Likely homosexual households (counted as self-reported same-sex unmarried-partner households)
Lesbian couples: 0.2% of all households
Gay men: 0.0% of all households
Household received Food Stamps/SNAP in the past 12 months: 273 Household did not receive Food Stamps/SNAP in the past 12 months: 1,794
Women who had a birth in the past 12 months: 13 (14 now married, 0 unmarried) Women who did not have a birth in the past 12 months: 1,362 (796 now married, 568 unmarried)
Housing units in zip code 72417 with a mortgage: 838 (76 second mortgage, 73 both second mortgage and home equity loan) Median monthly owner costs for units with a mortgage: $1,152 Median monthly owner costs for units without a mortgage: $454
Residents with income below the poverty level in 2022:
This zip code:
9.2%
Whole state:
16.8%
Residents with income below 50% of the poverty level in 2022:
This zip code:
7.3%
Whole state:
8.5%
Median number of rooms in houses and condos:
Here:
5.8
State:
6.1
Median number of rooms in apartments:
Here:
4.2
State:
4.3
Notable locations in this zip code not listed on our city pages
Notable locations in zip code 72417: Brookland Volunteer Fire Department Goobertown Station (A), Brookland Volunteer Fire Department Station 2 (B), Brookland Police Department (C). Display/hide their locations on the map
Churches in zip code 72417 include: Wood Church (A), Brookland Church (B), Mount Olive Church (C), Pine Log Church (D), New Antioch Baptist Church (E), Sweet Moments Church (F). Display/hide their locations on the map
Size of family households: 688 2-persons, 319 3-persons, 336 4-persons, 80 5-persons, 48 6-persons, 5 7-or-more-persons
Size of nonfamily households: 435 1-person, 122 2-persons, 12 3-persons
1,083 married couples with children.
271 single-parent households (67 men, 204 women).
98.8% of residents of 72417 zip code speak English at home.
0.4% of residents speak Spanish at home (21% very well, 79% not well).
Foreign born population: 36 (0.7%) (100.0% of them are naturalized citizens)
This zip code:
0.7%
Whole state:
5.1%
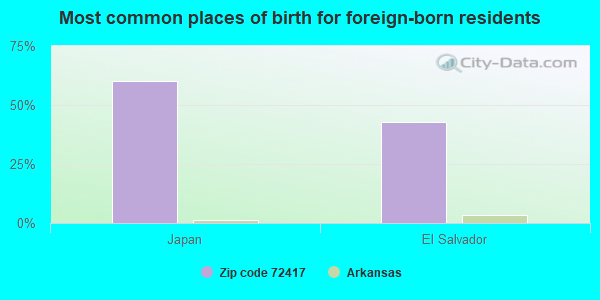
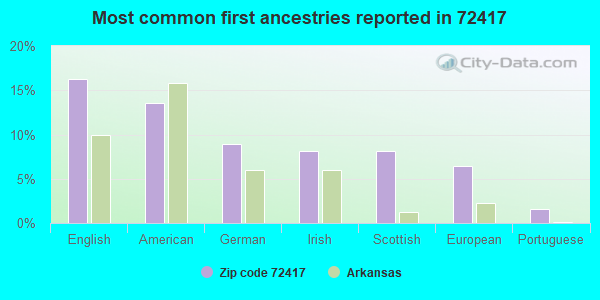
60%Japan
43%El Salvador
16%English
14%American
9%German
8%Irish
8%Scottish
6%European
2%Portuguese
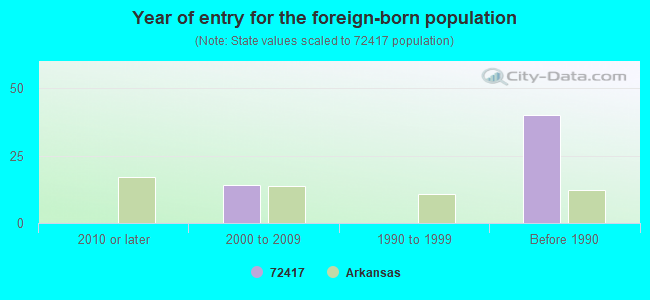
Year of entry for the foreign-born population
02010 or later
142000 to 2009
01990 to 1999
40Before 1990
Facilities with environmental interests located in this zip code:
BROOKLAND, CITY OF (301 A HAYES in BROOKLAND, AR)
(Integrated Compliance Information System) - ICIS-06-1988-0637, FORMAL ENFORCEMENT ACTION National Pollutant Discharge Elimination System NON-MAJOR (Tracking pollutant discharge elimination systems) - permit STATE MASTER (PDS) - WATER-AR0037974, National Pollutant Discharge Elimination System Permit, WATER-AR0037974C, Business SIC classification: SEWERAGE SYSTEMS Alternative names: BROOKLAND, CITY OF-WWTF, BROOKLAND WASTE WATER
BROOKLAND HIGH SCHOOL (100 W. SCHOOL ST. in BROOKLAND, AR)
(Geographic Names Information System) (National Center for Education Statistics) - STATE ID-1603007 Alternative names: BROOKLAND ELEMENTARY SCHOOL
BROOKLAND, CITY OF (309 NORTH BERNIS in BROOKLAND, AR)
National Pollutant Discharge Elimination System NON-MAJOR (Tracking pollutant discharge elimination systems) - permit Business SIC classification: SEWERAGE SYSTEMS
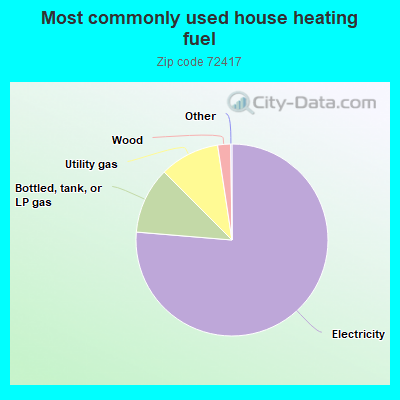
76.4%Electricity
11.2%Bottled, tank, or LP gas
10.1%Utility gas
2.2%Wood
Population in 1990: 1,896. Population change in the 1990s: +816 (+43.0%).
Place of birth for U.S.-born residents:
This state: 3,969
Midwest: 509
South: 637
West: 89
50% of the 72417 zip code residents lived in the same house 5 years ago. Out of people who lived in different houses, 66% lived in this county. Out of people who lived in different counties, 50% lived in Arkansas.
85% of the 72417 zip code residents lived in the same house 1 year ago. Out of people who lived in different houses, 48% moved from this county. Out of people who lived in different houses, 42% moved from different county within same state. Out of people who lived in different houses, 4% moved from abroad.
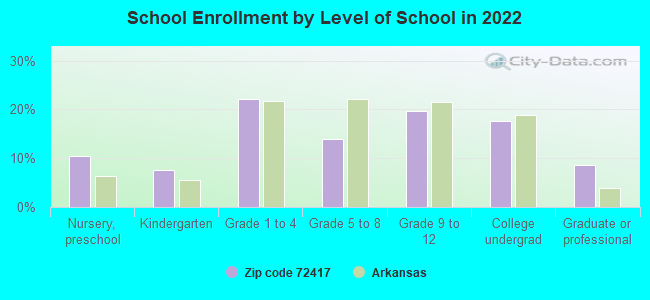
Private vs. public school enrollment:
Students in private schools in grades 1 to 8 (elementary and middle school): 7
Here:
1.5%
Arkansas:
10.5%
Students in private schools in grades 9 to 12 (high school):
Here:
0.0%
Arkansas:
8.7%
Students in private undergraduate colleges: 20
Here:
8.1%
Arkansas:
19.4%
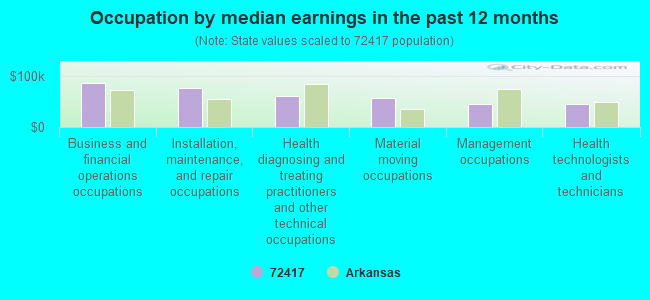
Occupation by median earnings in the past 12 months ($)
86,897Business and financial operations occupations
76,258Installation, maintenance, and repair occupations
61,484Health diagnosing and treating practitioners and other technical occupations
57,311Material moving occupations
46,187Management occupations
44,664Health technologists and technicians
Companies with federal contracts located in this zip code:
BROOKLAND SCHOOL DISTRICT (100 SCHOOL STREET in BROOKLAND, AR)
$2,650 with Army for Passenger Motor Charter Service. Signed on 2004-05-28. Completion date: 2004-06-04.
Top industries in this zip code by the number of employees in 2005:
Administrative and Support and Waste Management and Remediation Services: Exterminating and Pest Control Services (20-49 employees: 1 establishment)
Health Care and Social Assistance: Offices of Physicians (except Mental Health Specialists) (10-19: 1, 1-4: 1)
Health Care and Social Assistance: Child Day Care Services (10-19: 1, 1-4: 1)
Other Services (except Public Administration): Religious Organizations (5-9: 1, 1-4: 2)
Fatal accident statistics in 2014:
Fatal accident count: 1
Vehicles involved in fatal accidents: 2
Fatal accidents caused by drunken drivers: 0
Fatalities: 1
Persons involved in fatal accidents: 2
Pedestrians involved in fatal accidents: 0
Fatal accident statistics in 2013:
Fatal accident count: 1
Vehicles involved in fatal accidents: 2
Fatal accidents caused by drunken drivers: 1
Fatalities: 1
Persons involved in fatal accidents: 1
Pedestrians involved in fatal accidents: 0
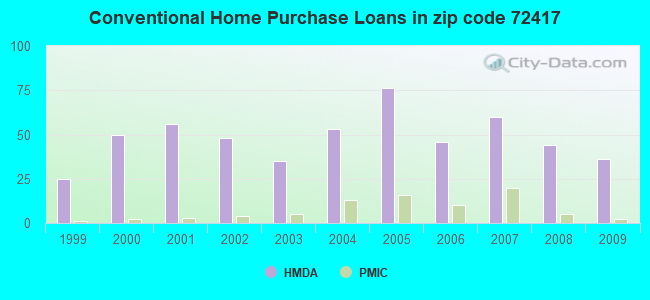
Home Mortgage Disclosure Act Aggregated Statistics For Year 2009 (Based on 2 partial tracts)
A) FHA, FSA/RHS & VA Home Purchase Loans
B) Conventional Home Purchase Loans
C) Refinancings
D) Home Improvement Loans
E) Loans on Dwellings For 5+ Families
F) Non-occupant Loans on < 5 Family Dwellings (A B C & D)
G) Loans On Manufactured Home Dwelling (A B C & D)
Number
Average Value
Number
Average Value
Number
Average Value
Number
Average Value
Number
Average Value
Number
Average Value
Number
Average Value
LOANS ORIGINATED
38
$101,002
36
$127,006
102
$127,649
10
$16,018
1
$37,690
19
$120,714
16
$40,732
APPLICATIONS APPROVED, NOT ACCEPTED
1
$25,130
2
$47,895
2
$132,700
0
$0
0
$0
0
$0
2
$27,090
APPLICATIONS DENIED
5
$88,100
9
$56,709
27
$118,478
4
$15,115
0
$0
3
$139,503
6
$33,633
APPLICATIONS WITHDRAWN
2
$134,660
7
$98,037
22
$168,390
2
$50,645
0
$0
2
$56,535
1
$53,390
FILES CLOSED FOR INCOMPLETENESS
0
$0
2
$126,415
2
$271,680
0
$0
0
$0
0
$0
1
$53,390
Aggregated Statistics For Year 2008 (Based on 2 partial tracts)
A) FHA, FSA/RHS & VA Home Purchase Loans
B) Conventional Home Purchase Loans
C) Refinancings
D) Home Improvement Loans
F) Non-occupant Loans on < 5 Family Dwellings (A B C & D)
G) Loans On Manufactured Home Dwelling (A B C & D)
Number
Average Value
Number
Average Value
Number
Average Value
Number
Average Value
Number
Average Value
Number
Average Value
LOANS ORIGINATED
31
$117,045
44
$89,923
80
$105,629
16
$18,059
31
$74,442
16
$36,414
APPLICATIONS APPROVED, NOT ACCEPTED
1
$91,080
5
$68,626
6
$67,658
2
$25,910
2
$42,400
2
$71,845
APPLICATIONS DENIED
3
$99,197
14
$70,724
33
$97,198
9
$12,127
4
$112,675
6
$38,475
APPLICATIONS WITHDRAWN
2
$103,255
7
$106,450
16
$126,270
0
$0
0
$0
0
$0
FILES CLOSED FOR INCOMPLETENESS
0
$0
0
$0
5
$136,782
1
$56,530
0
$0
0
$0
Aggregated Statistics For Year 2007 (Based on 2 partial tracts)
A) FHA, FSA/RHS & VA Home Purchase Loans
B) Conventional Home Purchase Loans
C) Refinancings
D) Home Improvement Loans
F) Non-occupant Loans on < 5 Family Dwellings (A B C & D)
G) Loans On Manufactured Home Dwelling (A B C & D)
Number
Average Value
Number
Average Value
Number
Average Value
Number
Average Value
Number
Average Value
Number
Average Value
LOANS ORIGINATED
14
$109,255
60
$82,184
71
$125,112
19
$41,864
23
$60,221
19
$36,822
APPLICATIONS APPROVED, NOT ACCEPTED
1
$64,390
5
$46,012
12
$82,119
3
$21,987
0
$0
2
$32,980
APPLICATIONS DENIED
2
$95,400
20
$78,402
34
$75,749
9
$22,422
4
$75,182
7
$44,981
APPLICATIONS WITHDRAWN
0
$0
4
$104,432
25
$83,891
4
$57,515
1
$35,330
1
$14,130
FILES CLOSED FOR INCOMPLETENESS
0
$0
3
$78,783
5
$93,910
2
$38,475
1
$31,410
0
$0
Aggregated Statistics For Year 2006 (Based on 2 partial tracts)
A) FHA, FSA/RHS & VA Home Purchase Loans
B) Conventional Home Purchase Loans
C) Refinancings
D) Home Improvement Loans
E) Loans on Dwellings For 5+ Families
F) Non-occupant Loans on < 5 Family Dwellings (A B C & D)
G) Loans On Manufactured Home Dwelling (A B C & D)
Number
Average Value
Number
Average Value
Number
Average Value
Number
Average Value
Number
Average Value
Number
Average Value
Number
Average Value
LOANS ORIGINATED
16
$89,120
46
$85,792
69
$84,483
13
$36,482
0
$0
19
$48,889
16
$21,446
APPLICATIONS APPROVED, NOT ACCEPTED
0
$0
7
$100,617
9
$149,101
2
$176,670
0
$0
1
$388,670
1
$20,420
APPLICATIONS DENIED
3
$99,720
21
$81,287
30
$112,257
13
$14,918
1
$106,790
2
$12,565
7
$42,177
APPLICATIONS WITHDRAWN
2
$73,415
6
$65,827
25
$138,384
2
$23,165
0
$0
1
$390,240
1
$12,560
FILES CLOSED FOR INCOMPLETENESS
0
$0
0
$0
5
$164,578
0
$0
0
$0
0
$0
1
$126,420
Aggregated Statistics For Year 2005 (Based on 2 partial tracts)
A) FHA, FSA/RHS & VA Home Purchase Loans
B) Conventional Home Purchase Loans
C) Refinancings
D) Home Improvement Loans
F) Non-occupant Loans on < 5 Family Dwellings (A B C & D)
G) Loans On Manufactured Home Dwelling (A B C & D)
Number
Average Value
Number
Average Value
Number
Average Value
Number
Average Value
Number
Average Value
Number
Average Value
LOANS ORIGINATED
13
$92,533
76
$80,090
88
$81,143
9
$34,723
31
$60,207
25
$35,899
APPLICATIONS APPROVED, NOT ACCEPTED
0
$0
4
$81,268
18
$71,584
0
$0
1
$42,400
2
$49,075
APPLICATIONS DENIED
2
$92,260
26
$65,111
49
$90,090
5
$31,250
3
$52,083
20
$43,264
APPLICATIONS WITHDRAWN
1
$74,590
18
$79,654
16
$156,500
1
$96,580
3
$190,280
2
$69,885
FILES CLOSED FOR INCOMPLETENESS
0
$0
1
$102,080
8
$132,601
0
$0
0
$0
0
$0
Aggregated Statistics For Year 2004 (Based on 2 partial tracts)
A) FHA, FSA/RHS & VA Home Purchase Loans
B) Conventional Home Purchase Loans
C) Refinancings
D) Home Improvement Loans
F) Non-occupant Loans on < 5 Family Dwellings (A B C & D)
G) Loans On Manufactured Home Dwelling (A B C & D)
Number
Average Value
Number
Average Value
Number
Average Value
Number
Average Value
Number
Average Value
Number
Average Value
LOANS ORIGINATED
20
$71,178
53
$66,298
111
$90,114
16
$27,041
26
$47,082
27
$29,750
APPLICATIONS APPROVED, NOT ACCEPTED
1
$30,620
13
$68,675
25
$81,975
1
$15,700
1
$47,110
8
$31,800
APPLICATIONS DENIED
5
$70,826
36
$47,221
46
$93,285
9
$47,112
6
$65,565
21
$37,839
APPLICATIONS WITHDRAWN
2
$63,210
2
$103,645
25
$91,020
2
$50,255
1
$59,680
1
$74,590
FILES CLOSED FOR INCOMPLETENESS
0
$0
1
$40,050
6
$125,763
1
$112,280
0
$0
2
$48,680
Aggregated Statistics For Year 2003 (Based on 2 partial tracts)
A) FHA, FSA/RHS & VA Home Purchase Loans
B) Conventional Home Purchase Loans
C) Refinancings
D) Home Improvement Loans
F) Non-occupant Loans on < 5 Family Dwellings (A B C & D)
Number
Average Value
Number
Average Value
Number
Average Value
Number
Average Value
Number
Average Value
LOANS ORIGINATED
15
$78,101
35
$78,879
163
$90,654
15
$21,933
24
$40,798
APPLICATIONS APPROVED, NOT ACCEPTED
0
$0
5
$71,768
13
$123,276
1
$25,130
2
$40,830
APPLICATIONS DENIED
5
$70,196
29
$76,219
65
$74,509
7
$28,267
8
$37,591
APPLICATIONS WITHDRAWN
2
$41,615
5
$159,552
25
$85,964
1
$98,940
2
$36,120
FILES CLOSED FOR INCOMPLETENESS
0
$0
1
$82,450
7
$91,869
0
$0
1
$27,480
Aggregated Statistics For Year 2002 (Based on 2 partial tracts)
A) FHA, FSA/RHS & VA Home Purchase Loans
B) Conventional Home Purchase Loans
C) Refinancings
D) Home Improvement Loans
F) Non-occupant Loans on < 5 Family Dwellings (A B C & D)
Number
Average Value
Number
Average Value
Number
Average Value
Number
Average Value
Number
Average Value
LOANS ORIGINATED
21
$85,063
48
$84,507
111
$90,744
16
$27,041
21
$52,758
APPLICATIONS APPROVED, NOT ACCEPTED
1
$61,250
6
$45,410
16
$66,448
2
$54,965
2
$32,195
APPLICATIONS DENIED
3
$78,520
34
$48,221
47
$74,327
5
$16,960
5
$36,120
APPLICATIONS WITHDRAWN
2
$45,150
3
$107,050
11
$66,814
0
$0
1
$39,260
FILES CLOSED FOR INCOMPLETENESS
0
$0
0
$0
3
$78,257
0
$0
1
$38,470
Aggregated Statistics For Year 2001 (Based on 2 partial tracts)
A) FHA, FSA/RHS & VA Home Purchase Loans
B) Conventional Home Purchase Loans
C) Refinancings
D) Home Improvement Loans
F) Non-occupant Loans on < 5 Family Dwellings (A B C & D)
Number
Average Value
Number
Average Value
Number
Average Value
Number
Average Value
Number
Average Value
LOANS ORIGINATED
11
$67,741
56
$59,745
133
$76,955
18
$24,167
16
$47,652
APPLICATIONS APPROVED, NOT ACCEPTED
0
$0
9
$54,179
6
$90,690
0
$0
2
$64,385
APPLICATIONS DENIED
2
$34,155
24
$40,634
38
$70,565
8
$9,520
2
$42,795
APPLICATIONS WITHDRAWN
1
$47,900
2
$159,005
25
$93,847
0
$0
1
$34,550
FILES CLOSED FOR INCOMPLETENESS
0
$0
0
$0
4
$82,642
1
$7,850
0
$0
Aggregated Statistics For Year 2000 (Based on 2 partial tracts)
A) FHA, FSA/RHS & VA Home Purchase Loans
B) Conventional Home Purchase Loans
C) Refinancings
D) Home Improvement Loans
F) Non-occupant Loans on < 5 Family Dwellings (A B C & D)
Number
Average Value
Number
Average Value
Number
Average Value
Number
Average Value
Number
Average Value
LOANS ORIGINATED
14
$75,884
50
$61,089
50
$65,517
22
$15,847
10
$34,156
APPLICATIONS APPROVED, NOT ACCEPTED
1
$33,760
11
$39,188
9
$54,964
2
$10,210
1
$25,130
APPLICATIONS DENIED
2
$102,075
33
$41,045
48
$53,819
7
$27,930
2
$70,670
APPLICATIONS WITHDRAWN
2
$76,165
6
$49,860
20
$48,368
2
$8,635
1
$26,700
FILES CLOSED FOR INCOMPLETENESS
0
$0
2
$54,965
4
$42,205
0
$0
0
$0
Aggregated Statistics For Year 1999 (Based on 1 partial tract)
A) FHA, FSA/RHS & VA Home Purchase Loans
B) Conventional Home Purchase Loans
C) Refinancings
D) Home Improvement Loans
F) Non-occupant Loans on < 5 Family Dwellings (A B C & D)
Detailed PMIC statistics for the following Tracts:0011.00
2002 - 2018 National Fire Incident Reporting System (NFIRS) incidents
According to the data from the years 2002 - 2018 the average number of fire incidents per year is 18. The highest number of reported fire incidents - 48 took place in 2008, and the least - 2 in 2007. The data has a growing trend.
When looking into fire subcategories, the most incidents belonged to: Outside Fires (50.5%), and Structure Fires (37.6%).
Fire incident types reported to NFIRS in Zip Code 72417


 Nearest zip codes: 72437, 72401, 72467, 72450, 72411, 72414.


 According to the data from the years 2002 - 2018 the average number of fire incidents per year is 18. The highest number of reported fire incidents - 48 took place in 2008, and the least - 2 in 2007. The data has a growing trend.
 When looking into fire subcategories, the most incidents belonged to: Outside Fires (50.5%), and Structure Fires (37.6%).