Estimated zip code population in 2022: 14,862 Zip code population in 2010: 14,411 Zip code population in 2000: 13,561
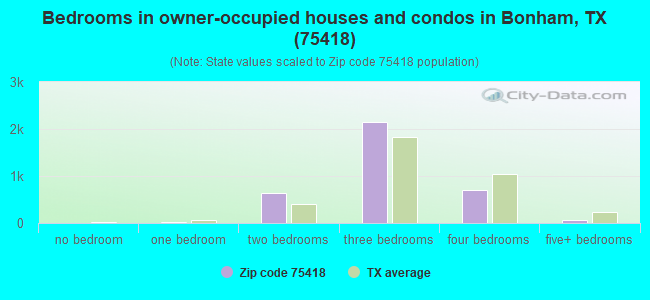
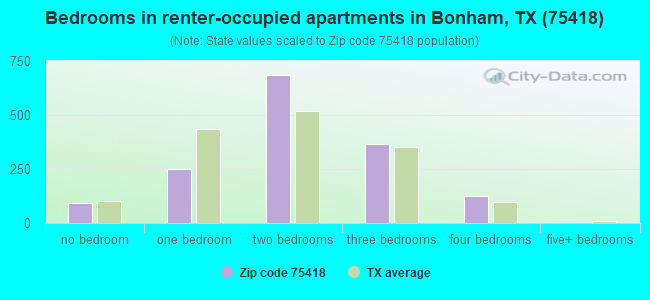
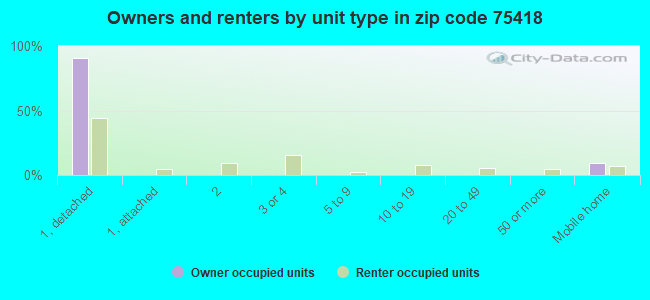
Houses and condos: 5,786 Renter-occupied apartments: 1,524
% of renters here:
30%
State:
38%
March 2022 cost of living index in zip code 75418: 80.4 (low, U.S. average is 100)
Land area: 139.8 sq. mi. Water area: 2.0 sq. mi.
Population density: 106 people per square mile
(very low).
OSM Map
General Map
Google Map
MSN Map
OSM Map
General Map
Google Map
MSN Map
OSM Map
General Map
Google Map
MSN Map
OSM Map
General Map
Google Map
MSN Map
Please wait while loading the map...
Real estate property taxes paid for housing units in 2022:
This zip code:
1.0% ($2,059)
Texas:
1.5% ($4,050)
Median real estate property taxes paid for housing units with mortgages in 2022: $2,484 (1.0%) Median real estate property taxes paid for housing units with no mortgage in 2022: $1,900 (1.0%)
Averages for the 2020 tax year for zip code 75418, filed in 2021:
Average Adjusted Gross Income (AGI) in 2020: $56,826 (Individual Income Tax Returns)
Here:
$56,826
State:
$77,054
Salary/wage: $49,809 (reported on 81.2% of returns)
Here:
$49,809
State:
$62,766
(% of AGI for various income ranges: 1201.4% for AGIs below $25k, 3581.4% for AGIs $25k-50k, 6207.5% for AGIs $50k-75k, 8974.1% for AGIs $75k-100k, 16006.4% for AGIs $100k-200k, 81660.0% for AGIs over 200k)
Taxable interest for individuals: $1,729 (reported on 24.6% of returns)
This zip code:
$1,729
Texas:
$2,665
(% of AGI for various income ranges: 17.3% for AGIs below $25k, 21.7% for AGIs $25k-50k, 42.6% for AGIs $50k-75k, 69.1% for AGIs $75k-100k, 165.2% for AGIs $100k-200k, 1745.0% for AGIs over 200k)
Ordinary dividends: $5,147 (reported on 10.9% of returns)
Here:
$5,147
State:
$10,044
(% of AGI for various income ranges: 11.2% for AGIs below $25k, 21.5% for AGIs $25k-50k, 66.3% for AGIs $50k-75k, 96.6% for AGIs $75k-100k, 233.0% for AGIs $100k-200k, 2640.0% for AGIs over 200k)
Net capital gain/loss in AGI: +$18,183 (reported on 11.5% of returns)
Here:
+$18,183
State:
+$39,590
(% of AGI for various income ranges: 11.5% for AGIs below $25k, 32.2% for AGIs $25k-50k, 93.3% for AGIs $50k-75k, 262.5% for AGIs $75k-100k, 905.8% for AGIs $100k-200k, 14975.0% for AGIs over 200k)
Profit/loss from business: +$8,616 (reported on 17.7% of returns)
Here:
+$8,616
State:
+$10,888
(% of AGI for various income ranges: 96.5% for AGIs below $25k, 118.6% for AGIs $25k-50k, 148.6% for AGIs $50k-75k, 265.0% for AGIs $75k-100k, 541.5% for AGIs $100k-200k, 4125.0% for AGIs over 200k)
Taxable individual retirement arrangement distribution: $17,035 (reported on 7.7% of returns)
75418:
$17,035
Texas:
$24,740
(% of AGI for various income ranges: 45.3% for AGIs below $25k, 66.6% for AGIs $25k-50k, 214.4% for AGIs $50k-75k, 358.1% for AGIs $75k-100k, 908.5% for AGIs $100k-200k)
Total itemized deductions: $43,095 (reported on 4.2% of returns)
Here:
$43,095
State:
$40,428
(% of AGI for various income ranges: 57.0% for AGIs $25k-50k, 171.8% for AGIs $50k-75k, 359.1% for AGIs $75k-100k, 945.2% for AGIs $100k-200k, 8805.0% for AGIs over 200k)
Charity contributions: $19,765 (reported on 3.3% of returns)
Here:
$19,765
State:
$18,201
(% of AGI for various income ranges: 49.6% for AGIs $50k-75k, 43.4% for AGIs $75k-100k, 230.0% for AGIs $100k-200k, 5447.5% for AGIs over 200k)
Taxes paid: $5,986 (reported on 4.0% of returns)
75418:
$5,986
State:
$7,821
(% of AGI for various income ranges: 7.0% for AGIs $25k-50k, 22.1% for AGIs $50k-75k, 39.1% for AGIs $75k-100k, 156.7% for AGIs $100k-200k, 1002.5% for AGIs over 200k)
Earned income credit: $2,204 (reported on 20.2% of returns)
Here:
$2,204
State:
$2,584
(% of AGI for various income ranges: 102.2% for AGIs below $25k, 72.7% for AGIs $25k-50k, 2.6% for AGIs $50k-75k)
Percentage of individuals using paid preparers for their 2020 taxes: 91.6%
Here:
92%
State:
92%
(% for various income ranges: 90.5% for AGIs below $25k, 92.2% for AGIs $25k-50k, 92.1% for AGIs $50k-75k, 93.3% for AGIs $75k-100k, 90.9% for AGIs $100k-200k, 91.7% for AGIs over 200k)
Averages for the 2012 tax year for zip code 75418, filed in 2013:
Average Adjusted Gross Income (AGI) in 2012: $42,275 (Individual Income Tax Returns)
Here:
$42,275
State:
$65,384
Salary/wage: $37,010 (reported on 82.2% of returns)
Here:
$37,010
State:
$52,524
(% of AGI for various income ranges: 77.2% for AGIs below $25k, 79.4% for AGIs $25k-50k, 76.5% for AGIs $50k-75k, 74.8% for AGIs $75k-100k, 68.4% for AGIs $100k-200k, 41.9% for AGIs over 200k)
Taxable interest for individuals: $1,761 (reported on 25.1% of returns)
This zip code:
$1,761
Texas:
$2,372
(% of AGI for various income ranges: 1.5% for AGIs below $25k, 0.9% for AGIs $25k-50k, 0.9% for AGIs $50k-75k, 0.9% for AGIs $75k-100k, 0.6% for AGIs $100k-200k, 2.1% for AGIs over 200k)
Ordinary dividends: $4,302 (reported on 11.7% of returns)
Here:
$4,302
State:
$9,721
(% of AGI for various income ranges: 0.9% for AGIs below $25k, 0.6% for AGIs $25k-50k, 0.7% for AGIs $50k-75k, 1.0% for AGIs $75k-100k, 1.1% for AGIs $100k-200k, 4.4% for AGIs over 200k)
Net capital gain/loss in AGI: +$9,023 (reported on 11.1% of returns)
Here:
+$9,023
State:
+$35,319
(% of AGI for various income ranges: 0.3% for AGIs $25k-50k, 0.5% for AGIs $50k-75k, 0.8% for AGIs $75k-100k, 1.5% for AGIs $100k-200k, 18.1% for AGIs over 200k)
Profit/loss from business: +$10,589 (reported on 16.9% of returns)
Here:
+$10,589
State:
+$13,732
(% of AGI for various income ranges: 7.8% for AGIs below $25k, 2.9% for AGIs $25k-50k, 1.0% for AGIs $50k-75k, 2.9% for AGIs $75k-100k, 6.6% for AGIs $100k-200k, 6.4% for AGIs over 200k)
Taxable individual retirement arrangement distribution: $13,193 (reported on 9.6% of returns)
75418:
$13,193
Texas:
$19,511
(% of AGI for various income ranges: 2.8% for AGIs below $25k, 2.4% for AGIs $25k-50k, 2.4% for AGIs $50k-75k, 2.9% for AGIs $75k-100k, 6.2% for AGIs $100k-200k)
Total itemized deductions: $21,495 (23% of AGI, reported on 15.9% of returns)
Here:
$21,495
State:
$24,724
Here:
23.0% of AGI
State:
15.9% of AGI
(% of AGI for various income ranges: 3.9% for AGIs below $25k, 5.2% for AGIs $25k-50k, 8.6% for AGIs $50k-75k, 9.5% for AGIs $75k-100k, 10.0% for AGIs $100k-200k, 13.5% for AGIs over 200k)
Charity contributions: $5,702 (reported on 11.9% of returns)
Here:
$5,702
State:
$6,808
(% of AGI for various income ranges: 0.4% for AGIs below $25k, 0.9% for AGIs $25k-50k, 1.5% for AGIs $50k-75k, 2.0% for AGIs $75k-100k, 2.6% for AGIs $100k-200k, 2.6% for AGIs over 200k)
Taxes paid: $4,221 (reported on 15.7% of returns)
75418:
$4,221
State:
$6,921
(% of AGI for various income ranges: 0.6% for AGIs below $25k, 0.9% for AGIs $25k-50k, 1.5% for AGIs $50k-75k, 2.2% for AGIs $75k-100k, 2.4% for AGIs $100k-200k, 2.1% for AGIs over 200k)
Earned income credit: $2,287 (reported on 23.6% of returns)
Here:
$2,287
State:
$2,570
(% of AGI for various income ranges: 7.3% for AGIs below $25k, 1.3% for AGIs $25k-50k)
Percentage of individuals using paid preparers for their 2012 taxes: 54.8%
Here:
55%
State:
51%
(% for various income ranges: 50.0% for AGIs below $25k, 54.5% for AGIs $25k-50k, 60.3% for AGIs $50k-75k, 62.9% for AGIs $75k-100k, 63.3% for AGIs $100k-200k, 83.3% for AGIs over 200k)
Averages for the 2004 tax year for zip code 75418, filed in 2005:
Average Adjusted Gross Income (AGI) in 2004: $34,588 (Individual Income Tax Returns)
Here:
$34,588
State:
$47,881
Salary/wage: $32,141 (reported on 80.6% of returns)
Here:
$32,141
State:
$41,947
(% of AGI for various income ranges: 171.8% for AGIs below $10k, 74.5% for AGIs $10k-25k, 80.5% for AGIs $25k-50k, 82.1% for AGIs $50k-75k, 75.5% for AGIs $75k-100k, 54.2% for AGIs over 100k)
Taxable interest for individuals: $2,319 (reported on 34.2% of returns)
This zip code:
$2,319
Texas:
$2,255
(% of AGI for various income ranges: 11.9% for AGIs below $10k, 2.5% for AGIs $10k-25k, 2.0% for AGIs $25k-50k, 1.3% for AGIs $50k-75k, 2.3% for AGIs $75k-100k, 2.8% for AGIs over 100k)
Taxable dividends: $3,221 (reported on 14.4% of returns)
Here:
$3,221
State:
$4,261
(% of AGI for various income ranges: 5.5% for AGIs below $10k, 1.0% for AGIs $10k-25k, 0.6% for AGIs $25k-50k, 0.4% for AGIs $50k-75k, 0.7% for AGIs $75k-100k, 3.4% for AGIs over 100k)
Net capital gain/loss: +$12,281 (reported on 14.5% of returns)
Here:
+$12,281
State:
+$16,110
(% of AGI for various income ranges: 3.2% for AGIs below $10k, 0.2% for AGIs $10k-25k, 1.7% for AGIs $25k-50k, 2.0% for AGIs $50k-75k, 3.3% for AGIs $75k-100k, 16.9% for AGIs over 100k)
Profit/loss from business: +$6,965 (reported on 19.5% of returns)
Here:
+$6,965
State:
+$11,013
(% of AGI for various income ranges: 14.0% for AGIs below $10k, 5.1% for AGIs $10k-25k, 2.9% for AGIs $25k-50k, 1.5% for AGIs $50k-75k, 4.3% for AGIs $75k-100k, 5.9% for AGIs over 100k)
IRA payment deduction: $3,165 (reported on 2.3% of returns)
75418:
$3,165
Texas:
$3,120
(% of AGI for various income ranges: 0.1% for AGIs $10k-25k, 0.2% for AGIs $25k-50k, 0.2% for AGIs $50k-75k, 0.2% for AGIs $75k-100k, 0.2% for AGIs over 100k)
Self-employed pension: $8,867 (reported on 0.3% of returns)
Here:
$8,867
Texas:
$16,401
Total itemized deductions: $17,692 (26% of AGI, reported on 17.2% of returns)
Here:
$17,692
State:
$19,631
Here:
25.7% of AGI
State:
18.9% of AGI
(% of AGI for various income ranges: 16.9% for AGIs below $10k, 6.3% for AGIs $10k-25k, 7.6% for AGIs $25k-50k, 8.2% for AGIs $50k-75k, 10.4% for AGIs $75k-100k, 11.0% for AGIs over 100k)
Charity contributions deductions: $4,641 (6% of AGI, reported on 14.0% of returns)
Here:
$4,641
State:
$4,753
Here:
6.4% of AGI
State:
4.2% of AGI
(% of AGI for various income ranges: 1.5% for AGIs below $10k, 0.7% for AGIs $10k-25k, 1.0% for AGIs $25k-50k, 1.4% for AGIs $50k-75k, 2.7% for AGIs $75k-100k, 3.7% for AGIs over 100k)
Total tax: $4,544 (reported on 70.4% of returns)
75418:
$4,544
State:
$9,058
(% of AGI for various income ranges: 7.3% for AGIs below $10k, 3.6% for AGIs $10k-25k, 6.3% for AGIs $25k-50k, 8.4% for AGIs $50k-75k, 10.8% for AGIs $75k-100k, 16.6% for AGIs over 100k)
Earned income credit: $1,828 (reported on 22.8% of returns)
Here:
$1,828
State:
$2,024
Percentage of individuals using paid preparers for their 2004 taxes: 63.9%
Here:
64%
State:
57%
(% for various income ranges: 57.5% for AGIs below $10k, 68.4% for AGIs $10k-25k, 64.2% for AGIs $25k-50k, 60.6% for AGIs $50k-75k, 60.6% for AGIs $75k-100k, 77.0% for AGIs over 100k)
Household received Food Stamps/SNAP in the past 12 months: 792 Household did not receive Food Stamps/SNAP in the past 12 months: 4,359
Women who had a birth in the past 12 months: 126 (70 now married, 54 unmarried) Women who did not have a birth in the past 12 months: 2,346 (1,052 now married, 1,293 unmarried)
Housing units in zip code 75418 with a mortgage: 1,646 (26 second mortgage, 12 home equity loan) Median monthly owner costs for units with a mortgage: $1,557 Median monthly owner costs for units without a mortgage: $583
Residents with income below the poverty level in 2022:
This zip code:
14.6%
Whole state:
14.0%
Residents with income below 50% of the poverty level in 2022:
This zip code:
8.5%
Whole state:
7.4%
Median number of rooms in houses and condos:
Here:
5.9
State:
6.3
Median number of rooms in apartments:
Here:
4.3
State:
4.0
Notable locations in this zip code not listed on our city pages
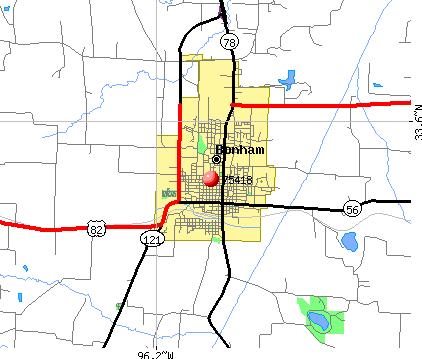
Notable locations in zip code 75418: Texas and Pacific Railroad Depot (A), Sam Rayburn Memorial Veterans Center (B), Lake Bonham Recreation Area (C), Arledge Ridge (D), Sam Rayburn Library (E), Sam Rayburn House (F), Fannin County Museum of History (G), Bonham Fire Department and Emergency Medical Service Station 2 (H), Bonham Fire Department and Emergency Medical Service Station 1 (I), Clendenen-Carleton House (J), Nunn House (K), Samuel T Rayburn House (L). Display/hide their locations on the map
Churches in zip code 75418 include: First Presbyterian Church (A), New Life Pencostal Holiness Church (B), First Penecostal Church of God (C), Zion Lutheran Church (D), Holy Trinity Episcopal Church (E), Newlife Church of God in Christ (F), Saint Elizabeth Catholic Church (G), Trinity Baptist Church (H), New Home Baptist Church (I). Display/hide their locations on the map
Cemeteries: Allen Cemetery (1), County Home Cemetery (2), Owens Cemetery (3), Dulaney Cemetery (4), Boze Cemetery (5), Willow Wild Cemetery (6), Hampton Cemetery (7). Display/hide their locations on the map
Lakes and reservoirs: Boyd Lake (A), Lake Bonham (B), Purdue Lake (C), City Lake (D), Soil Conservation Service Site 12 Reservoir (E), Soil Conservation Service Site 11 Reservoir (F), Soil Conservation Service Site 10 Reservoir (G), Bonham State Park Lake (H). Display/hide their locations on the map
Streams, rivers, and creeks: Wolf Creek (A), West Oakland Branch (B), Timber Creek (C), Stillhouse Branch (D), Sandy Branch (E), Sand Creek (F), East Oakland Branch (G), Powder Creek (H), Polecat Creek (I). Display/hide their locations on the map
Parks in zip code 75418 include: Lake Bonham Park (1), Bonham State Park (2), City of Bonham Softball Complex (3), Warrior Stadium (4), Bonham State Park (5). Display/hide their locations on the map
In group quarters: 2,928 (-1 institutionalized population)
Size of family households: 1,432 2-persons, 562 3-persons, 845 4-persons, 191 5-persons, 147 6-persons, 59 7-or-more-persons
Size of nonfamily households: 1,807 1-person, 91 2-persons, 11 7-or-more-persons
1,592 married couples with children.
490 single-parent households (166 men, 324 women).
85.6% of residents of 75418 zip code speak English at home.
13.4% of residents speak Spanish at home (56% very well, 26% well, 11% not well, 7% not at all).
0.7% of residents speak other Indo-European language at home (50% very well, 29% well, 21% not well).
0.2% of residents speak Asian or Pacific Island language at home (100% not well).
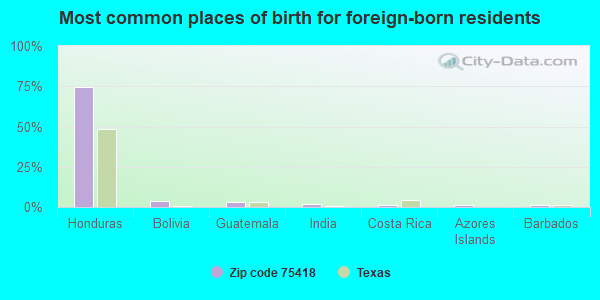
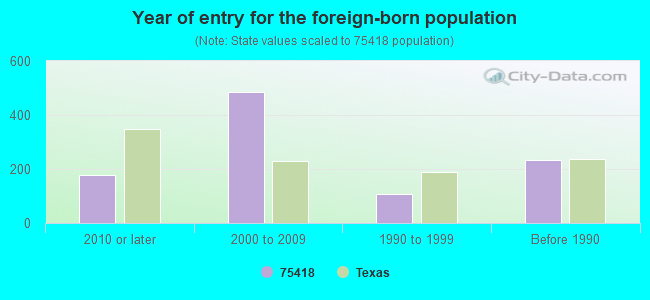
Foreign born population: 970 (6.5%) (28.3% of them are naturalized citizens)
This zip code:
6.5%
Whole state:
17.2%
75%Honduras
4%Bolivia
3%Guatemala
2%India
1%Costa Rica
1%Azores Islands
1%Barbados
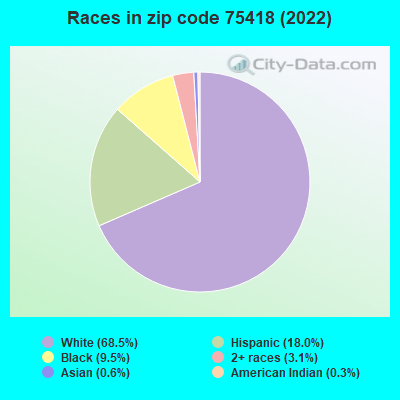
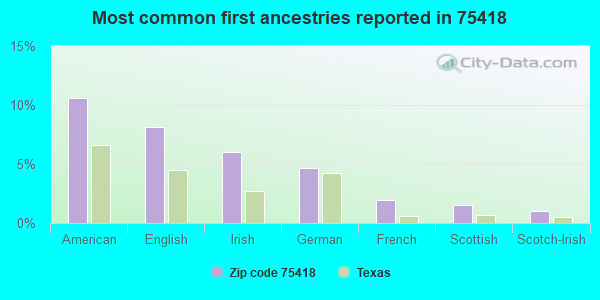
11%American
8%English
6%Irish
5%German
2%French
2%Scottish
1%Scotch-Irish
Year of entry for the foreign-born population
1772010 or later
4862000 to 2009
1071990 to 1999
234Before 1990
Facilities with environmental interests located in this zip code:
A-1 AUTO PARTS, INC. (HWY 121, RT. 1, BOX 77A in BONHAM, TX)
(Integrated Compliance Information System) - ICIS-06-2000-0140, FORMAL ENFORCEMENT ACTION National Pollutant Discharge Elimination System NON-MAJOR (Tracking pollutant discharge elimination systems) - permit Business SIC classification: MOTOR VEHICLE PARTS, USED
BAILEY INGLISH EL (1717 N CTR in BONHAM, TX)
(National Center for Education Statistics) - STATE ID-074903101 Organizations: BONHAM ISD (SCHOOL DISTRICT)
ASHLOCK MFG CO (HIGHWAY 82 W & HIGHWAY 121 in BONHAM, TX)
(Resource Conservation and Recovery Act (tracking hazardous waste)) Alternative names: HAROL ASHLOCK MTR CO
Housing units lacking complete plumbing facilities: 0.9% Housing units lacking complete kitchen facilities: 5.5%
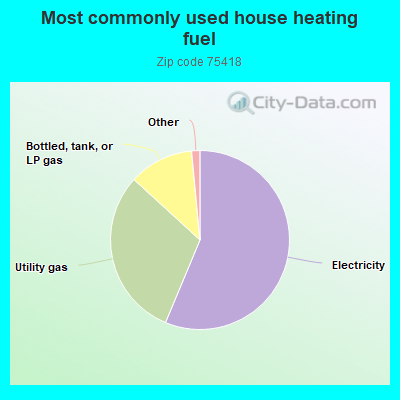
56.3%Electricity
30.5%Utility gas
11.7%Bottled, tank, or LP gas
0.8%Wood
0.5%Other fuel
Population in 1990: 9,003. Population change in the 1990s: +4,558 (+50.6%).
Place of birth for U.S.-born residents:
This state: 9,833
Northeast: 452
Midwest: 752
South: 1,498
West: 1,266
42% of the 75418 zip code residents lived in the same house 5 years ago. Out of people who lived in different houses, 33% lived in this county. Out of people who lived in different counties, 50% lived in Texas.
77% of the 75418 zip code residents lived in the same house 1 year ago. Out of people who lived in different houses, 24% moved from this county. Out of people who lived in different houses, 64% moved from different county within same state. Out of people who lived in different houses, 12% moved from different state. Out of people who lived in different houses, 1% moved from abroad.
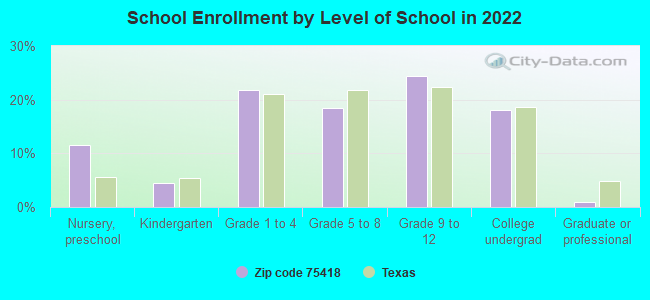
Private vs. public school enrollment:
Students in private schools in grades 1 to 8 (elementary and middle school): 69
Here:
6.3%
Texas:
8.8%
Students in private schools in grades 9 to 12 (high school): 79
Here:
11.8%
Texas:
8.0%
Students in private undergraduate colleges: 134
Here:
26.9%
Texas:
16.2%
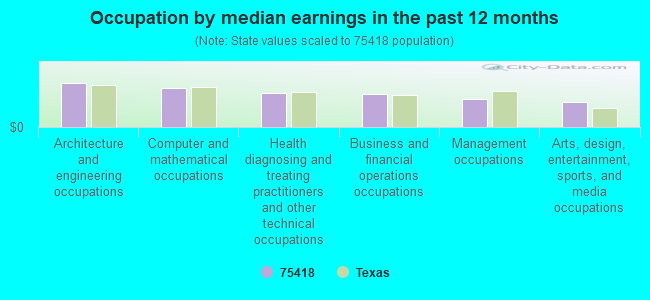
Occupation by median earnings in the past 12 months ($)
110,977Architecture and engineering occupations
98,507Computer and mathematical occupations
86,907Health diagnosing and treating practitioners and other technical occupations
84,186Business and financial operations occupations
69,904Management occupations
62,260Arts, design, entertainment, sports, and media occupations
Companies with federal contracts located in this zip code:
BONHAM CPDJE INC. (1522 WEST SAM RAYBURN DR. in BONHAM, TX)
$35,413 with Air Force for Passenger Motor Vehicles. Taking place in NM. Signed on 2000-05-04. Completion date: 2000-02-07.
CURRY, EDITH M (805 EAST 11TH STREET in BONHAM, TX; small business)
$6,950 with Army for Operation of Government-Owned Facilities -- Recreation Facilities (Non-Building). Signed on 2006-03-20. Completion date: 2006-02-07.
Top industries in this zip code by the number of employees in 2005:
Health Care and Social Assistance: General Medical and Surgical Hospitals (250-499 employees: 1 establishment, 100-249 employees: 1 establishment)
Health Care and Social Assistance: Nursing Care Facilities (50-99: 2, 20-49: 1)
Health Care and Social Assistance: Continuing Care Retirement Communities (100-249: 1)
People in group quarters in 2010:
2,030 people in state prisons
362 people in nursing facilities/skilled-nursing facilities
346 people in local jails and other municipal confinement facilities
179 people in residential treatment centers for adults
14 people in group homes intended for adults
People in group quarters in 2000:
2,627 people in state prisons
290 people in nursing homes
198 people in hospitals or wards for drug/alcohol abuse
22 people in local jails and other confinement facilities (including police lockups)
11 people in other group homes
Fatal accident statistics in 2014:
Fatal accident count: 3
Vehicles involved in fatal accidents: 6
Fatal accidents caused by drunken drivers: 0
Fatalities: 3
Persons involved in fatal accidents: 7
Pedestrians involved in fatal accidents: 0
Fatal accident statistics in 2013:
Fatal accident count: 3
Vehicles involved in fatal accidents: 6
Fatal accidents caused by drunken drivers: 1
Fatalities: 3
Persons involved in fatal accidents: 6
Pedestrians involved in fatal accidents: 0
2002 - 2018 National Fire Incident Reporting System (NFIRS) incidents
Based on the data from the years 2002 - 2018 the average number of fires per year is 88. The highest number of fire incidents - 117 took place in 2008, and the least - 64 in 2016. The data has a decreasing trend.
When looking into fire subcategories, the most incidents belonged to: Outside Fires (53.9%), and Structure Fires (29.0%).
Fire incident types reported to NFIRS in Zip Code 75418

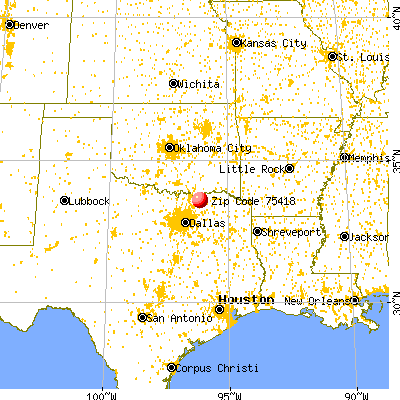


 Nearest zip codes: 75439, 75438, 75475, 75413, 75476, 75479.


 Based on the data from the years 2002 - 2018 the average number of fires per year is 88. The highest number of fire incidents - 117 took place in 2008, and the least - 64 in 2016. The data has a decreasing trend.
 When looking into fire subcategories, the most incidents belonged to: Outside Fires (53.9%), and Structure Fires (29.0%).