Estimated zip code population in 2022: 13,248
Zip code population in 2010: 11,444
Zip code population in 2000: 19,551
Houses and condos: 5,547
Renter-occupied apartments: 1,234
% of renters here:
26%State:
38%
March 2022 cost of living index in zip code 75644: 79.8
(low, U.S. average is 100)
Land area: 187.4
sq. mi.
Water area: 1.7
sq. mi.
Population density: 71 people per square mile (very low).
OSM Map
General Map
Google Map
MSN Map
OSM Map
General Map
Google Map
MSN Map
OSM Map
General Map
Google Map
MSN Map
OSM Map
General Map
Google Map
MSN Map
Please wait while loading the map...
Real estate property taxes paid for housing units in 2022:
This zip code:
0.9% ($1,743)Texas:
1.5% ($4,050)
Median real estate property taxes paid for housing units with mortgages in 2022: $2,375 (1.2%)
Median real estate property taxes paid for housing units with no mortgage in 2022: $1,432 (0.8%)
Profiles of local businesses
Business Search - 14 Million verified businesses
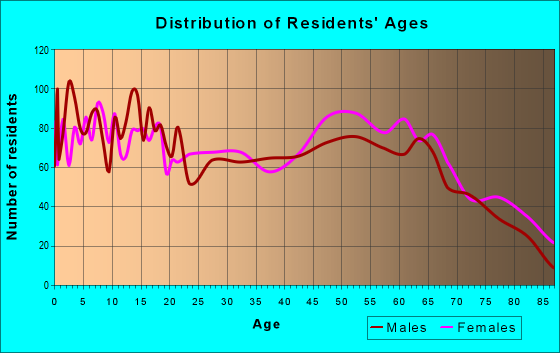
Males: 6,357 Females: 6,890
For population 25 years and over in 75644:
High school or higher: 86.0%Bachelor's degree or higher: 18.2%Graduate or professional degree: 4.6%Unemployed: 5.5%Mean travel time to work (commute): 33.8 minutes
For population 15 years and over in 75644:
Never married: 33.8%Now married: 45.3%Separated: 1.0%Widowed: 8.3%Divorced: 11.7%
Zip code 75644 compared to state average:
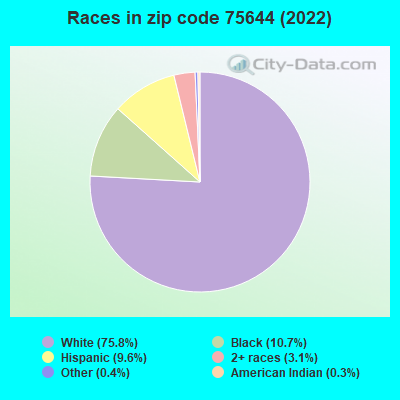
Hispanic race population percentage significantly below state average. Median age above state average. Foreign-born population percentage significantly below state average. Length of stay since moving in significantly above state average. Percentage of population with a bachelor's degree or higher below state average. 10,037 75.8% White 1,412 10.7% Black 1,273 9.6% Hispanic or Latino 412 3.1% Two or more races 55 0.4% Some other race 45 0.3% American Indian 11 0.08% Asian
Data:
Median household income ($)
Median household income (% change since 2000)
Household income diversity
Ratio of average income to average house value (%)
Ratio of average income to average rent
Median household income ($) - White
Median household income ($) - Black or African American
Median household income ($) - Asian
Median household income ($) - Hispanic or Latino
Median household income ($) - American Indian and Alaska Native
Median household income ($) - Multirace
Median household income ($) - Other Race
Median household income for houses/condos with a mortgage ($)
Median household income for apartments without a mortgage ($)
Races - White alone (%)
Races - White alone (% change since 2000)
Races - Black alone (%)
Races - Black alone (% change since 2000)
Races - American Indian alone (%)
Races - American Indian alone (% change since 2000)
Races - Asian alone (%)
Races - Asian alone (% change since 2000)
Races - Hispanic (%)
Races - Hispanic (% change since 2000)
Races - Native Hawaiian and Other Pacific Islander alone (%)
Races - Native Hawaiian and Other Pacific Islander alone (% change since 2000)
Races - Two or more races (%)
Races - Two or more races (% change since 2000)
Races - Other race alone (%)
Races - Other race alone (% change since 2000)
Racial diversity
Unemployment (%)
Unemployment (% change since 2000)
Unemployment (%) - White
Unemployment (%) - Black or African American
Unemployment (%) - Asian
Unemployment (%) - Hispanic or Latino
Unemployment (%) - American Indian and Alaska Native
Unemployment (%) - Multirace
Unemployment (%) - Other Race
Population density (people per square mile)
Population - Males (%)
Population - Females (%)
Population - Males (%) - White
Population - Males (%) - Black or African American
Population - Males (%) - Asian
Population - Males (%) - Hispanic or Latino
Population - Males (%) - American Indian and Alaska Native
Population - Males (%) - Multirace
Population - Males (%) - Other Race
Population - Females (%) - White
Population - Females (%) - Black or African American
Population - Females (%) - Asian
Population - Females (%) - Hispanic or Latino
Population - Females (%) - American Indian and Alaska Native
Population - Females (%) - Multirace
Population - Females (%) - Other Race
Coronavirus confirmed cases (Apr 24, 2024)
Deaths caused by coronavirus (Apr 24, 2024)
Coronavirus confirmed cases (per 100k population) (Apr 24, 2024)
Deaths caused by coronavirus (per 100k population) (Apr 24, 2024)
Daily increase in number of cases (Apr 24, 2024)
Weekly increase in number of cases (Apr 24, 2024)
Cases doubled (in days) (Apr 24, 2024)
Hospitalized patients (Apr 18, 2022)
Negative test results (Apr 18, 2022)
Total test results (Apr 18, 2022)
COVID Vaccine doses distributed (per 100k population) (Sep 19, 2023)
COVID Vaccine doses administered (per 100k population) (Sep 19, 2023)
COVID Vaccine doses distributed (Sep 19, 2023)
COVID Vaccine doses administered (Sep 19, 2023)
Likely homosexual households (%)
Likely homosexual households (% change since 2000)
Likely homosexual households - Lesbian couples (%)
Likely homosexual households - Lesbian couples (% change since 2000)
Likely homosexual households - Gay men (%)
Likely homosexual households - Gay men (% change since 2000)
Cost of living index
Median gross rent ($)
Median contract rent ($)
Median monthly housing costs ($)
Median house or condo value ($)
Median house or condo value ($ change since 2000)
Mean house or condo value by units in structure - 1, detached ($)
Mean house or condo value by units in structure - 1, attached ($)
Mean house or condo value by units in structure - 2 ($)
Mean house or condo value by units in structure by units in structure - 3 or 4 ($)
Mean house or condo value by units in structure - 5 or more ($)
Mean house or condo value by units in structure - Boat, RV, van, etc. ($)
Mean house or condo value by units in structure - Mobile home ($)
Median house or condo value ($) - White
Median house or condo value ($) - Black or African American
Median house or condo value ($) - Asian
Median house or condo value ($) - Hispanic or Latino
Median house or condo value ($) - American Indian and Alaska Native
Median house or condo value ($) - Multirace
Median house or condo value ($) - Other Race
Median resident age
Resident age diversity
Median resident age - Males
Median resident age - Females
Median resident age - White
Median resident age - Black or African American
Median resident age - Asian
Median resident age - Hispanic or Latino
Median resident age - American Indian and Alaska Native
Median resident age - Multirace
Median resident age - Other Race
Median resident age - Males - White
Median resident age - Males - Black or African American
Median resident age - Males - Asian
Median resident age - Males - Hispanic or Latino
Median resident age - Males - American Indian and Alaska Native
Median resident age - Males - Multirace
Median resident age - Males - Other Race
Median resident age - Females - White
Median resident age - Females - Black or African American
Median resident age - Females - Asian
Median resident age - Females - Hispanic or Latino
Median resident age - Females - American Indian and Alaska Native
Median resident age - Females - Multirace
Median resident age - Females - Other Race
Commute - mean travel time to work (minutes)
Travel time to work - Less than 5 minutes (%)
Travel time to work - Less than 5 minutes (% change since 2000)
Travel time to work - 5 to 9 minutes (%)
Travel time to work - 5 to 9 minutes (% change since 2000)
Travel time to work - 10 to 19 minutes (%)
Travel time to work - 10 to 19 minutes (% change since 2000)
Travel time to work - 20 to 29 minutes (%)
Travel time to work - 20 to 29 minutes (% change since 2000)
Travel time to work - 30 to 39 minutes (%)
Travel time to work - 30 to 39 minutes (% change since 2000)
Travel time to work - 40 to 59 minutes (%)
Travel time to work - 40 to 59 minutes (% change since 2000)
Travel time to work - 60 to 89 minutes (%)
Travel time to work - 60 to 89 minutes (% change since 2000)
Travel time to work - 90 or more minutes (%)
Travel time to work - 90 or more minutes (% change since 2000)
Marital status - Never married (%)
Marital status - Now married (%)
Marital status - Separated (%)
Marital status - Widowed (%)
Marital status - Divorced (%)
Median family income ($)
Median family income (% change since 2000)
Median non-family income ($)
Median non-family income (% change since 2000)
Median per capita income ($)
Median per capita income (% change since 2000)
Median family income ($) - White
Median family income ($) - Black or African American
Median family income ($) - Asian
Median family income ($) - Hispanic or Latino
Median family income ($) - American Indian and Alaska Native
Median family income ($) - Multirace
Median family income ($) - Other Race
Median year house/condo built
Median year apartment built
Year house built - Built 2005 or later (%)
Year house built - Built 2000 to 2004 (%)
Year house built - Built 1990 to 1999 (%)
Year house built - Built 1980 to 1989 (%)
Year house built - Built 1970 to 1979 (%)
Year house built - Built 1960 to 1969 (%)
Year house built - Built 1950 to 1959 (%)
Year house built - Built 1940 to 1949 (%)
Year house built - Built 1939 or earlier (%)
Average household size
Household density (households per square mile)
Average household size - White
Average household size - Black or African American
Average household size - Asian
Average household size - Hispanic or Latino
Average household size - American Indian and Alaska Native
Average household size - Multirace
Average household size - Other Race
Occupied housing units (%)
Vacant housing units (%)
Owner occupied housing units (%)
Renter occupied housing units (%)
Vacancy status - For rent (%)
Vacancy status - For sale only (%)
Vacancy status - Rented or sold, not occupied (%)
Vacancy status - For seasonal, recreational, or occasional use (%)
Vacancy status - For migrant workers (%)
Vacancy status - Other vacant (%)
Residents with income below the poverty level (%)
Residents with income below 50% of the poverty level (%)
Children below poverty level (%)
Poor families by family type - Married-couple family (%)
Poor families by family type - Male, no wife present (%)
Poor families by family type - Female, no husband present (%)
Poverty status for native-born residents (%)
Poverty status for foreign-born residents (%)
Poverty among high school graduates not in families (%)
Poverty among people who did not graduate high school not in families (%)
Residents with income below the poverty level (%) - White
Residents with income below the poverty level (%) - Black or African American
Residents with income below the poverty level (%) - Asian
Residents with income below the poverty level (%) - Hispanic or Latino
Residents with income below the poverty level (%) - American Indian and Alaska Native
Residents with income below the poverty level (%) - Multirace
Residents with income below the poverty level (%) - Other Race
Air pollution - Air Quality Index (AQI)
Air pollution - CO
Air pollution - NO2
Air pollution - SO2
Air pollution - Ozone
Air pollution - PM10
Air pollution - PM25
Air pollution - Pb
Crime - Murders per 100,000 population
Crime - Rapes per 100,000 population
Crime - Robberies per 100,000 population
Crime - Assaults per 100,000 population
Crime - Burglaries per 100,000 population
Crime - Thefts per 100,000 population
Crime - Auto thefts per 100,000 population
Crime - Arson per 100,000 population
Crime - City-data.com crime index
Crime - Violent crime index
Crime - Property crime index
Crime - Murders per 100,000 population (5 year average)
Crime - Rapes per 100,000 population (5 year average)
Crime - Robberies per 100,000 population (5 year average)
Crime - Assaults per 100,000 population (5 year average)
Crime - Burglaries per 100,000 population (5 year average)
Crime - Thefts per 100,000 population (5 year average)
Crime - Auto thefts per 100,000 population (5 year average)
Crime - Arson per 100,000 population (5 year average)
Crime - City-data.com crime index (5 year average)
Crime - Violent crime index (5 year average)
Crime - Property crime index (5 year average)
1996 Presidential Elections Results (%) - Democratic Party (Clinton)
1996 Presidential Elections Results (%) - Republican Party (Dole)
1996 Presidential Elections Results (%) - Other
2000 Presidential Elections Results (%) - Democratic Party (Gore)
2000 Presidential Elections Results (%) - Republican Party (Bush)
2000 Presidential Elections Results (%) - Other
2004 Presidential Elections Results (%) - Democratic Party (Kerry)
2004 Presidential Elections Results (%) - Republican Party (Bush)
2004 Presidential Elections Results (%) - Other
2008 Presidential Elections Results (%) - Democratic Party (Obama)
2008 Presidential Elections Results (%) - Republican Party (McCain)
2008 Presidential Elections Results (%) - Other
2012 Presidential Elections Results (%) - Democratic Party (Obama)
2012 Presidential Elections Results (%) - Republican Party (Romney)
2012 Presidential Elections Results (%) - Other
2016 Presidential Elections Results (%) - Democratic Party (Clinton)
2016 Presidential Elections Results (%) - Republican Party (Trump)
2016 Presidential Elections Results (%) - Other
2020 Presidential Elections Results (%) - Democratic Party (Biden)
2020 Presidential Elections Results (%) - Republican Party (Trump)
2020 Presidential Elections Results (%) - Other
Ancestries Reported - Arab (%)
Ancestries Reported - Czech (%)
Ancestries Reported - Danish (%)
Ancestries Reported - Dutch (%)
Ancestries Reported - English (%)
Ancestries Reported - French (%)
Ancestries Reported - French Canadian (%)
Ancestries Reported - German (%)
Ancestries Reported - Greek (%)
Ancestries Reported - Hungarian (%)
Ancestries Reported - Irish (%)
Ancestries Reported - Italian (%)
Ancestries Reported - Lithuanian (%)
Ancestries Reported - Norwegian (%)
Ancestries Reported - Polish (%)
Ancestries Reported - Portuguese (%)
Ancestries Reported - Russian (%)
Ancestries Reported - Scotch-Irish (%)
Ancestries Reported - Scottish (%)
Ancestries Reported - Slovak (%)
Ancestries Reported - Subsaharan African (%)
Ancestries Reported - Swedish (%)
Ancestries Reported - Swiss (%)
Ancestries Reported - Ukrainian (%)
Ancestries Reported - United States (%)
Ancestries Reported - Welsh (%)
Ancestries Reported - West Indian (%)
Ancestries Reported - Other (%)
Educational Attainment - No schooling completed (%)
Educational Attainment - Less than high school (%)
Educational Attainment - High school or equivalent (%)
Educational Attainment - Less than 1 year of college (%)
Educational Attainment - 1 or more years of college (%)
Educational Attainment - Associate degree (%)
Educational Attainment - Bachelor's degree (%)
Educational Attainment - Master's degree (%)
Educational Attainment - Professional school degree (%)
Educational Attainment - Doctorate degree (%)
School Enrollment - Nursery, preschool (%)
School Enrollment - Kindergarten (%)
School Enrollment - Grade 1 to 4 (%)
School Enrollment - Grade 5 to 8 (%)
School Enrollment - Grade 9 to 12 (%)
School Enrollment - College undergrad (%)
School Enrollment - Graduate or professional (%)
School Enrollment - Not enrolled in school (%)
School enrollment - Public schools (%)
School enrollment - Private schools (%)
School enrollment - Not enrolled (%)
Median number of rooms in houses and condos
Median number of rooms in apartments
Housing units lacking complete plumbing facilities (%)
Housing units lacking complete kitchen facilities (%)
Density of houses
Urban houses (%)
Rural houses (%)
Households with people 60 years and over (%)
Households with people 65 years and over (%)
Households with people 75 years and over (%)
Households with one or more nonrelatives (%)
Households with no nonrelatives (%)
Population in households (%)
Family households (%)
Nonfamily households (%)
Population in families (%)
Family households with own children (%)
Median number of bedrooms in owner occupied houses
Mean number of bedrooms in owner occupied houses
Median number of bedrooms in renter occupied houses
Mean number of bedrooms in renter occupied houses
Median number of vehichles in owner occupied houses
Mean number of vehichles in owner occupied houses
Median number of vehichles in renter occupied houses
Mean number of vehichles in renter occupied houses
Mortgage status - with mortgage (%)
Mortgage status - with second mortgage (%)
Mortgage status - with home equity loan (%)
Mortgage status - with both second mortgage and home equity loan (%)
Mortgage status - without a mortgage (%)
Average family size
Average family size - White
Average family size - Black or African American
Average family size - Asian
Average family size - Hispanic or Latino
Average family size - American Indian and Alaska Native
Average family size - Multirace
Average family size - Other Race
Geographical mobility - Same house 1 year ago (%)
Geographical mobility - Moved within same county (%)
Geographical mobility - Moved from different county within same state (%)
Geographical mobility - Moved from different state (%)
Geographical mobility - Moved from abroad (%)
Place of birth - Born in state of residence (%)
Place of birth - Born in other state (%)
Place of birth - Native, outside of US (%)
Place of birth - Foreign born (%)
Housing units in structures - 1, detached (%)
Housing units in structures - 1, attached (%)
Housing units in structures - 2 (%)
Housing units in structures - 3 or 4 (%)
Housing units in structures - 5 to 9 (%)
Housing units in structures - 10 to 19 (%)
Housing units in structures - 20 to 49 (%)
Housing units in structures - 50 or more (%)
Housing units in structures - Mobile home (%)
Housing units in structures - Boat, RV, van, etc. (%)
House/condo owner moved in on average (years ago)
Renter moved in on average (years ago)
Year householder moved into unit - Moved in 1999 to March 2000 (%)
Year householder moved into unit - Moved in 1995 to 1998 (%)
Year householder moved into unit - Moved in 1990 to 1994 (%)
Year householder moved into unit - Moved in 1980 to 1989 (%)
Year householder moved into unit - Moved in 1970 to 1979 (%)
Year householder moved into unit - Moved in 1969 or earlier (%)
Means of transportation to work - Drove car alone (%)
Means of transportation to work - Carpooled (%)
Means of transportation to work - Public transportation (%)
Means of transportation to work - Bus or trolley bus (%)
Means of transportation to work - Streetcar or trolley car (%)
Means of transportation to work - Subway or elevated (%)
Means of transportation to work - Railroad (%)
Means of transportation to work - Ferryboat (%)
Means of transportation to work - Taxicab (%)
Means of transportation to work - Motorcycle (%)
Means of transportation to work - Bicycle (%)
Means of transportation to work - Walked (%)
Means of transportation to work - Other means (%)
Working at home (%)
Industry diversity
Most Common Industries - Agriculture, forestry, fishing and hunting, and mining (%)
Most Common Industries - Agriculture, forestry, fishing and hunting (%)
Most Common Industries - Mining, quarrying, and oil and gas extraction (%)
Most Common Industries - Construction (%)
Most Common Industries - Manufacturing (%)
Most Common Industries - Wholesale trade (%)
Most Common Industries - Retail trade (%)
Most Common Industries - Transportation and warehousing, and utilities (%)
Most Common Industries - Transportation and warehousing (%)
Most Common Industries - Utilities (%)
Most Common Industries - Information (%)
Most Common Industries - Finance and insurance, and real estate and rental and leasing (%)
Most Common Industries - Finance and insurance (%)
Most Common Industries - Real estate and rental and leasing (%)
Most Common Industries - Professional, scientific, and management, and administrative and waste management services (%)
Most Common Industries - Professional, scientific, and technical services (%)
Most Common Industries - Management of companies and enterprises (%)
Most Common Industries - Administrative and support and waste management services (%)
Most Common Industries - Educational services, and health care and social assistance (%)
Most Common Industries - Educational services (%)
Most Common Industries - Health care and social assistance (%)
Most Common Industries - Arts, entertainment, and recreation, and accommodation and food services (%)
Most Common Industries - Arts, entertainment, and recreation (%)
Most Common Industries - Accommodation and food services (%)
Most Common Industries - Other services, except public administration (%)
Most Common Industries - Public administration (%)
Occupation diversity
Most Common Occupations - Management, business, science, and arts occupations (%)
Most Common Occupations - Management, business, and financial occupations (%)
Most Common Occupations - Management occupations (%)
Most Common Occupations - Business and financial operations occupations (%)
Most Common Occupations - Computer, engineering, and science occupations (%)
Most Common Occupations - Computer and mathematical occupations (%)
Most Common Occupations - Architecture and engineering occupations (%)
Most Common Occupations - Life, physical, and social science occupations (%)
Most Common Occupations - Education, legal, community service, arts, and media occupations (%)
Most Common Occupations - Community and social service occupations (%)
Most Common Occupations - Legal occupations (%)
Most Common Occupations - Education, training, and library occupations (%)
Most Common Occupations - Arts, design, entertainment, sports, and media occupations (%)
Most Common Occupations - Healthcare practitioners and technical occupations (%)
Most Common Occupations - Health diagnosing and treating practitioners and other technical occupations (%)
Most Common Occupations - Health technologists and technicians (%)
Most Common Occupations - Service occupations (%)
Most Common Occupations - Healthcare support occupations (%)
Most Common Occupations - Protective service occupations (%)
Most Common Occupations - Fire fighting and prevention, and other protective service workers including supervisors (%)
Most Common Occupations - Law enforcement workers including supervisors (%)
Most Common Occupations - Food preparation and serving related occupations (%)
Most Common Occupations - Building and grounds cleaning and maintenance occupations (%)
Most Common Occupations - Personal care and service occupations (%)
Most Common Occupations - Sales and office occupations (%)
Most Common Occupations - Sales and related occupations (%)
Most Common Occupations - Office and administrative support occupations (%)
Most Common Occupations - Natural resources, construction, and maintenance occupations (%)
Most Common Occupations - Farming, fishing, and forestry occupations (%)
Most Common Occupations - Construction and extraction occupations (%)
Most Common Occupations - Installation, maintenance, and repair occupations (%)
Most Common Occupations - Production, transportation, and material moving occupations (%)
Most Common Occupations - Production occupations (%)
Most Common Occupations - Transportation occupations (%)
Most Common Occupations - Material moving occupations (%)
People in Group quarters - Institutionalized population (%)
People in Group quarters - Correctional institutions (%)
People in Group quarters - Federal prisons and detention centers (%)
People in Group quarters - Halfway houses (%)
People in Group quarters - Local jails and other confinement facilities (including police lockups) (%)
People in Group quarters - Military disciplinary barracks (%)
People in Group quarters - State prisons (%)
People in Group quarters - Other types of correctional institutions (%)
People in Group quarters - Nursing homes (%)
People in Group quarters - Hospitals/wards, hospices, and schools for the handicapped (%)
People in Group quarters - Hospitals/wards and hospices for chronically ill (%)
People in Group quarters - Hospices or homes for chronically ill (%)
People in Group quarters - Military hospitals or wards for chronically ill (%)
People in Group quarters - Other hospitals or wards for chronically ill (%)
People in Group quarters - Hospitals or wards for drug/alcohol abuse (%)
People in Group quarters - Mental (Psychiatric) hospitals or wards (%)
People in Group quarters - Schools, hospitals, or wards for the mentally retarded (%)
People in Group quarters - Schools, hospitals, or wards for the physically handicapped (%)
People in Group quarters - Institutions for the deaf (%)
People in Group quarters - Institutions for the blind (%)
People in Group quarters - Orthopedic wards and institutions for the physically handicapped (%)
People in Group quarters - Wards in general hospitals for patients who have no usual home elsewhere (%)
People in Group quarters - Wards in military hospitals for patients who have no usual home elsewhere (%)
People in Group quarters - Juvenile institutions (%)
People in Group quarters - Long-term care (%)
People in Group quarters - Homes for abused, dependent, and neglected children (%)
People in Group quarters - Residential treatment centers for emotionally disturbed children (%)
People in Group quarters - Training schools for juvenile delinquents (%)
People in Group quarters - Short-term care, detention or diagnostic centers for delinquent children (%)
People in Group quarters - Type of juvenile institution unknown (%)
People in Group quarters - Noninstitutionalized population (%)
People in Group quarters - College dormitories (includes college quarters off campus) (%)
People in Group quarters - Military quarters (%)
People in Group quarters - On base (%)
People in Group quarters - Barracks, unaccompanied personnel housing (UPH), (Enlisted/Officer), ;and similar group living quarters for military personnel (%)
People in Group quarters - Transient quarters for temporary residents (%)
People in Group quarters - Military ships (%)
People in Group quarters - Group homes (%)
People in Group quarters - Homes or halfway houses for drug/alcohol abuse (%)
People in Group quarters - Homes for the mentally ill (%)
People in Group quarters - Homes for the mentally retarded (%)
People in Group quarters - Homes for the physically handicapped (%)
People in Group quarters - Other group homes (%)
People in Group quarters - Religious group quarters (%)
People in Group quarters - Dormitories (%)
People in Group quarters - Agriculture workers' dormitories on farms (%)
People in Group quarters - Job Corps and vocational training facilities (%)
People in Group quarters - Other workers' dormitories (%)
People in Group quarters - Crews of maritime vessels (%)
People in Group quarters - Other nonhousehold living situations (%)
People in Group quarters - Other noninstitutional group quarters (%)
Residents speaking English at home (%)
Residents speaking English at home - Born in the United States (%)
Residents speaking English at home - Native, born elsewhere (%)
Residents speaking English at home - Foreign born (%)
Residents speaking Spanish at home (%)
Residents speaking Spanish at home - Born in the United States (%)
Residents speaking Spanish at home - Native, born elsewhere (%)
Residents speaking Spanish at home - Foreign born (%)
Residents speaking other language at home (%)
Residents speaking other language at home - Born in the United States (%)
Residents speaking other language at home - Native, born elsewhere (%)
Residents speaking other language at home - Foreign born (%)
Class of Workers - Employee of private company (%)
Class of Workers - Self-employed in own incorporated business (%)
Class of Workers - Private not-for-profit wage and salary workers (%)
Class of Workers - Local government workers (%)
Class of Workers - State government workers (%)
Class of Workers - Federal government workers (%)
Class of Workers - Self-employed workers in own not incorporated business and Unpaid family workers (%)
House heating fuel used in houses and condos - Utility gas (%)
House heating fuel used in houses and condos - Bottled, tank, or LP gas (%)
House heating fuel used in houses and condos - Electricity (%)
House heating fuel used in houses and condos - Fuel oil, kerosene, etc. (%)
House heating fuel used in houses and condos - Coal or coke (%)
House heating fuel used in houses and condos - Wood (%)
House heating fuel used in houses and condos - Solar energy (%)
House heating fuel used in houses and condos - Other fuel (%)
House heating fuel used in houses and condos - No fuel used (%)
House heating fuel used in apartments - Utility gas (%)
House heating fuel used in apartments - Bottled, tank, or LP gas (%)
House heating fuel used in apartments - Electricity (%)
House heating fuel used in apartments - Fuel oil, kerosene, etc. (%)
House heating fuel used in apartments - Coal or coke (%)
House heating fuel used in apartments - Wood (%)
House heating fuel used in apartments - Solar energy (%)
House heating fuel used in apartments - Other fuel (%)
House heating fuel used in apartments - No fuel used (%)
Armed forces status - In Armed Forces (%)
Armed forces status - Civilian (%)
Armed forces status - Civilian - Veteran (%)
Armed forces status - Civilian - Nonveteran (%)
Fatal accidents locations in years 2005-2021
Fatal accidents locations in 2005
Fatal accidents locations in 2006
Fatal accidents locations in 2007
Fatal accidents locations in 2008
Fatal accidents locations in 2009
Fatal accidents locations in 2010
Fatal accidents locations in 2011
Fatal accidents locations in 2012
Fatal accidents locations in 2013
Fatal accidents locations in 2014
Fatal accidents locations in 2015
Fatal accidents locations in 2016
Fatal accidents locations in 2017
Fatal accidents locations in 2018
Fatal accidents locations in 2019
Fatal accidents locations in 2020
Fatal accidents locations in 2021
Alcohol use - People drinking some alcohol every month (%)
Alcohol use - People not drinking at all (%)
Alcohol use - Average days/month drinking alcohol
Alcohol use - Average drinks/week
Alcohol use - Average days/year people drink much
Audiometry - Average condition of hearing (%)
Audiometry - People that can hear a whisper from across a quiet room (%)
Audiometry - People that can hear normal voice from across a quiet room (%)
Audiometry - Ears ringing, roaring, buzzing (%)
Audiometry - Had a job exposure to loud noise (%)
Audiometry - Had off-work exposure to loud noise (%)
Blood Pressure & Cholesterol - Has high blood pressure (%)
Blood Pressure & Cholesterol - Checking blood pressure at home (%)
Blood Pressure & Cholesterol - Frequently checking blood cholesterol (%)
Blood Pressure & Cholesterol - Has high cholesterol level (%)
Consumer Behavior - Money monthly spent on food at supermarket/grocery store
Consumer Behavior - Money monthly spent on food at other stores
Consumer Behavior - Money monthly spent on eating out
Consumer Behavior - Money monthly spent on carryout/delivered foods
Consumer Behavior - Income spent on food at supermarket/grocery store (%)
Consumer Behavior - Income spent on food at other stores (%)
Consumer Behavior - Income spent on eating out (%)
Consumer Behavior - Income spent on carryout/delivered foods (%)
Current Health Status - General health condition (%)
Current Health Status - Blood donors (%)
Current Health Status - Has blood ever tested for HIV virus (%)
Current Health Status - Left-handed people (%)
Dermatology - People using sunscreen (%)
Diabetes - Diabetics (%)
Diabetes - Had a blood test for high blood sugar (%)
Diabetes - People taking insulin (%)
Diet Behavior & Nutrition - Diet health (%)
Diet Behavior & Nutrition - Milk product consumption (# of products/month)
Diet Behavior & Nutrition - Meals not home prepared (#/week)
Diet Behavior & Nutrition - Meals from fast food or pizza place (#/week)
Diet Behavior & Nutrition - Ready-to-eat foods (#/month)
Diet Behavior & Nutrition - Frozen meals/pizza (#/month)
Drug Use - People that ever used marijuana or hashish (%)
Drug Use - Ever used hard drugs (%)
Drug Use - Ever used any form of cocaine (%)
Drug Use - Ever used heroin (%)
Drug Use - Ever used methamphetamine (%)
Health Insurance - People covered by health insurance (%)
Kidney Conditions-Urology - Avg. # of times urinating at night
Medical Conditions - People with asthma (%)
Medical Conditions - People with anemia (%)
Medical Conditions - People with psoriasis (%)
Medical Conditions - People with overweight (%)
Medical Conditions - Elderly people having difficulties in thinking or remembering (%)
Medical Conditions - People who ever received blood transfusion (%)
Medical Conditions - People having trouble seeing even with glass/contacts (%)
Medical Conditions - People with arthritis (%)
Medical Conditions - People with gout (%)
Medical Conditions - People with congestive heart failure (%)
Medical Conditions - People with coronary heart disease (%)
Medical Conditions - People with angina pectoris (%)
Medical Conditions - People who ever had heart attack (%)
Medical Conditions - People who ever had stroke (%)
Medical Conditions - People with emphysema (%)
Medical Conditions - People with thyroid problem (%)
Medical Conditions - People with chronic bronchitis (%)
Medical Conditions - People with any liver condition (%)
Medical Conditions - People who ever had cancer or malignancy (%)
Mental Health - People who have little interest in doing things (%)
Mental Health - People feeling down, depressed, or hopeless (%)
Mental Health - People who have trouble sleeping or sleeping too much (%)
Mental Health - People feeling tired or having little energy (%)
Mental Health - People with poor appetite or overeating (%)
Mental Health - People feeling bad about themself (%)
Mental Health - People who have trouble concentrating on things (%)
Mental Health - People moving or speaking slowly or too fast (%)
Mental Health - People having thoughts they would be better off dead (%)
Oral Health - Average years since last visit a dentist
Oral Health - People embarrassed because of mouth (%)
Oral Health - People with gum disease (%)
Oral Health - General health of teeth and gums (%)
Oral Health - Average days a week using dental floss/device
Oral Health - Average days a week using mouthwash for dental problem
Oral Health - Average number of teeth
Pesticide Use - Households using pesticides to control insects (%)
Pesticide Use - Households using pesticides to kill weeds (%)
Physical Activity - People doing vigorous-intensity work activities (%)
Physical Activity - People doing moderate-intensity work activities (%)
Physical Activity - People walking or bicycling (%)
Physical Activity - People doing vigorous-intensity recreational activities (%)
Physical Activity - People doing moderate-intensity recreational activities (%)
Physical Activity - Average hours a day doing sedentary activities
Physical Activity - Average hours a day watching TV or videos
Physical Activity - Average hours a day using computer
Physical Functioning - People having limitations keeping them from working (%)
Physical Functioning - People limited in amount of work they can do (%)
Physical Functioning - People that need special equipment to walk (%)
Physical Functioning - People experiencing confusion/memory problems (%)
Physical Functioning - People requiring special healthcare equipment (%)
Prescription Medications - Average number of prescription medicines taking
Preventive Aspirin Use - Adults 40+ taking low-dose aspirin (%)
Reproductive Health - Vaginal deliveries (%)
Reproductive Health - Cesarean deliveries (%)
Reproductive Health - Deliveries resulted in a live birth (%)
Reproductive Health - Pregnancies resulted in a delivery (%)
Reproductive Health - Women breastfeeding newborns (%)
Reproductive Health - Women that had a hysterectomy (%)
Reproductive Health - Women that had both ovaries removed (%)
Reproductive Health - Women that have ever taken birth control pills (%)
Reproductive Health - Women taking birth control pills (%)
Reproductive Health - Women that have ever used Depo-Provera or injectables (%)
Reproductive Health - Women that have ever used female hormones (%)
Sexual Behavior - People 18+ that ever had sex (vaginal, anal, or oral) (%)
Sexual Behavior - Males 18+ that ever had vaginal sex with a woman (%)
Sexual Behavior - Males 18+ that ever performed oral sex on a woman (%)
Sexual Behavior - Males 18+ that ever had anal sex with a woman (%)
Sexual Behavior - Males 18+ that ever had any sex with a man (%)
Sexual Behavior - Females 18+ that ever had vaginal sex with a man (%)
Sexual Behavior - Females 18+ that ever performed oral sex on a man (%)
Sexual Behavior - Females 18+ that ever had anal sex with a man (%)
Sexual Behavior - Females 18+ that ever had any kind of sex with a woman (%)
Sexual Behavior - Average age people first had sex
Sexual Behavior - Average number of female sex partners in lifetime (males 18+)
Sexual Behavior - Average number of female vaginal sex partners in lifetime (males 18+)
Sexual Behavior - Average age people first performed oral sex on a woman (18+)
Sexual Behavior - Average number of woman performed oral sex on in lifetime (18+)
Sexual Behavior - Average number of male sex partners in lifetime (males 18+)
Sexual Behavior - Average number of male anal sex partners in lifetime (males 18+)
Sexual Behavior - Average age people first performed oral sex on a man (18+)
Sexual Behavior - Average number of male oral sex partners in lifetime (18+)
Sexual Behavior - People using protection when performing oral sex (%)
Sexual Behavior - Average number of times people have vaginal or anal sex a year
Sexual Behavior - People having sex without condom (%)
Sexual Behavior - Average number of male sex partners in lifetime (females 18+)
Sexual Behavior - Average number of male vaginal sex partners in lifetime (females 18+)
Sexual Behavior - Average number of female sex partners in lifetime (females 18+)
Sexual Behavior - Circumcised males 18+ (%)
Sleep Disorders - Average hours sleeping at night
Sleep Disorders - People that has trouble sleeping (%)
Smoking-Cigarette Use - People smoking cigarettes (%)
Taste & Smell - People 40+ having problems with smell (%)
Taste & Smell - People 40+ having problems with taste (%)
Taste & Smell - People 40+ that ever had wisdom teeth removed (%)
Taste & Smell - People 40+ that ever had tonsils teeth removed (%)
Taste & Smell - People 40+ that ever had a loss of consciousness because of a head injury (%)
Taste & Smell - People 40+ that ever had a broken nose or other serious injury to face or skull (%)
Taste & Smell - People 40+ that ever had two or more sinus infections (%)
Weight - Average height (inches)
Weight - Average weight (pounds)
Weight - Average BMI
Weight - People that are obese (%)
Weight - People that ever were obese (%)
Weight - People trying to lose weight (%)
Urban population: 3,240
Rural population: 10,007
Estimated median house/condo value in 2022: $186,879
75644:
$186,879Texas:
$275,400
Median resident age: This zip code:
40.6 yearsTexas median age:
35.6 years
Average household size: This zip code:
2.7 peopleTexas:
2.6 people
Averages for the 2020 tax year for zip code 75644, filed in 2021:
Average Adjusted Gross Income (AGI) in 2020: $50,850 (Individual Income Tax Returns) Here:
$50,850State:
$77,054
Salary/wage: $45,275 (reported on 79.3% of returns )Here:
$45,275State:
$62,766
(% of AGI for various income ranges: 1237.4% for AGIs below $25k , 3396.6% for AGIs $25k-50k , 6108.5% for AGIs $50k-75k , 9226.6% for AGIs $75k-100k , 16577.2% for AGIs $100k-200k , 70170.0% for AGIs over 200k ) Taxable interest for individuals: $1,620 (reported on 28.5% of returns )This zip code:
$1,620Texas:
$2,665
(% of AGI for various income ranges: 24.6% for AGIs below $25k , 32.2% for AGIs $25k-50k , 35.6% for AGIs $50k-75k , 72.8% for AGIs $75k-100k , 231.2% for AGIs $100k-200k , 2480.0% for AGIs over 200k ) Ordinary dividends: $4,940 (reported on 11.6% of returns )(% of AGI for various income ranges: 15.5% for AGIs below $25k , 32.8% for AGIs $25k-50k , 54.6% for AGIs $50k-75k , 101.2% for AGIs $75k-100k , 270.0% for AGIs $100k-200k , 4460.0% for AGIs over 200k ) Net capital gain/loss in AGI: +$15,632 (reported on 11.6% of returns )Here:
+$15,632State:
+$39,590
(% of AGI for various income ranges: 10.8% for AGIs below $25k , 49.0% for AGIs $25k-50k , 51.5% for AGIs $50k-75k , 209.4% for AGIs $75k-100k , 939.1% for AGIs $100k-200k , 23650.0% for AGIs over 200k ) Profit/loss from business: +$11,550 (reported on 19.6% of returns )Here:
+$11,550State:
+$10,888
(% of AGI for various income ranges: 142.3% for AGIs below $25k , 152.8% for AGIs $25k-50k , 278.1% for AGIs $50k-75k , 173.1% for AGIs $75k-100k , 745.0% for AGIs $100k-200k , 17125.0% for AGIs over 200k ) Taxable individual retirement arrangement distribution: $19,405 (reported on 7.8% of returns )75644:
$19,405Texas:
$24,740
(% of AGI for various income ranges: 49.1% for AGIs below $25k , 110.0% for AGIs $25k-50k , 290.9% for AGIs $50k-75k , 452.5% for AGIs $75k-100k , 877.5% for AGIs $100k-200k ) Total itemized deductions: $36,445 (reported on 4.3% of returns )Here:
$36,445State:
$40,428
(% of AGI for various income ranges: 30.0% for AGIs below $25k , 97.3% for AGIs $25k-50k , 214.6% for AGIs $50k-75k , 271.9% for AGIs $75k-100k , 715.9% for AGIs $100k-200k , 10935.0% for AGIs over 200k ) Charity contributions: $14,153 (reported on 3.3% of returns )Here:
$14,153State:
$18,201
(% of AGI for various income ranges: 19.8% for AGIs $25k-50k , 38.5% for AGIs $50k-75k , 83.4% for AGIs $75k-100k , 278.4% for AGIs $100k-200k , 4120.0% for AGIs over 200k ) Taxes paid: $5,752 (reported on 4.1% of returns )(% of AGI for various income ranges: 19.0% for AGIs $25k-50k , 25.9% for AGIs $50k-75k , 48.1% for AGIs $75k-100k , 127.2% for AGIs $100k-200k , 1500.0% for AGIs over 200k ) Earned income credit: $2,611 (reported on 22.3% of returns )(% of AGI for various income ranges: 127.3% for AGIs below $25k , 98.5% for AGIs $25k-50k , 3.7% for AGIs $50k-75k ) Percentage of individuals using paid preparers for their 2020 taxes: 93.8%(% for various income ranges: 92.5% for AGIs below $25k , 94.7% for AGIs $25k-50k , 93.2% for AGIs $50k-75k , 95.7% for AGIs $75k-100k , 94.3% for AGIs $100k-200k , 100.0% for AGIs over 200k )
Averages for the 2012 tax year for zip code 75644, filed in 2013:
Average Adjusted Gross Income (AGI) in 2012: $46,313 (Individual Income Tax Returns) Here:
$46,313State:
$65,384
Salary/wage: $40,024 (reported on 81.5% of returns )Here:
$40,024State:
$52,524
(% of AGI for various income ranges: 75.8% for AGIs below $25k , 77.0% for AGIs $25k-50k , 78.0% for AGIs $50k-75k , 79.3% for AGIs $75k-100k , 72.6% for AGIs $100k-200k , 27.0% for AGIs over 200k ) Taxable interest for individuals: $1,511 (reported on 30.5% of returns )This zip code:
$1,511Texas:
$2,372
(% of AGI for various income ranges: 1.3% for AGIs below $25k , 1.0% for AGIs $25k-50k , 1.0% for AGIs $50k-75k , 0.7% for AGIs $75k-100k , 0.7% for AGIs $100k-200k , 1.6% for AGIs over 200k ) Ordinary dividends: $4,173 (reported on 12.4% of returns )(% of AGI for various income ranges: 0.8% for AGIs below $25k , 0.6% for AGIs $25k-50k , 0.8% for AGIs $50k-75k , 1.0% for AGIs $75k-100k , 1.5% for AGIs $100k-200k , 2.2% for AGIs over 200k ) Net capital gain/loss in AGI: +$9,906 (reported on 10.4% of returns )Here:
+$9,906State:
+$35,319
(% of AGI for various income ranges: 0.5% for AGIs $25k-50k , 0.7% for AGIs $50k-75k , 0.6% for AGIs $75k-100k , 2.8% for AGIs $100k-200k , 10.6% for AGIs over 200k ) Profit/loss from business: +$13,811 (reported on 19.5% of returns )Here:
+$13,811State:
+$13,732
(% of AGI for various income ranges: 8.6% for AGIs below $25k , 3.9% for AGIs $25k-50k , 3.4% for AGIs $50k-75k , 4.5% for AGIs $75k-100k , 5.7% for AGIs $100k-200k , 11.9% for AGIs over 200k ) Taxable individual retirement arrangement distribution: $14,475 (reported on 9.1% of returns )75644:
$14,475Texas:
$19,511
(% of AGI for various income ranges: 2.8% for AGIs below $25k , 3.1% for AGIs $25k-50k , 2.7% for AGIs $50k-75k , 2.5% for AGIs $75k-100k , 4.5% for AGIs $100k-200k ) Total itemized deductions: $19,947 (21% of AGI, reported on 17.6% of returns )Here:
$19,947State:
$24,724
Here:
20.9% of AGIState:
15.9% of AGI
(% of AGI for various income ranges: 5.9% for AGIs below $25k , 6.5% for AGIs $25k-50k , 7.1% for AGIs $50k-75k , 7.8% for AGIs $75k-100k , 10.7% for AGIs $100k-200k , 5.6% for AGIs over 200k ) Charity contributions: $6,310 (reported on 13.1% of returns )(% of AGI for various income ranges: 0.7% for AGIs below $25k , 1.3% for AGIs $25k-50k , 1.5% for AGIs $50k-75k , 1.4% for AGIs $75k-100k , 3.1% for AGIs $100k-200k , 2.0% for AGIs over 200k ) Taxes paid: $4,122 (reported on 17.0% of returns )(% of AGI for various income ranges: 0.9% for AGIs below $25k , 1.1% for AGIs $25k-50k , 1.4% for AGIs $50k-75k , 1.6% for AGIs $75k-100k , 2.3% for AGIs $100k-200k , 1.4% for AGIs over 200k ) Earned income credit: $2,423 (reported on 24.9% of returns )(% of AGI for various income ranges: 8.7% for AGIs below $25k , 1.4% for AGIs $25k-50k ) Percentage of individuals using paid preparers for their 2012 taxes: 62.4%(% for various income ranges: 58.8% for AGIs below $25k , 59.0% for AGIs $25k-50k , 66.2% for AGIs $50k-75k , 68.4% for AGIs $75k-100k , 75.0% for AGIs $100k-200k , 100.0% for AGIs over 200k )
Averages for the 2004 tax year for zip code 75644, filed in 2005:
Average Adjusted Gross Income (AGI) in 2004: $31,543 (Individual Income Tax Returns) Here:
$31,543State:
$47,881
Salary/wage: $29,377 (reported on 80.3% of returns )Here:
$29,377State:
$41,947
(% of AGI for various income ranges: 185.9% for AGIs below $10k , 78.1% for AGIs $10k-25k , 82.7% for AGIs $25k-50k , 75.8% for AGIs $50k-75k , 72.6% for AGIs $75k-100k , 48.7% for AGIs over 100k ) Taxable interest for individuals: $2,070 (reported on 37.4% of returns )This zip code:
$2,070Texas:
$2,255
(% of AGI for various income ranges: 10.7% for AGIs below $10k , 2.7% for AGIs $10k-25k , 1.7% for AGIs $25k-50k , 2.1% for AGIs $50k-75k , 2.6% for AGIs $75k-100k , 3.1% for AGIs over 100k ) Taxable dividends: $2,105 (reported on 15.6% of returns )(% of AGI for various income ranges: 2.9% for AGIs below $10k , 0.8% for AGIs $10k-25k , 0.6% for AGIs $25k-50k , 1.0% for AGIs $50k-75k , 0.9% for AGIs $75k-100k , 2.1% for AGIs over 100k ) Net capital gain/loss: +$5,855 (reported on 13.6% of returns )Here:
+$5,855State:
+$16,110
(% of AGI for various income ranges: 0.5% for AGIs below $10k , 0.4% for AGIs $10k-25k , 0.3% for AGIs $25k-50k , 1.4% for AGIs $50k-75k , 3.0% for AGIs $75k-100k , 9.4% for AGIs over 100k ) Profit/loss from business: +$8,225 (reported on 22.0% of returns )Here:
+$8,225State:
+$11,013
(% of AGI for various income ranges: 10.3% for AGIs below $10k , 8.3% for AGIs $10k-25k , 3.5% for AGIs $25k-50k , 2.7% for AGIs $50k-75k , 3.8% for AGIs $75k-100k , 11.8% for AGIs over 100k ) IRA payment deduction: $3,114 (reported on 1.5% of returns )(% of AGI for various income ranges: 0.2% for AGIs $10k-25k , 0.2% for AGIs $25k-50k , 0.1% for AGIs $50k-75k , 0.2% for AGIs $75k-100k ) Self-employed pension: $16,706 (reported on 0.4% of returns )Here:
$16,706Texas:
$16,401
Total itemized deductions: $16,494 (26% of AGI, reported on 16.0% of returns )Here:
$16,494State:
$19,631
Here:
26.2% of AGIState:
18.9% of AGI
(% of AGI for various income ranges: 9.2% for AGIs below $10k , 5.6% for AGIs $10k-25k , 8.5% for AGIs $25k-50k , 8.3% for AGIs $50k-75k , 10.0% for AGIs $75k-100k , 9.5% for AGIs over 100k ) Charity contributions deductions: $5,138 (8% of AGI, reported on 12.8% of returns )Here:
7.8% of AGIState:
4.2% of AGI
(% of AGI for various income ranges: 1.0% for AGIs below $10k , 0.9% for AGIs $10k-25k , 1.5% for AGIs $25k-50k , 1.8% for AGIs $50k-75k , 2.8% for AGIs $75k-100k , 4.0% for AGIs over 100k ) Total tax: $4,248 (reported on 67.6% of returns )(% of AGI for various income ranges: 7.7% for AGIs below $10k , 3.7% for AGIs $10k-25k , 5.9% for AGIs $25k-50k , 8.7% for AGIs $50k-75k , 11.3% for AGIs $75k-100k , 18.2% for AGIs over 100k ) Earned income credit: $2,017 (reported on 26.5% of returns )Percentage of individuals using paid preparers for their 2004 taxes: 69.1%(% for various income ranges: 64.9% for AGIs below $10k , 71.5% for AGIs $10k-25k , 66.8% for AGIs $25k-50k , 69.8% for AGIs $50k-75k , 75.6% for AGIs $75k-100k , 80.1% for AGIs over 100k )
Estimated median household income in 2022: This zip code:
$54,018Texas:
$72,284
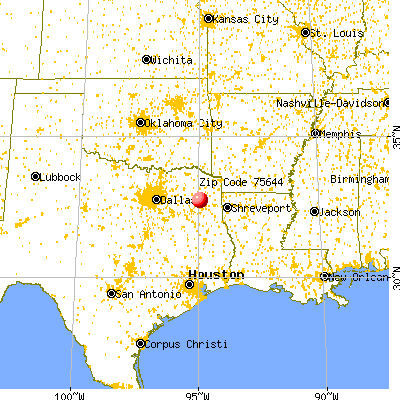
Nearest zip codes: 75645 ,
75755 ,
75686 ,
75451 ,
75683 ,
75765 .
Gilmer Zip Code Map
Percentage of family households: This zip code:
45.9%Texas:
50.5%
Percentage of households with unmarried partners: This zip code:
2.1%Texas:
48.7%
No gay or lesbian households reported
Household received Food Stamps/SNAP in the past 12 months: 831Household did not receive Food Stamps/SNAP in the past 12 months: 3,903
Women who had a birth in the past 12 months: 288 (10 now married , 266 unmarried) Women who did not have a birth in the past 12 months: 2,407 (1,140 now married , 1,264 unmarried)
Housing units in zip code 75644 with a mortgage: 1,496 (56
second mortgage , 38
both second mortgage and home equity loan )
Median monthly owner costs for units with a mortgage: $1,379
Median monthly owner costs for units without a mortgage: $487
Residents with income below the poverty level in 2022:
This zip code:
14.7%Whole state:
14.0%
Residents with income below 50% of the poverty level in 2022:
This zip code:
8.9%Whole state:
7.4%
Median number of rooms in houses and condos: Median number of rooms in apartments: Notable locations in this zip code not listed on our city pages
Click to draw/clear zip code borders Notable locations in zip code 75644: (A) , Gilmont Lookout (B) , Smith Siding (C) , Soules Chapel (D) , Union Ridge Community Center (E) , La Porte Branch Library (F) , Stratford Branch Library (G) , Historic Upshur Museum (H) , Gilmer Fire Department (I) , Ewell Volunteer Fire Department (J) . Display/hide their locations on the map
Churches in zip code 75644 include: (A) , Union Ridge Church (B) , Valley Spring Church (C) , Wallace Chapel (D) , Willow Oak Church (E) , Youngs Chapel (F) , Zion Hill Church (G) , Antioch Church (H) , Cherokee Missionary Church (I) . Display/hide their locations on the map
Cemeteries: (1) , Zion Hill Cemetery (2) , Grice Cemetery (3) , Christian Hope Cemetery (4) , Crossroad Cemetery (5) , Kelsey Cemetery (6) , Lawton Cemetery (7) . Display/hide their locations on the map
Lakes and reservoirs: (A) , Grassy Lake (B) , Lilly Lake (C) , Tallos Lake (D) , Allen Lake (E) , Henderson Lake (F) , Russell Lake (G) , Machen Lake (H) . Display/hide their locations on the map
Streams, rivers, and creeks: (A) , Tanyard Creek (B) , Spratt Creek (C) , Rocky Branch (D) , Prairie Creek (E) , Poor Creek (F) , Olive Branch (G) , Duffy Branch (H) , Duke Branch (I) . Display/hide their locations on the map
Year house built (houses)
57 2020 or later848 2010 to 2019505 2000 to 2009668 1990 to 1999724 1980 to 19891,082 1970 to 1979396 1960 to 1969462 1950 to 1959253 1940 to 1949333 1939 or earlier
Zip code 75644 household income distribution in 2022 255 Less than $10,000363 $10,000 to $14,999191 $15,000 to $19,999157 $20,000 to $24,999278 $25,000 to $29,999189 $30,000 to $34,999222 $35,000 to $39,999196 $40,000 to $44,999356 $45,000 to $49,999360 $50,000 to $59,999505 $60,000 to $74,999492 $75,000 to $99,999342 $100,000 to $124,999358 $125,000 to $149,999229 $150,000 to $199,999200 $200,000 or moreEstimate of home value of owner-occupied houses/condos in 2022 in zip code 75644 150 Less than $10,00065 $10,000 to $14,99934 $15,000 to $19,99935 $20,000 to $24,99940 $25,000 to $29,99930 $30,000 to $34,9996 $35,000 to $39,99922 $40,000 to $49,999123 $50,000 to $59,99931 $60,000 to $69,99963 $70,000 to $79,999117 $80,000 to $89,999140 $90,000 to $99,999171 $100,000 to $124,999178 $125,000 to $149,999453 $150,000 to $174,999100 $175,000 to $199,999482 $200,000 to $249,999330 $250,000 to $299,999198 $300,000 to $399,999220 $400,000 to $499,999118 $500,000 to $749,9994 $750,000 to $999,99922 $1,000,000 to $1,499,999Rent paid by renters in 2022 in zip code 75644 80 $150 to $19912 $200 to $24912 $250 to $2993 $300 to $34912 $350 to $3994 $400 to $44940 $450 to $49934 $500 to $549118 $550 to $599100 $600 to $64954 $650 to $69928 $700 to $749110 $750 to $799150 $800 to $89993 $900 to $999117 $1,000 to $1,2498 $1,250 to $1,499150 No cash rent
Median gross rent in 2022: $901.
Median price asked for vacant for-sale houses and condos in 2022: $127,802.
Estimated median house (or condo) value in 2022 for: White Non-Hispanic householders: $203,511Black or African American householders: $134,696American Indian or Alaska Native householders: $105,995Asian householders: $277,219Some other race householders: $229,929Two or more races householders: $146,763Hispanic or Latino householders: $78,926Estimated median house or condo value in 2022: $186,879
75644:
$186,879Texas:
$275,400
Lower value quartile - upper value quartile: $109,859 - $276,812
Mean price in 2022: Detached houses: $213,122Here:
$213,122State:
$369,058
Townhouses or other attached units: $54,423Here:
$54,423State:
$327,631
Housing units in structures:
One, detached: 4,033One, attached: 109Two: 1483 or 4: 1495 to 9: 6110 to 19: 4920 to 49: 22Mobile homes: 888Boats, RVs, vans, etc.: 28Unemployment : 5.5%
Means of transportation to work in zip code 75644 78.8% 3,642 Drove a car alone11.0% 506 Carpooled0.5% 21 Walked0.8% 37 Other means6.6% 307 Worked at homeTravel time to work (commute) in zip code 75644 109 Less than 5 minutes252 5 to 9 minutes569 10 to 14 minutes482 15 to 19 minutes425 20 to 24 minutes197 25 to 29 minutes470 30 to 34 minutes266 35 to 39 minutes312 40 to 44 minutes612 45 to 59 minutes285 60 to 89 minutes227 90 or more minutes
Percentage of zip code residents living and working in this county: 46.5%
Household type by relationship:
Households: 13,248
Male householders: 2,221 (439 living alone ), Female householders: 2,504 (787 living alone )2,164 spouses (2,153 opposite-sex spouses ), 240 unmarried partners , (240 opposite-sex unmarried partners ), 3,912 children (3,541 natural , 135 adopted , 238 stepchildren ), 583 grandchildren , 207 brothers or sisters , 388 parents , 22 foster children , 339 other relatives , 311 non-relatives In group quarters: 317 (-1 institutionalized population )
Size of family households: 1,621 2-persons , 644 3-persons , 389 4-persons , 268 5-persons , 162 6-persons , 175 7-or-more-persons
Size of nonfamily households: 1,224 1-person , 210 2-persons , 38 3-persons
1,756 married couples with children. single-parent households (30 men , 689 women ).
95.3% of residents of 75644 zip code speak English at home. of residents speak Spanish at home (64% very well, 18% well, 18% not well ).of residents speak other Indo-European language at home (100% very well ).
Foreign born population: 338 (2.6%)
(25.4%
of them are naturalized citizens )
This zip code:
2.6%Whole state:
17.2%
70% Honduras 8% Cabo Verde 7% France 5% Chile 2% Nepal 2% Ivory Coast 1% Japan 21% American 11% English 8% Irish 7% German 1% European 1% Scottish 1% Danish
Year of entry for the foreign-born population
69 2010 or later 26 2000 to 2009 143 1990 to 1999 163 Before 1990
Facilities with environmental interests located in this zip code:
AIRMAX INC (400 DEAN ST in GILMER, TX)
(Resource Conservation and Recovery Act (tracking hazardous waste))
Housing units lacking complete plumbing facilities: 6.0%
Housing units lacking complete kitchen facilities: 4.1%
71.1% Electricity 20.3% Utility gas 5.4% Bottled, tank, or LP gas 1.6% No fuel used 1.3% Wood
Population in 1990: 10,141. Population change in the 1990s: +9,410 (+92.8%).
Place of birth for U.S.-born residents:
This state: 9,797Northeast: 80Midwest: 628South: 1,339West: 930
59% of the 75644 zip code residents lived in the same house 5 years ago.
Out of people who lived in different houses, 43% lived in this county.
Out of people who lived in different counties, 50% lived in Texas.
91% of the 75644 zip code residents lived in the same house 1 year ago.
Out of people who lived in different houses, 48% moved from this county.
Out of people who lived in different houses, 35% moved from different county within same state.
Out of people who lived in different houses, 15% moved from different state.
Out of people who lived in different houses, 2% moved from abroad.
Private vs. public school enrollment:
Students in private schools in grades 1 to 8 (elementary and middle school): 99
Students in private schools in grades 9 to 12 (high school): 78
Students in private undergraduate colleges: 84
Occupation by median earnings in the past 12 months ($)
95,330 Health diagnosing and treating practitioners and other technical occupations 69,812 Management occupations 69,666 Architecture and engineering occupations 62,923 Production occupations 50,665 Education, training, and library occupations 46,244 Building and grounds cleaning and maintenance occupations
Top industries in this zip code by the number of employees in 2005:
Health Care and Social Assistance: Nursing Care Facilities (100-249 employees: 2 establishments)Health Care and Social Assistance: General Medical and Surgical Hospitals (100-249: 1)Accommodation and Food Services: Full-Service Restaurants (50-99: 1, 20-49: 2, 10-19: 1, 5-9: 1)Other Services (except Public Administration): Religious Organizations (50-99: 1, 20-49: 1, 10-19: 1, 5-9: 1, 1-4: 6)Accommodation and Food Services: Limited-Service Restaurants (20-49: 3, 10-19: 1, 5-9: 2, 1-4: 2)Finance and Insurance: Commercial Banking (20-49: 2, 5-9: 2)Utilities: Electric Power Distribution (50-99: 1, 5-9: 1)
People in group quarters in 2010:
168 people in nursing facilities/skilled-nursing facilities
People in group quarters in 2000:
165 people in nursing homes
75 people in local jails and other confinement facilities (including police lockups)
Fatal accident statistics in 2013:
Fatal accident count: 3Vehicles involved in fatal accidents: 5Fatal accidents caused by drunken drivers: 0Fatalities: 3Persons involved in fatal accidents: 7Pedestrians involved in fatal accidents: 0
Fatal accident statistics in 2012:
Fatal accident count: 1Vehicles involved in fatal accidents: 1Fatal accidents caused by drunken drivers: 0Fatalities: 1Persons involved in fatal accidents: 1Pedestrians involved in fatal accidents: 0
Home Mortgage Disclosure Act Aggregated Statistics For Year 2009(Based on 1 full and 12 partial tracts) A) FHA, FSA/RHS & VA B) Conventional C) Refinancings D) Home Improvement Loans E) Loans on Dwellings For 5+ Families F) Non-occupant Loans on G) Loans On Manufactured Number Average Value Number Average Value Number Average Value Number Average Value Number Average Value Number Average Value Number Average Value
LOANS ORIGINATED 136 $124,586 235 $119,221 391 $117,826 108 $50,656 1 $278,010 106 $80,489 55 $50,771 APPLICATIONS APPROVED, NOT ACCEPTED 12 $109,392 33 $90,412 29 $119,382 3 $53,683 0 $0 8 $130,525 22 $50,946 APPLICATIONS DENIED 33 $111,760 90 $95,447 107 $117,825 40 $29,388 0 $0 15 $89,177 54 $65,904 APPLICATIONS WITHDRAWN 17 $124,336 22 $106,313 76 $111,121 7 $31,744 1 $345,350 6 $65,172 9 $90,812 FILES CLOSED FOR INCOMPLETENESS 10 $125,386 2 $137,825 17 $146,538 4 $26,115 0 $0 2 $122,440 2 $56,430
Aggregated Statistics For Year 2008(Based on 1 full and 12 partial tracts) A) FHA, FSA/RHS & VA B) Conventional C) Refinancings D) Home Improvement Loans E) Loans on Dwellings For 5+ Families F) Non-occupant Loans on G) Loans On Manufactured Number Average Value Number Average Value Number Average Value Number Average Value Number Average Value Number Average Value Number Average Value
LOANS ORIGINATED 125 $112,144 344 $103,630 244 $114,201 108 $41,791 1 $557,510 112 $79,367 82 $52,340 APPLICATIONS APPROVED, NOT ACCEPTED 6 $93,477 40 $95,553 21 $102,064 16 $36,888 0 $0 2 $34,025 32 $61,495 APPLICATIONS DENIED 19 $107,034 102 $78,278 165 $106,528 66 $29,766 0 $0 9 $34,181 78 $48,966 APPLICATIONS WITHDRAWN 7 $119,103 28 $136,001 55 $115,587 7 $61,841 0 $0 4 $48,130 5 $39,642 FILES CLOSED FOR INCOMPLETENESS 7 $142,683 8 $139,796 13 $154,710 1 $4,050 0 $0 2 $62,135 0 $0
Aggregated Statistics For Year 2007(Based on 1 full and 12 partial tracts) A) FHA, FSA/RHS & VA B) Conventional C) Refinancings D) Home Improvement Loans E) Loans on Dwellings For 5+ Families F) Non-occupant Loans on G) Loans On Manufactured Number Average Value Number Average Value Number Average Value Number Average Value Number Average Value Number Average Value Number Average Value
LOANS ORIGINATED 67 $110,759 402 $96,916 260 $99,198 111 $36,856 1 $605,800 92 $69,532 85 $56,554 APPLICATIONS APPROVED, NOT ACCEPTED 4 $89,048 60 $96,403 42 $103,698 15 $38,921 0 $0 4 $100,530 28 $55,903 APPLICATIONS DENIED 11 $108,780 190 $83,389 190 $100,128 115 $44,525 0 $0 12 $91,500 79 $51,594 APPLICATIONS WITHDRAWN 12 $83,424 37 $105,594 119 $102,682 15 $37,081 0 $0 15 $81,807 9 $51,639 FILES CLOSED FOR INCOMPLETENESS 0 $0 7 $97,524 48 $117,199 0 $0 0 $0 2 $116,040 0 $0
Aggregated Statistics For Year 2006(Based on 1 full and 12 partial tracts) A) FHA, FSA/RHS & VA B) Conventional C) Refinancings D) Home Improvement Loans E) Loans on Dwellings For 5+ Families F) Non-occupant Loans on G) Loans On Manufactured Number Average Value Number Average Value Number Average Value Number Average Value Number Average Value Number Average Value Number Average Value
LOANS ORIGINATED 63 $100,587 561 $86,743 237 $88,241 103 $34,431 3 $394,197 103 $59,937 90 $54,952 APPLICATIONS APPROVED, NOT ACCEPTED 4 $67,108 86 $78,821 32 $97,454 10 $33,370 0 $0 8 $125,221 46 $49,871 APPLICATIONS DENIED 11 $66,325 227 $64,037 247 $105,817 81 $26,021 0 $0 19 $50,616 106 $46,263 APPLICATIONS WITHDRAWN 8 $109,986 58 $78,769 155 $92,719 11 $51,320 0 $0 5 $82,140 5 $38,960 FILES CLOSED FOR INCOMPLETENESS 4 $71,460 12 $97,046 60 $105,290 1 $15,450 0 $0 1 $237,850 0 $0
Aggregated Statistics For Year 2005(Based on 1 full and 12 partial tracts) A) FHA, FSA/RHS & VA B) Conventional C) Refinancings D) Home Improvement Loans E) Loans on Dwellings For 5+ Families F) Non-occupant Loans on G) Loans On Manufactured Number Average Value Number Average Value Number Average Value Number Average Value Number Average Value Number Average Value Number Average Value
LOANS ORIGINATED 59 $91,562 511 $78,448 278 $82,197 142 $33,011 0 $0 106 $68,416 92 $41,602 APPLICATIONS APPROVED, NOT ACCEPTED 2 $53,920 89 $57,731 56 $77,964 12 $35,680 0 $0 5 $61,056 63 $44,966 APPLICATIONS DENIED 10 $50,759 228 $54,263 279 $76,536 102 $38,851 0 $0 22 $58,944 144 $44,428 APPLICATIONS WITHDRAWN 7 $77,049 59 $116,799 202 $100,449 33 $122,885 1 $115,720 12 $199,857 7 $55,946 FILES CLOSED FOR INCOMPLETENESS 1 $46,870 15 $108,383 71 $98,974 2 $486,240 0 $0 4 $58,432 2 $43,225
Aggregated Statistics For Year 2004(Based on 1 full and 12 partial tracts) A) FHA, FSA/RHS & VA B) Conventional C) Refinancings D) Home Improvement Loans E) Loans on Dwellings For 5+ Families F) Non-occupant Loans on G) Loans On Manufactured Number Average Value Number Average Value Number Average Value Number Average Value Number Average Value Number Average Value Number Average Value
LOANS ORIGINATED 56 $68,952 460 $71,422 358 $81,694 129 $36,152 1 $115,720 110 $46,002 81 $42,859 APPLICATIONS APPROVED, NOT ACCEPTED 5 $65,386 67 $54,508 58 $95,513 5 $26,850 2 $162,090 10 $47,640 45 $42,593 APPLICATIONS DENIED 9 $88,116 231 $53,053 289 $76,419 92 $28,214 0 $0 24 $48,021 140 $47,354 APPLICATIONS WITHDRAWN 6 $72,028 59 $83,118 173 $78,989 17 $57,167 0 $0 11 $47,514 3 $61,737 FILES CLOSED FOR INCOMPLETENESS 2 $40,075 13 $80,668 71 $98,577 2 $47,445 0 $0 4 $105,035 2 $27,015
Aggregated Statistics For Year 2003(Based on 1 full and 12 partial tracts) A) FHA, FSA/RHS & VA B) Conventional C) Refinancings D) Home Improvement Loans F) Non-occupant Loans on Number Average Value Number Average Value Number Average Value Number Average Value Number Average Value
LOANS ORIGINATED 50 $82,436 381 $68,272 451 $76,712 111 $29,135 83 $49,599 APPLICATIONS APPROVED, NOT ACCEPTED 2 $73,350 53 $53,857 62 $78,133 16 $31,464 10 $62,912 APPLICATIONS DENIED 14 $94,763 173 $50,789 302 $65,974 65 $20,315 16 $52,416 APPLICATIONS WITHDRAWN 11 $69,454 45 $91,509 149 $78,669 11 $59,247 8 $41,249 FILES CLOSED FOR INCOMPLETENESS 1 $68,000 21 $75,629 17 $89,439 4 $42,552 6 $44,315
Aggregated Statistics For Year 2002(Based on 1 full and 10 partial tracts) A) FHA, FSA/RHS & VA B) Conventional C) Refinancings D) Home Improvement Loans E) Loans on Dwellings For 5+ Families F) Non-occupant Loans on Number Average Value Number Average Value Number Average Value Number Average Value Number Average Value Number Average Value
LOANS ORIGINATED 32 $85,647 254 $69,196 221 $71,370 130 $28,067 1 $169,280 36 $45,797 APPLICATIONS APPROVED, NOT ACCEPTED 1 $68,650 37 $51,502 40 $62,489 5 $25,064 0 $0 7 $59,203 APPLICATIONS DENIED 5 $80,636 120 $43,602 128 $57,639 17 $33,071 0 $0 13 $37,924 APPLICATIONS WITHDRAWN 4 $75,418 33 $91,661 99 $74,093 5 $33,390 0 $0 6 $52,080 FILES CLOSED FOR INCOMPLETENESS 2 $82,845 13 $63,133 19 $67,243 1 $14,460 0 $0 1 $101,830
Aggregated Statistics For Year 2001(Based on 1 full and 10 partial tracts) A) FHA, FSA/RHS & VA B) Conventional C) Refinancings D) Home Improvement Loans E) Loans on Dwellings For 5+ Families F) Non-occupant Loans on Number Average Value Number Average Value Number Average Value Number Average Value Number Average Value Number Average Value
LOANS ORIGINATED 30 $64,325 328 $55,499 161 $70,580 106 $22,091 0 $0 48 $50,555 APPLICATIONS APPROVED, NOT ACCEPTED 3 $52,153 85 $44,103 35 $52,346 4 $21,442 1 $271,830 10 $37,047 APPLICATIONS DENIED 3 $68,393 210 $43,731 113 $56,751 28 $14,350 1 $144,000 21 $46,379 APPLICATIONS WITHDRAWN 5 $62,216 31 $81,977 69 $53,774 12 $19,728 0 $0 6 $47,443 FILES CLOSED FOR INCOMPLETENESS 2 $55,830 5 $53,642 10 $74,034 1 $3,710 0 $0 1 $32,400
Aggregated Statistics For Year 2000(Based on 1 full and 10 partial tracts) A) FHA, FSA/RHS & VA B) Conventional C) Refinancings D) Home Improvement Loans E) Loans on Dwellings For 5+ Families F) Non-occupant Loans on Number Average Value Number Average Value Number Average Value Number Average Value Number Average Value Number Average Value
LOANS ORIGINATED 30 $67,045 336 $52,997 90 $141,627 79 $20,504 3 $54,073 44 $44,192 APPLICATIONS APPROVED, NOT ACCEPTED 9 $43,428 83 $43,416 18 $58,359 13 $14,875 0 $0 5 $55,704 APPLICATIONS DENIED 11 $48,325 475 $53,536 80 $54,543 49 $12,859 0 $0 14 $42,566 APPLICATIONS WITHDRAWN 2 $46,715 180 $138,456 56 $69,907 6 $43,553 0 $0 5 $36,516 FILES CLOSED FOR INCOMPLETENESS 0 $0 7 $47,833 9 $48,313 0 $0 0 $0 2 $36,020
Aggregated Statistics For Year 1999(Based on 1 full and 6 partial tracts) A) FHA, FSA/RHS & VA B) Conventional C) Refinancings D) Home Improvement Loans E) Loans on Dwellings For 5+ Families F) Non-occupant Loans on Number Average Value Number Average Value Number Average Value Number Average Value Number Average Value Number Average Value
LOANS ORIGINATED 14 $63,848 242 $54,560 86 $59,064 71 $15,911 1 $225,000 32 $41,815 APPLICATIONS APPROVED, NOT ACCEPTED 0 $0 101 $40,905 29 $47,974 10 $18,957 0 $0 7 $39,826 APPLICATIONS DENIED 4 $60,180 427 $49,978 71 $57,728 45 $15,588 0 $0 25 $46,781 APPLICATIONS WITHDRAWN 4 $65,592 71 $125,135 54 $63,155 8 $24,519 0 $0 5 $43,438 FILES CLOSED FOR INCOMPLETENESS 0 $0 6 $63,228 14 $54,311 0 $0 0 $0 1 $47,000
Private Mortgage Insurance Companies Aggregated Statistics For Year 2009(Based on 1 full and 10 partial tracts) A) Conventional B) Refinancings Number Average Value Number Average Value
LOANS ORIGINATED 9 $147,699 9 $220,089 APPLICATIONS APPROVED, NOT ACCEPTED 6 $230,382 1 $98,360 APPLICATIONS DENIED 2 $182,800 3 $99,667 APPLICATIONS WITHDRAWN 1 $98,360 2 $327,980 FILES CLOSED FOR INCOMPLETENESS 0 $0 2 $198,550
Aggregated Statistics For Year 2008(Based on 1 full and 12 partial tracts) A) Conventional B) Refinancings C) Non-occupant Loans on Number Average Value Number Average Value Number Average Value
LOANS ORIGINATED 49 $146,438 14 $124,570 7 $100,513 APPLICATIONS APPROVED, NOT ACCEPTED 24 $134,456 9 $155,726 3 $70,727 APPLICATIONS DENIED 1 $178,210 3 $216,110 1 $78,690 APPLICATIONS WITHDRAWN 2 $123,425 0 $0 0 $0 FILES CLOSED FOR INCOMPLETENESS 0 $0 0 $0 0 $0
Aggregated Statistics For Year 2007(Based on 1 full and 12 partial tracts) A) Conventional B) Refinancings C) Non-occupant Loans on D) Loans On Manufactured Number Average Value Number Average Value Number Average Value Number Average Value
LOANS ORIGINATED 96 $111,006 17 $165,961 4 $124,050 2 $62,135 APPLICATIONS APPROVED, NOT ACCEPTED 25 $106,536 7 $97,987 1 $246,750 0 $0 APPLICATIONS DENIED 1 $39,540 0 $0 0 $0 0 $0 APPLICATIONS WITHDRAWN 11 $123,064 2 $158,490 0 $0 2 $62,135 FILES CLOSED FOR INCOMPLETENESS 1 $85,000 0 $0 0 $0 0 $0
Aggregated Statistics For Year 2006(Based on 1 full and 12 partial tracts) A) Conventional B) Refinancings C) Non-occupant Loans on D) Loans On Manufactured Number Average Value Number Average Value Number Average Value Number Average Value
LOANS ORIGINATED 61 $110,291 14 $156,817 2 $46,535 2 $40,520 APPLICATIONS APPROVED, NOT ACCEPTED 24 $154,262 7 $153,219 2 $130,805 0 $0 APPLICATIONS DENIED 2 $84,660 0 $0 0 $0 0 $0 APPLICATIONS WITHDRAWN 6 $133,672 0 $0 0 $0 0 $0 FILES CLOSED FOR INCOMPLETENESS 0 $0 0 $0 0 $0 0 $0
Aggregated Statistics For Year 2005(Based on 1 full and 12 partial tracts) A) Conventional B) Refinancings C) Non-occupant Loans on D) Loans On Manufactured Number Average Value Number Average Value Number Average Value Number Average Value
LOANS ORIGINATED 68 $89,633 14 $132,601 5 $45,304 2 $54,930 APPLICATIONS APPROVED, NOT ACCEPTED 11 $88,838 7 $141,981 1 $81,000 0 $0 APPLICATIONS DENIED 4 $92,300 0 $0 0 $0 2 $43,225 APPLICATIONS WITHDRAWN 3 $90,477 1 $42,010 2 $40,525 0 $0 FILES CLOSED FOR INCOMPLETENESS 6 $154,245 0 $0 0 $0 0 $0
Aggregated Statistics For Year 2004(Based on 1 full and 12 partial tracts) A) Conventional B) Refinancings C) Non-occupant Loans on D) Loans On Manufactured Number Average Value Number Average Value Number Average Value Number Average Value
LOANS ORIGINATED 46 $87,250 27 $127,182 5 $76,352 2 $56,730 APPLICATIONS APPROVED, NOT ACCEPTED 14 $97,447 6 $68,053 2 $45,365 0 $0 APPLICATIONS DENIED 4 $52,548 0 $0 0 $0 2 $36,470 APPLICATIONS WITHDRAWN 1 $29,040 0 $0 1 $29,040 0 $0 FILES CLOSED FOR INCOMPLETENESS 2 $51,330 0 $0 0 $0 0 $0
Aggregated Statistics For Year 2003(Based on 1 full and 12 partial tracts) A) Conventional B) Refinancings C) Non-occupant Loans on Number Average Value Number Average Value Number Average Value
LOANS ORIGINATED 62 $89,757 51 $99,937 6 $92,287 APPLICATIONS APPROVED, NOT ACCEPTED 22 $90,975 20 $115,742 1 $65,960 APPLICATIONS DENIED 1 $137,710 1 $140,860 1 $137,710 APPLICATIONS WITHDRAWN 3 $93,187 3 $107,390 0 $0 FILES CLOSED FOR INCOMPLETENESS 0 $0 0 $0 0 $0
Aggregated Statistics For Year 2002(Based on 1 full and 10 partial tracts) A) Conventional B) Refinancings C) Non-occupant Loans on Number Average Value Number Average Value Number Average Value
LOANS ORIGINATED 31 $69,667 11 $96,845 2 $34,490 APPLICATIONS APPROVED, NOT ACCEPTED 1 $111,250 8 $97,155 0 $0 APPLICATIONS DENIED 1 $60,540 2 $115,685 0 $0 APPLICATIONS WITHDRAWN 2 $128,500 1 $47,570 0 $0 FILES CLOSED FOR INCOMPLETENESS 1 $31,000 1 $30,670 0 $0
Aggregated Statistics For Year 2001(Based on 1 full and 8 partial tracts) A) Conventional B) Refinancings C) Non-occupant Loans on Number Average Value Number Average Value Number Average Value
LOANS ORIGINATED 33 $72,397 10 $92,584 2 $52,365 APPLICATIONS APPROVED, NOT ACCEPTED 7 $65,850 4 $71,098 0 $0 APPLICATIONS DENIED 2 $91,500 0 $0 0 $0 APPLICATIONS WITHDRAWN 0 $0 1 $95,140 0 $0 FILES CLOSED FOR INCOMPLETENESS 0 $0 0 $0 0 $0
Aggregated Statistics For Year 2000(Based on 1 full and 10 partial tracts) A) Conventional B) Refinancings C) Non-occupant Loans on Number Average Value Number Average Value Number Average Value
LOANS ORIGINATED 37 $74,223 8 $90,422 3 $48,573 APPLICATIONS APPROVED, NOT ACCEPTED 3 $72,260 3 $309,600 0 $0 APPLICATIONS DENIED 1 $36,000 0 $0 0 $0 APPLICATIONS WITHDRAWN 1 $19,150 1 $114,000 0 $0 FILES CLOSED FOR INCOMPLETENESS 0 $0 0 $0 0 $0
Aggregated Statistics For Year 1999(Based on 1 full and 5 partial tracts) A) Conventional B) Refinancings C) Non-occupant Loans on Number Average Value Number Average Value Number Average Value
LOANS ORIGINATED 39 $73,829 8 $86,978 3 $55,703 APPLICATIONS APPROVED, NOT ACCEPTED 1 $23,420 0 $0 0 $0 APPLICATIONS DENIED 3 $59,190 1 $76,560 0 $0 APPLICATIONS WITHDRAWN 1 $193,340 0 $0 1 $178,560 FILES CLOSED FOR INCOMPLETENESS 2 $51,835 0 $0 0 $0
2002 - 2018 National Fire Incident Reporting System (NFIRS) incidents See full 2006 National Fire Incident Reporting System statistics for zip code 75644, Texas
Most common first names in zip code 75644 among deceased individuals Name Count Lived (average)
James 179 75.2 years William 142 75.1 years John 130 76.3 years Mary 107 80.4 years Robert 80 75.9 years Willie 65 78.2 years George 54 78.3 years Charles 49 69.3 years Henry 47 77.1 years Ruby 45 79.9 years
Most common last names in zip code 75644 among deceased individuals Last name Count Lived (average)
Jones 110 72.1 years Smith 103 77.4 years Johnson 102 75.1 years Davis 81 78.0 years Williams 51 77.4 years Moore 41 72.7 years Green 39 76.1 years Hill 37 81.1 years Morris 36 77.2 years White 33 74.8 years
Businesses in zip code 75644
Name Count Name Count
AutoZone 1 Nike 1 Chevrolet 1 Pizza Hut 1 Curves 1 SONIC Drive-In 1 FedEx 2 Subway 1 H&R Block 1 Taco Bell 1 Jack In The Box 1 U-Haul 2 Jones New York 1 UPS 2 KFC 1 Walmart 1 McDonald's 1


 Nearest zip codes: 75645, 75755, 75686, 75451, 75683, 75765.
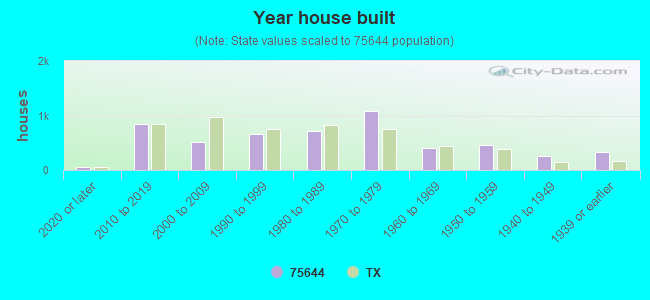

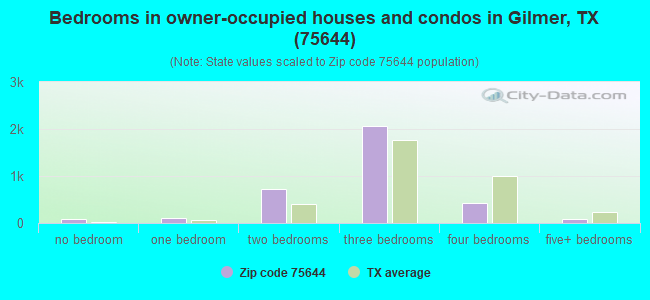
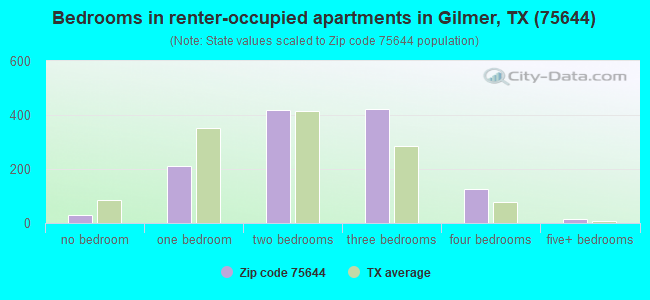
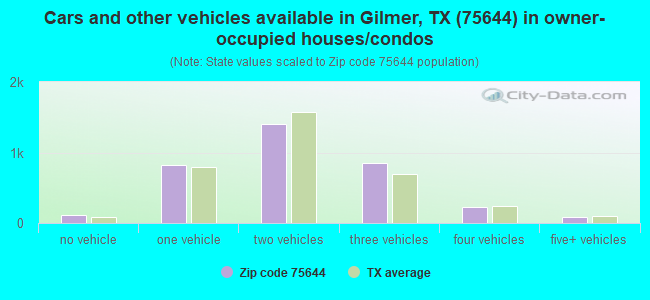
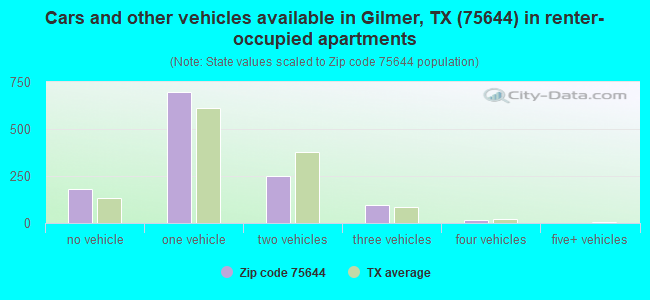


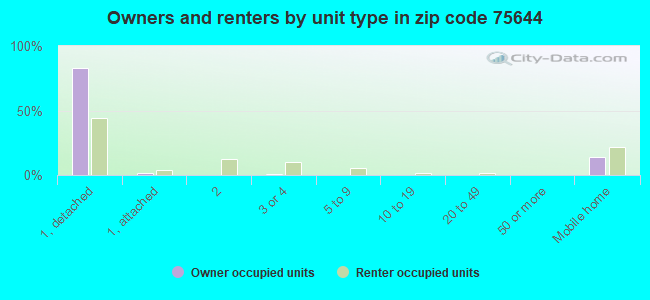
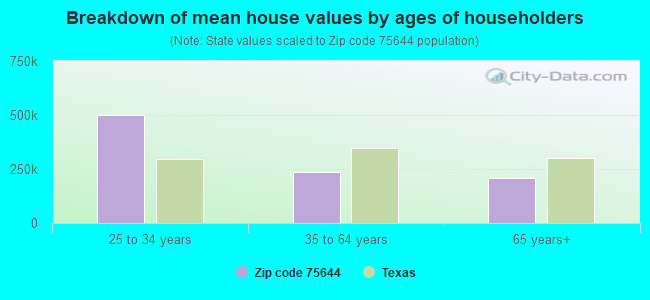


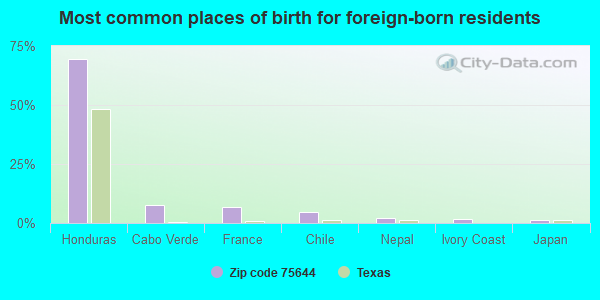
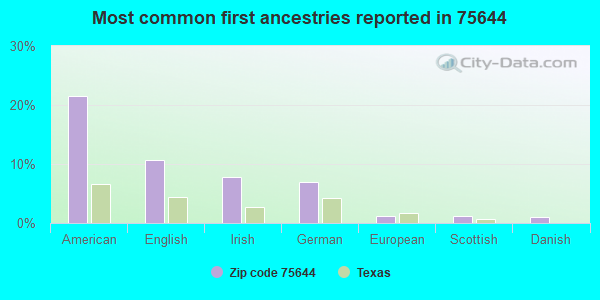
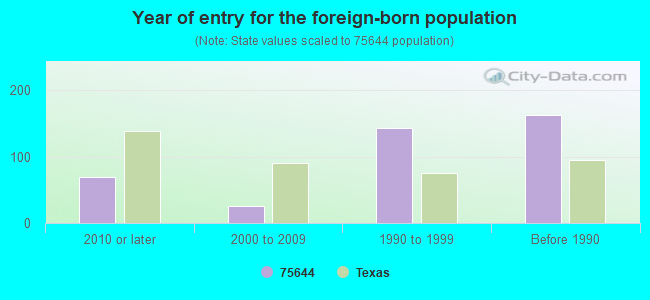
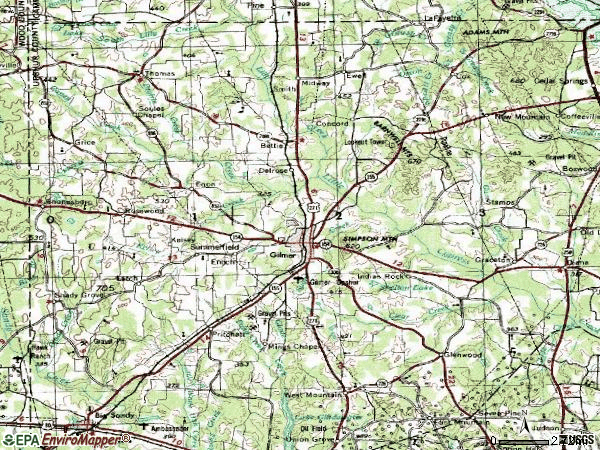


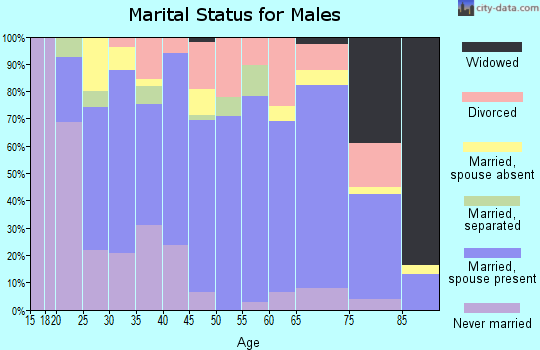
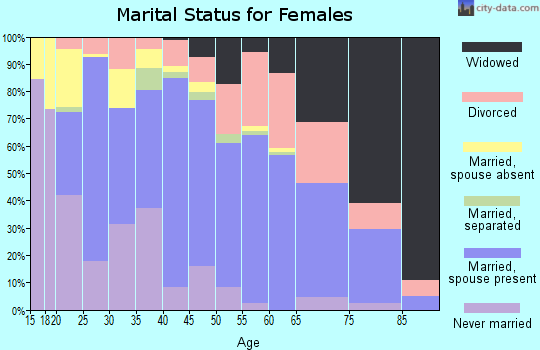
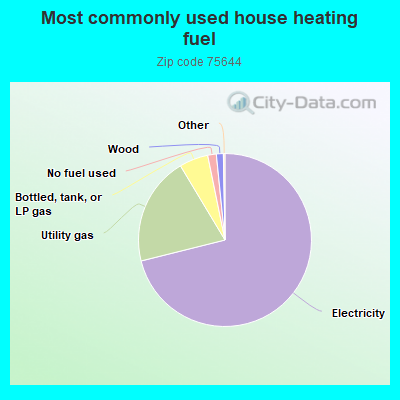
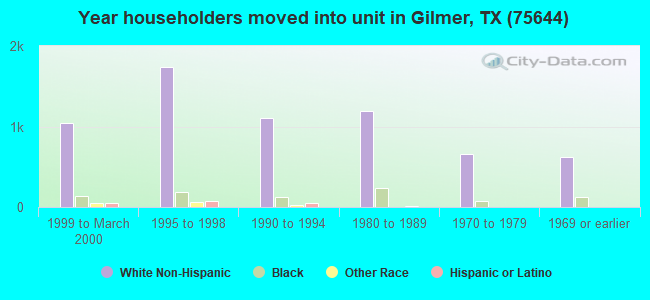
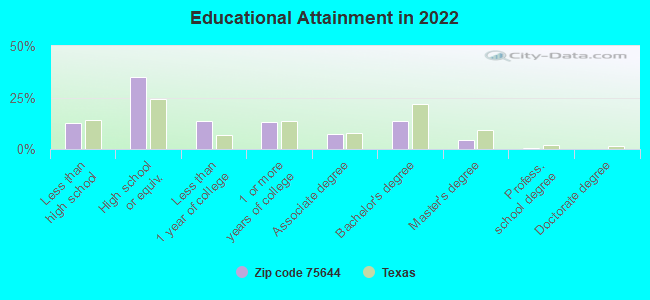
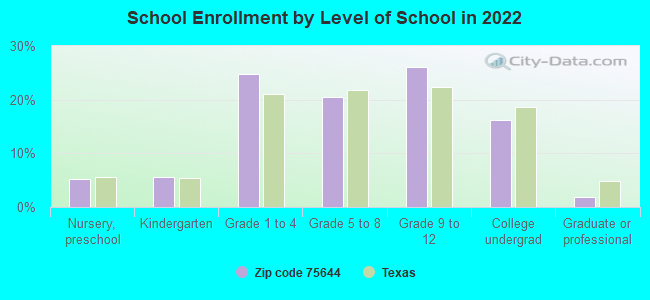
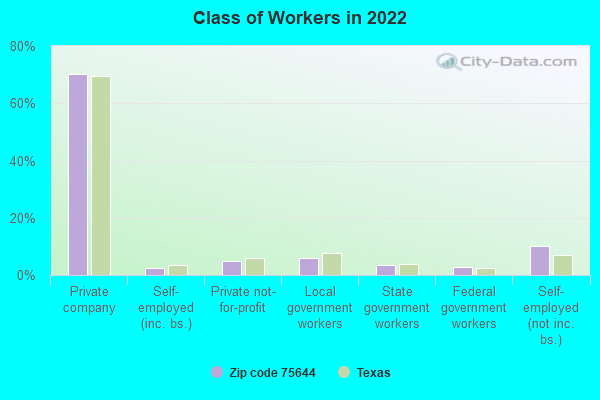
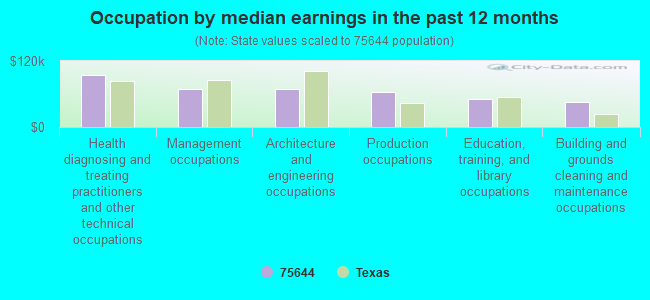
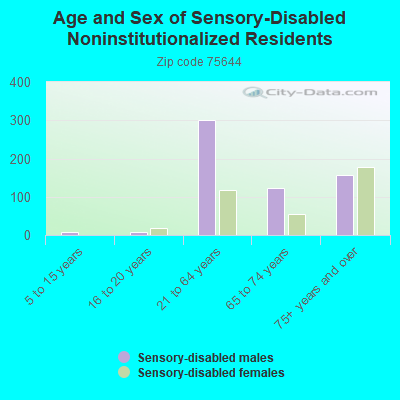
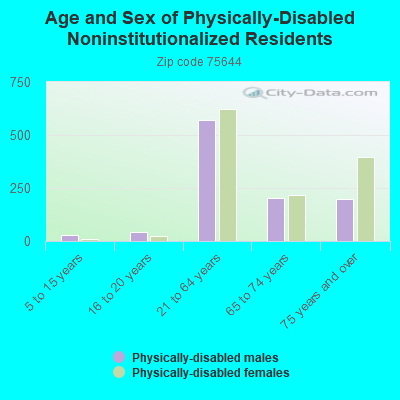
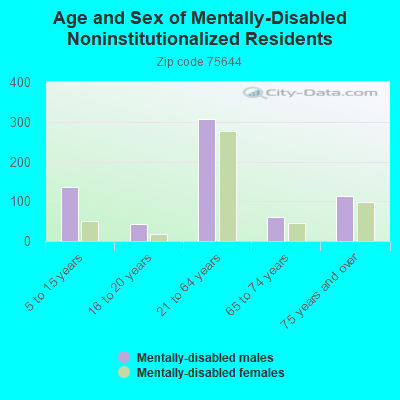
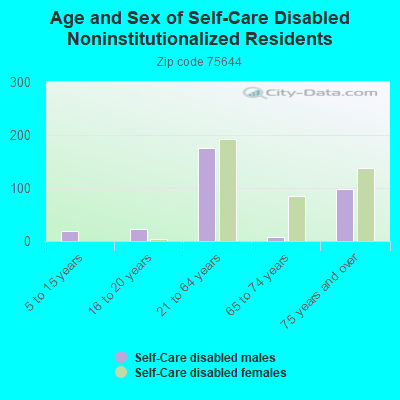
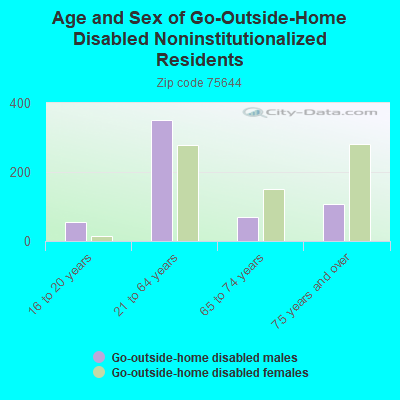
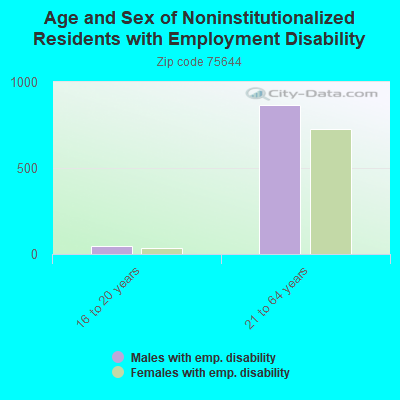
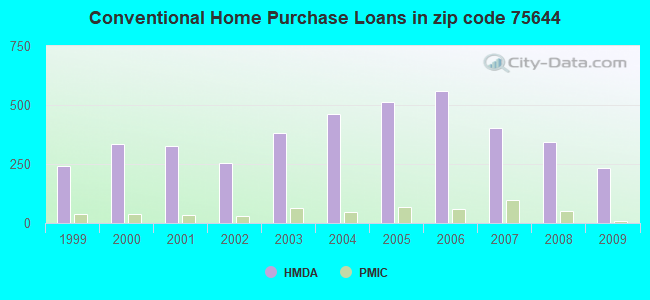
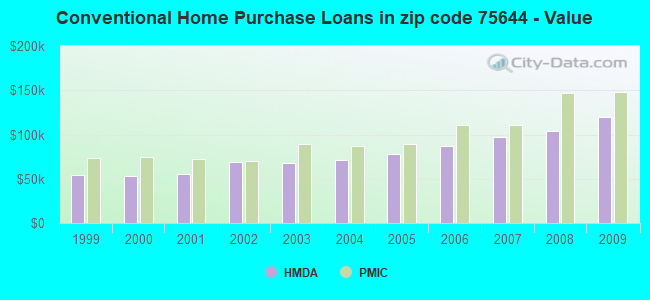
 Based on the data from the years 2002 - 2018 the average number of fires per year is 203. The highest number of fire incidents - 290 took place in 2011, and the least - 138 in 2009. The data has a growing trend.
 When looking into fire subcategories, the most reports belonged to: Outside Fires (62.6%), and Structure Fires (26.1%).