Estimated zip code population in 2022: 3,379 Zip code population in 2010: 3,937 Zip code population in 2000: 3,216
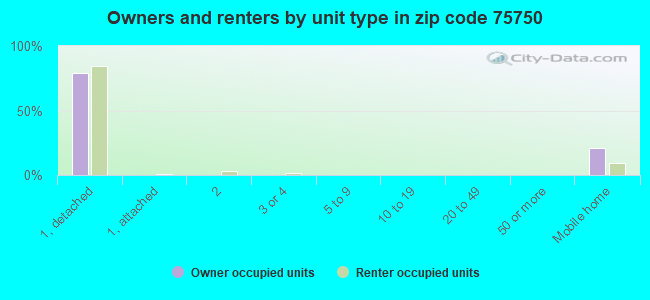
Houses and condos: 1,466 Renter-occupied apartments: 317
% of renters here:
24%
State:
38%
March 2022 cost of living index in zip code 75750: 79.2 (low, U.S. average is 100)
Land area: 46.8 sq. mi. Water area: 1.6 sq. mi.
Population density: 72 people per square mile
(very low).
OSM Map
General Map
Google Map
MSN Map
OSM Map
General Map
Google Map
MSN Map
OSM Map
General Map
Google Map
MSN Map
OSM Map
General Map
Google Map
MSN Map
Please wait while loading the map...
Real estate property taxes paid for housing units in 2022:
This zip code:
0.9% ($1,378)
Texas:
1.5% ($4,050)
Median real estate property taxes paid for housing units with mortgages in 2022: $2,218 (0.9%) Median real estate property taxes paid for housing units with no mortgage in 2022: $828 (0.7%)
Averages for the 2020 tax year for zip code 75750, filed in 2021:
Average Adjusted Gross Income (AGI) in 2020: $58,539 (Individual Income Tax Returns)
Here:
$58,539
State:
$77,054
Salary/wage: $52,777 (reported on 81.0% of returns)
Here:
$52,777
State:
$62,766
(% of AGI for various income ranges: 1165.4% for AGIs below $25k, 3427.2% for AGIs $25k-50k, 6391.4% for AGIs $50k-75k, 9348.5% for AGIs $75k-100k, 15071.7% for AGIs $100k-200k, 59860.0% for AGIs over 200k)
Taxable interest for individuals: $1,061 (reported on 25.3% of returns)
This zip code:
$1,061
Texas:
$2,665
(% of AGI for various income ranges: 18.0% for AGIs below $25k, 20.5% for AGIs $25k-50k, 50.0% for AGIs $50k-75k, 20.8% for AGIs $75k-100k, 55.0% for AGIs $100k-200k, 550.0% for AGIs over 200k)
Ordinary dividends: $4,418 (reported on 12.6% of returns)
Here:
$4,418
State:
$10,044
(% of AGI for various income ranges: 13.7% for AGIs below $25k, 26.2% for AGIs $25k-50k, 38.6% for AGIs $50k-75k, 31.5% for AGIs $75k-100k, 303.3% for AGIs $100k-200k, 1620.0% for AGIs over 200k)
Net capital gain/loss in AGI: +$9,567 (reported on 12.1% of returns)
Here:
+$9,567
State:
+$39,590
(% of AGI for various income ranges: 9.8% for AGIs below $25k, 20.5% for AGIs $25k-50k, 109.1% for AGIs $50k-75k, 76.2% for AGIs $75k-100k, 406.7% for AGIs $100k-200k, 5310.0% for AGIs over 200k)
Profit/loss from business: +$8,680 (reported on 20.1% of returns)
Here:
+$8,680
State:
+$10,888
(% of AGI for various income ranges: 86.3% for AGIs below $25k, 166.2% for AGIs $25k-50k, 229.5% for AGIs $50k-75k, 194.6% for AGIs $75k-100k, 1065.0% for AGIs $100k-200k)
Taxable individual retirement arrangement distribution: $22,553 (reported on 9.8% of returns)
75750:
$22,553
Texas:
$24,740
(% of AGI for various income ranges: 29.5% for AGIs below $25k, 103.6% for AGIs $25k-50k, 230.9% for AGIs $50k-75k, 402.3% for AGIs $75k-100k, 1898.3% for AGIs $100k-200k)
Total itemized deductions: $44,600 (reported on 4.6% of returns)
Here:
$44,600
State:
$40,428
(% of AGI for various income ranges: 615.5% for AGIs $50k-75k, 756.7% for AGIs $100k-200k, 6530.0% for AGIs over 200k)
Charity contributions: $18,357 (reported on 4.0% of returns)
Here:
$18,357
State:
$18,201
(% of AGI for various income ranges: 116.4% for AGIs $50k-75k, 857.5% for AGIs $100k-200k)
Taxes paid: $6,862 (reported on 4.6% of returns)
75750:
$6,862
State:
$7,821
(% of AGI for various income ranges: 93.6% for AGIs $50k-75k, 106.7% for AGIs $100k-200k, 1075.0% for AGIs over 200k)
Earned income credit: $2,341 (reported on 19.5% of returns)
Here:
$2,341
State:
$2,584
(% of AGI for various income ranges: 109.3% for AGIs below $25k, 89.2% for AGIs $25k-50k)
Percentage of individuals using paid preparers for their 2020 taxes: 94.3%
Here:
94%
State:
92%
(% for various income ranges: 92.9% for AGIs below $25k, 93.6% for AGIs $25k-50k, 96.6% for AGIs $50k-75k, 94.4% for AGIs $75k-100k, 94.7% for AGIs $100k-200k, 100.0% for AGIs over 200k)
Averages for the 2012 tax year for zip code 75750, filed in 2013:
Average Adjusted Gross Income (AGI) in 2012: $54,606 (Individual Income Tax Returns)
Here:
$54,606
State:
$65,384
Salary/wage: $47,569 (reported on 85.4% of returns)
Here:
$47,569
State:
$52,524
(% of AGI for various income ranges: 72.3% for AGIs below $25k, 82.7% for AGIs $25k-50k, 81.4% for AGIs $50k-75k, 80.0% for AGIs $75k-100k, 75.5% for AGIs $100k-200k, 51.3% for AGIs over 200k)
Taxable interest for individuals: $1,123 (reported on 27.8% of returns)
This zip code:
$1,123
Texas:
$2,372
(% of AGI for various income ranges: 1.2% for AGIs below $25k, 0.7% for AGIs $25k-50k, 0.4% for AGIs $50k-75k, 0.3% for AGIs $75k-100k, 0.7% for AGIs $100k-200k, 0.4% for AGIs over 200k)
Ordinary dividends: $3,610 (reported on 12.7% of returns)
Here:
$3,610
State:
$9,721
(% of AGI for various income ranges: 4.7% for AGIs below $25k, 0.4% for AGIs $25k-50k, 0.5% for AGIs $50k-75k, 0.3% for AGIs $75k-100k, 0.9% for AGIs $100k-200k)
Net capital gain/loss in AGI: +$11,073 (reported on 9.5% of returns)
Here:
+$11,073
State:
+$35,319
(% of AGI for various income ranges: 0.6% for AGIs below $25k, 0.1% for AGIs $75k-100k, 6.8% for AGIs $100k-200k)
Profit/loss from business: +$11,396 (reported on 17.7% of returns)
Here:
+$11,396
State:
+$13,732
(% of AGI for various income ranges: 6.5% for AGIs below $25k, 2.0% for AGIs $25k-50k, 2.1% for AGIs $50k-75k, 2.0% for AGIs $75k-100k, 7.9% for AGIs $100k-200k)
Taxable individual retirement arrangement distribution: $16,308 (reported on 8.2% of returns)
75750:
$16,308
Texas:
$19,511
(% of AGI for various income ranges: 1.8% for AGIs below $25k, 2.5% for AGIs $25k-50k, 2.0% for AGIs $50k-75k, 2.6% for AGIs $75k-100k, 4.3% for AGIs $100k-200k)
Total itemized deductions: $21,478 (20% of AGI, reported on 22.8% of returns)
Here:
$21,478
State:
$24,724
Here:
20.4% of AGI
State:
15.9% of AGI
(% of AGI for various income ranges: 6.2% for AGIs below $25k, 7.3% for AGIs $25k-50k, 7.7% for AGIs $50k-75k, 10.0% for AGIs $75k-100k, 11.8% for AGIs $100k-200k, 7.6% for AGIs over 200k)
Charity contributions: $7,836 (reported on 15.8% of returns)
Here:
$7,836
State:
$6,808
(% of AGI for various income ranges: 1.6% for AGIs $25k-50k, 1.6% for AGIs $50k-75k, 2.4% for AGIs $75k-100k, 3.3% for AGIs $100k-200k, 3.1% for AGIs over 200k)
Taxes paid: $4,262 (reported on 21.5% of returns)
75750:
$4,262
State:
$6,921
(% of AGI for various income ranges: 0.7% for AGIs below $25k, 1.0% for AGIs $25k-50k, 1.2% for AGIs $50k-75k, 1.6% for AGIs $75k-100k, 2.4% for AGIs $100k-200k, 2.2% for AGIs over 200k)
Earned income credit: $2,325 (reported on 20.3% of returns)
Here:
$2,325
State:
$2,570
(% of AGI for various income ranges: 7.5% for AGIs below $25k, 1.4% for AGIs $25k-50k)
Percentage of individuals using paid preparers for their 2012 taxes: 53.2%
Here:
53%
State:
51%
(% for various income ranges: 46.7% for AGIs below $25k, 52.6% for AGIs $25k-50k, 50.0% for AGIs $50k-75k, 62.5% for AGIs $75k-100k, 64.7% for AGIs $100k-200k, 100.0% for AGIs over 200k)
Averages for the 2004 tax year for zip code 75750, filed in 2005:
Average Adjusted Gross Income (AGI) in 2004: $43,835 (Individual Income Tax Returns)
Here:
$43,835
State:
$47,881
Salary/wage: $38,747 (reported on 85.1% of returns)
Here:
$38,747
State:
$41,947
(% of AGI for various income ranges: 110.4% for AGIs below $10k, 85.7% for AGIs $10k-25k, 79.4% for AGIs $25k-50k, 85.3% for AGIs $50k-75k, 84.2% for AGIs $75k-100k, 56.2% for AGIs over 100k)
Taxable interest for individuals: $1,445 (reported on 34.3% of returns)
This zip code:
$1,445
Texas:
$2,255
(% of AGI for various income ranges: 4.9% for AGIs below $10k, 0.9% for AGIs $10k-25k, 1.3% for AGIs $25k-50k, 0.6% for AGIs $50k-75k, 1.1% for AGIs $75k-100k, 1.3% for AGIs over 100k)
Taxable dividends: $3,807 (reported on 15.6% of returns)
Here:
$3,807
State:
$4,261
(% of AGI for various income ranges: 1.2% for AGIs below $10k, 0.7% for AGIs $10k-25k, 0.6% for AGIs $25k-50k, 0.2% for AGIs $50k-75k, 0.9% for AGIs $75k-100k, 3.1% for AGIs over 100k)
Net capital gain/loss: +$3,610 (reported on 13.7% of returns)
Here:
+$3,610
State:
+$16,110
(% of AGI for various income ranges: -2.9% for AGIs below $10k, -0.2% for AGIs $10k-25k, 0.0% for AGIs $25k-50k, 0.1% for AGIs $50k-75k, 1.7% for AGIs $75k-100k, 3.0% for AGIs over 100k)
Profit/loss from business: +$9,874 (reported on 21.1% of returns)
Here:
+$9,874
State:
+$11,013
(% of AGI for various income ranges: 14.7% for AGIs below $10k, 6.4% for AGIs $10k-25k, 5.3% for AGIs $25k-50k, 1.8% for AGIs $50k-75k, 1.7% for AGIs $75k-100k, 6.9% for AGIs over 100k)
IRA payment deduction: $3,364 (reported on 1.5% of returns)
75750:
$3,364
Texas:
$3,120
Total itemized deductions: $18,546 (22% of AGI, reported on 22.2% of returns)
Here:
$18,546
State:
$19,631
Here:
21.7% of AGI
State:
18.9% of AGI
(% of AGI for various income ranges: 18.3% for AGIs below $10k, 6.2% for AGIs $10k-25k, 7.1% for AGIs $25k-50k, 10.5% for AGIs $50k-75k, 11.5% for AGIs $75k-100k, 9.8% for AGIs over 100k)
Charity contributions deductions: $5,047 (5% of AGI, reported on 18.0% of returns)
Here:
$5,047
State:
$4,753
Here:
5.5% of AGI
State:
4.2% of AGI
(% of AGI for various income ranges: 1.1% for AGIs $10k-25k, 1.6% for AGIs $25k-50k, 2.6% for AGIs $50k-75k, 2.2% for AGIs $75k-100k, 2.4% for AGIs over 100k)
Total tax: $6,810 (reported on 73.4% of returns)
75750:
$6,810
State:
$9,058
(% of AGI for various income ranges: 3.7% for AGIs below $10k, 4.0% for AGIs $10k-25k, 6.2% for AGIs $25k-50k, 8.0% for AGIs $50k-75k, 10.7% for AGIs $75k-100k, 20.4% for AGIs over 100k)
Earned income credit: $1,829 (reported on 20.1% of returns)
Here:
$1,829
State:
$2,024
Percentage of individuals using paid preparers for their 2004 taxes: 60.6%
Here:
61%
State:
57%
(% for various income ranges: 52.4% for AGIs below $10k, 62.9% for AGIs $10k-25k, 60.6% for AGIs $25k-50k, 61.9% for AGIs $50k-75k, 64.0% for AGIs $75k-100k, 67.7% for AGIs over 100k)
Likely homosexual households (counted as self-reported same-sex unmarried-partner households)
Lesbian couples: 0.0% of all households
Gay men: 0.2% of all households
Household received Food Stamps/SNAP in the past 12 months: 192 Household did not receive Food Stamps/SNAP in the past 12 months: 1,134
Women who had a birth in the past 12 months: 1 (1 now married, 0 unmarried) Women who did not have a birth in the past 12 months: 536 (332 now married, 201 unmarried)
Housing units in zip code 75750 with a mortgage: 425 (9 second mortgage, 10 both second mortgage and home equity loan) Median monthly owner costs for units with a mortgage: $1,351 Median monthly owner costs for units without a mortgage: $521
Residents with income below the poverty level in 2022:
This zip code:
10.7%
Whole state:
14.0%
Residents with income below 50% of the poverty level in 2022:
This zip code:
1.8%
Whole state:
7.4%
Median number of rooms in houses and condos:
Here:
6.2
State:
6.3
Median number of rooms in apartments:
Here:
5.3
State:
4.0
Notable locations in this zip code not listed on our city pages
Churches in zip code 75750 include: Sharon Church (A), Shiloh Church (B), Swinneytown Church (C), Hopewell Church (D), Independence Church (E), Mason Church (F), Mount Herman Church (G), New Home Church (H). Display/hide their locations on the map
Size of family households: 496 2-persons, 246 3-persons, 150 4-persons, 42 5-persons, 33 6-persons
Size of nonfamily households: 324 1-person, 23 2-persons, 8 4-persons
350 married couples with children.
156 single-parent households (5 men, 151 women).
99.4% of residents of 75750 zip code speak English at home.
0.6% of residents speak Spanish at home (67% very well, 24% well, 10% not well).
0.3% of residents speak other Indo-European language at home (100% well).
Foreign born population: 11 (0.3%) (100.0% of them are naturalized citizens)
This zip code:
0.3%
Whole state:
17.2%
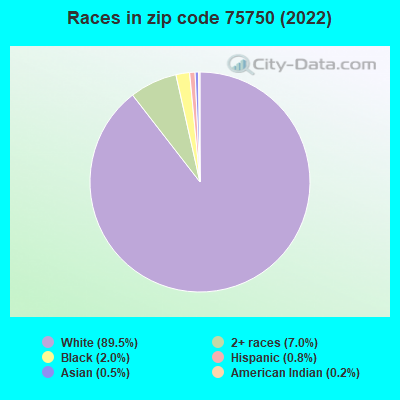
100%Japan
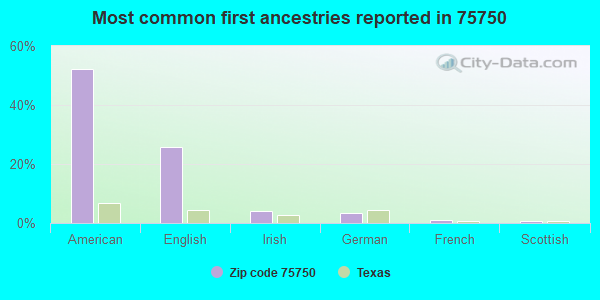
52%American
26%English
4%Irish
3%German
1%French
1%Scottish
0%Welsh
Year of entry for the foreign-born population
02010 or later
02000 to 2009
01990 to 1999
29Before 1990
Facilities with environmental interests located in this zip code:
ARP EL (COUNTY RD 294 (OLD 64) in ARP, TX)
(National Center for Education Statistics) - STATE ID-212901101 Organizations: ARP ISD (SCHOOL DISTRICT)
ARP H S (101 SCHOOL ST in ARP, TX)
(National Center for Education Statistics) - STATE ID-212901001 Organizations: ARP ISD (SCHOOL DISTRICT)
ARP J H (101 SCHOOL ST in ARP, TX)
(National Center for Education Statistics) - STATE ID-212901041 Organizations: ARP ISD (SCHOOL DISTRICT)
ARCO PIPE LINE COMPANY (STATE HIGHWAY 135 2 1\2 MILES in ARP, TX)
(Resource Conservation and Recovery Act (tracking hazardous waste)) Alternative names: ARCO PIPE LINE ARP STATION
ARCO PIPE LINE COMPANY (1.8 MI E HIGHWAY 64 .8 MI E OF in ARP, TX)
(Resource Conservation and Recovery Act (tracking hazardous waste)) Alternative names: BRADFORD STATION
ARP ISD (105 SCHOOL STREET in ARP, TX)
COMPLIANCE ACTIVITY (Tracking inspections of insecticide, fungicide, and rodenticide, and toxic substances) Business SIC classification: ELEMENTARY AND SECONDARY SCHOOLS
BAKER TANK CO/DIV OF JUSTISS OIL CO (HWY 64 E in ARP, TX)
COMPLIANCE ACTIVITY (Tracking inspections of insecticide, fungicide, and rodenticide, and toxic substances) Business SIC classification: FABRICATED PLATE WORK (BOILER SHOPS); OIL AND GAS FIELD MACHINERY AND EQUIPMENT; GENERAL INDUSTRIAL MACHINERY AND EQUIPMENT
Housing units lacking complete plumbing facilities: 6.5% Housing units lacking complete kitchen facilities: 10.3%
70.7%Electricity
20.5%Utility gas
7.6%Bottled, tank, or LP gas
1.4%Wood
Population in 1990: 1,815. Population change in the 1990s: +1,401 (+77.2%).
Place of birth for U.S.-born residents:
This state: 2,348
Northeast: 69
Midwest: 121
South: 614
West: 181
65% of the 75750 zip code residents lived in the same house 5 years ago. Out of people who lived in different houses, 63% lived in this county. Out of people who lived in different counties, 50% lived in Texas.
94% of the 75750 zip code residents lived in the same house 1 year ago. Out of people who lived in different houses, 68% moved from this county. Out of people who lived in different houses, 11% moved from different county within same state. Out of people who lived in different houses, 21% moved from different state.
Private vs. public school enrollment:
Students in private schools in grades 1 to 8 (elementary and middle school): 3
Here:
1.2%
Texas:
8.8%
Students in private schools in grades 9 to 12 (high school):
Here:
0.0%
Texas:
8.0%
Students in private undergraduate colleges:
Here:
0.0%
Texas:
16.2%
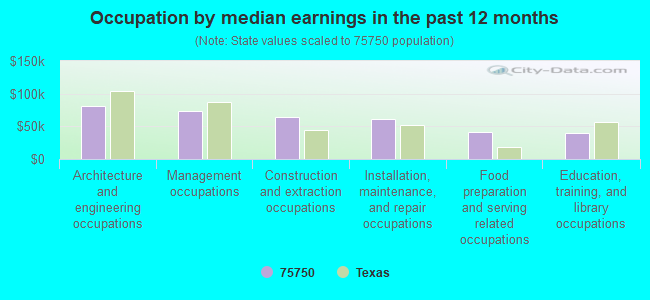
Occupation by median earnings in the past 12 months ($)
81,736Architecture and engineering occupations
72,980Management occupations
64,131Construction and extraction occupations
61,307Installation, maintenance, and repair occupations
41,548Food preparation and serving related occupations
40,515Education, training, and library occupations
Top industries in this zip code by the number of employees in 2005:
Finance and Insurance: Commercial Banking (20-49 employees: 1 establishment)
Construction: Site Preparation Contractors (10-19: 1, 1-4: 2)
Professional, Scientific, and Technical Services: Surveying and Mapping (except Geophysical) Services (10-19: 1, 1-4: 1)
Other Services (except Public Administration): Religious Organizations (5-9: 2, 1-4: 1)
Construction: Highway, Street, and Bridge Construction (10-19: 1)
Other Services (except Public Administration): Other Personal and Household Goods Repair and Maintenance (5-9: 1)
Mining: Support Activities for Oil and Gas Operations (5-9: 1)
Construction: Residential Remodelers (1-4: 2)
Fatal accident statistics in 2014:
Fatal accident count: 2
Vehicles involved in fatal accidents: 2
Fatal accidents caused by drunken drivers: 2
Fatalities: 2
Persons involved in fatal accidents: 2
Pedestrians involved in fatal accidents: 0
Fatal accident statistics in 2013:
Fatal accident count: 1
Vehicles involved in fatal accidents: 1
Fatal accidents caused by drunken drivers: 1
Fatalities: 1
Persons involved in fatal accidents: 1
Pedestrians involved in fatal accidents: 0
Home Mortgage Disclosure Act Aggregated Statistics For Year 2009 (Based on 4 partial tracts)
A) FHA, FSA/RHS & VA Home Purchase Loans
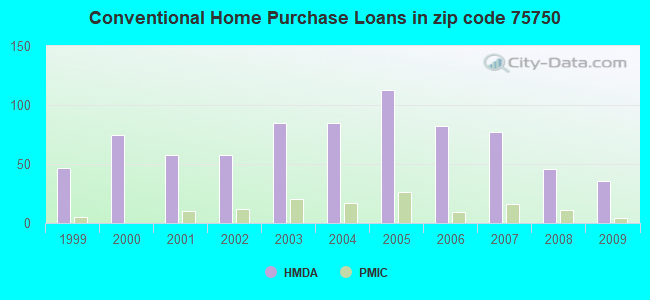
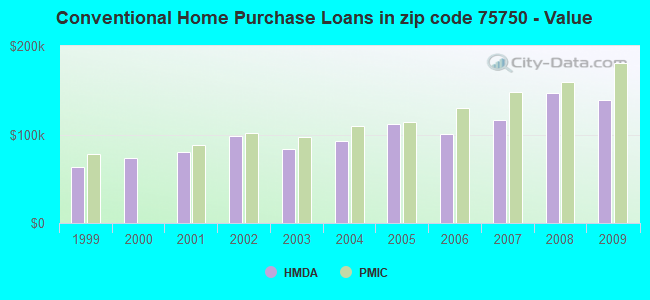
B) Conventional Home Purchase Loans
C) Refinancings
D) Home Improvement Loans
F) Non-occupant Loans on < 5 Family Dwellings (A B C & D)
G) Loans On Manufactured Home Dwelling (A B C & D)
Number
Average Value
Number
Average Value
Number
Average Value
Number
Average Value
Number
Average Value
Number
Average Value
LOANS ORIGINATED
19
$121,823
36
$138,621
65
$170,276
12
$50,864
13
$186,108
9
$65,589
APPLICATIONS APPROVED, NOT ACCEPTED
1
$116,250
7
$129,954
8
$126,962
1
$31,440
1
$205,230
7
$48,590
APPLICATIONS DENIED
3
$100,640
14
$69,089
24
$134,405
10
$60,100
3
$128,557
10
$54,338
APPLICATIONS WITHDRAWN
3
$168,273
6
$180,905
18
$130,907
1
$38,420
2
$123,790
0
$0
FILES CLOSED FOR INCOMPLETENESS
0
$0
1
$134,640
4
$198,795
0
$0
0
$0
1
$34,820
Aggregated Statistics For Year 2008 (Based on 4 partial tracts)
A) FHA, FSA/RHS & VA Home Purchase Loans
B) Conventional Home Purchase Loans
C) Refinancings
D) Home Improvement Loans
F) Non-occupant Loans on < 5 Family Dwellings (A B C & D)
G) Loans On Manufactured Home Dwelling (A B C & D)
Number
Average Value
Number
Average Value
Number
Average Value
Number
Average Value
Number
Average Value
Number
Average Value
LOANS ORIGINATED
14
$111,571
46
$146,538
45
$131,014
24
$54,990
16
$168,741
13
$58,760
APPLICATIONS APPROVED, NOT ACCEPTED
2
$140,640
12
$93,377
5
$109,746
3
$60,350
1
$47,660
11
$56,208
APPLICATIONS DENIED
3
$106,340
25
$80,843
31
$110,767
23
$31,960
4
$78,805
20
$51,168
APPLICATIONS WITHDRAWN
2
$124,680
10
$112,743
17
$142,978
2
$47,785
1
$566,430
2
$38,740
FILES CLOSED FOR INCOMPLETENESS
0
$0
3
$134,820
3
$104,993
2
$75,205
0
$0
1
$31,170
Aggregated Statistics For Year 2007 (Based on 4 partial tracts)
A) FHA, FSA/RHS & VA Home Purchase Loans
B) Conventional Home Purchase Loans
C) Refinancings
D) Home Improvement Loans
F) Non-occupant Loans on < 5 Family Dwellings (A B C & D)
G) Loans On Manufactured Home Dwelling (A B C & D)
Number
Average Value
Number
Average Value
Number
Average Value
Number
Average Value
Number
Average Value
Number
Average Value
LOANS ORIGINATED
13
$88,118
77
$115,906
46
$118,065
26
$38,746
18
$137,588
18
$60,256
APPLICATIONS APPROVED, NOT ACCEPTED
0
$0
17
$72,083
7
$129,071
3
$20,493
2
$38,910
13
$53,283
APPLICATIONS DENIED
1
$216,860
33
$68,626
59
$172,857
28
$37,105
7
$91,553
22
$51,945
APPLICATIONS WITHDRAWN
1
$86,360
9
$86,187
28
$120,864
2
$64,000
3
$94,273
2
$67,375
FILES CLOSED FOR INCOMPLETENESS
0
$0
3
$71,057
11
$123,705
0
$0
0
$0
0
$0
Aggregated Statistics For Year 2006 (Based on 4 partial tracts)
A) FHA, FSA/RHS & VA Home Purchase Loans
B) Conventional Home Purchase Loans
C) Refinancings
D) Home Improvement Loans
F) Non-occupant Loans on < 5 Family Dwellings (A B C & D)
G) Loans On Manufactured Home Dwelling (A B C & D)
Number
Average Value
Number
Average Value
Number
Average Value
Number
Average Value
Number
Average Value
Number
Average Value
LOANS ORIGINATED
15
$121,044
82
$100,077
56
$125,183
20
$39,351
15
$81,417
23
$63,051
APPLICATIONS APPROVED, NOT ACCEPTED
1
$191,360
19
$74,143
10
$85,087
4
$47,505
4
$101,525
10
$46,934
APPLICATIONS DENIED
1
$135,390
49
$65,985
60
$118,841
20
$32,110
5
$87,530
32
$48,862
APPLICATIONS WITHDRAWN
1
$57,410
8
$84,929
42
$93,346
4
$36,690
2
$81,665
4
$51,640
FILES CLOSED FOR INCOMPLETENESS
0
$0
3
$76,077
13
$145,176
0
$0
1
$71,760
0
$0
Aggregated Statistics For Year 2005 (Based on 4 partial tracts)
A) FHA, FSA/RHS & VA Home Purchase Loans
B) Conventional Home Purchase Loans
C) Refinancings
D) Home Improvement Loans
F) Non-occupant Loans on < 5 Family Dwellings (A B C & D)
G) Loans On Manufactured Home Dwelling (A B C & D)
Number
Average Value
Number
Average Value
Number
Average Value
Number
Average Value
Number
Average Value
Number
Average Value
LOANS ORIGINATED
11
$106,968
113
$111,886
65
$119,232
25
$51,711
21
$104,850
18
$53,601
APPLICATIONS APPROVED, NOT ACCEPTED
0
$0
25
$65,119
9
$66,647
3
$23,123
2
$79,570
16
$42,837
APPLICATIONS DENIED
3
$59,363
61
$60,666
71
$84,509
28
$40,560
8
$59,900
50
$43,491
APPLICATIONS WITHDRAWN
2
$74,375
20
$101,113
45
$101,450
6
$153,593
4
$150,918
3
$49,210
FILES CLOSED FOR INCOMPLETENESS
0
$0
1
$34,000
12
$88,667
0
$0
0
$0
0
$0
Aggregated Statistics For Year 2004 (Based on 4 partial tracts)
A) FHA, FSA/RHS & VA Home Purchase Loans
B) Conventional Home Purchase Loans
C) Refinancings
D) Home Improvement Loans
F) Non-occupant Loans on < 5 Family Dwellings (A B C & D)
G) Loans On Manufactured Home Dwelling (A B C & D)
Number
Average Value
Number
Average Value
Number
Average Value
Number
Average Value
Number
Average Value
Number
Average Value
LOANS ORIGINATED
8
$90,914
85
$92,150
79
$104,491
15
$46,129
26
$72,976
25
$49,048
APPLICATIONS APPROVED, NOT ACCEPTED
0
$0
20
$71,248
14
$86,969
3
$42,183
2
$91,615
13
$42,525
APPLICATIONS DENIED
2
$105,120
45
$62,381
72
$76,461
19
$29,675
3
$62,790
28
$43,440
APPLICATIONS WITHDRAWN
0
$0
7
$90,519
39
$95,073
2
$17,390
2
$63,040
2
$67,330
FILES CLOSED FOR INCOMPLETENESS
0
$0
2
$65,250
14
$91,397
0
$0
0
$0
0
$0
Aggregated Statistics For Year 2003 (Based on 4 partial tracts)
A) FHA, FSA/RHS & VA Home Purchase Loans
B) Conventional Home Purchase Loans
C) Refinancings
D) Home Improvement Loans
F) Non-occupant Loans on < 5 Family Dwellings (A B C & D)
Number
Average Value
Number
Average Value
Number
Average Value
Number
Average Value
Number
Average Value
LOANS ORIGINATED
9
$107,387
85
$83,366
125
$106,364
18
$28,818
24
$71,421
APPLICATIONS APPROVED, NOT ACCEPTED
0
$0
11
$47,240
16
$98,257
2
$37,275
0
$0
APPLICATIONS DENIED
0
$0
42
$61,262
67
$79,749
12
$30,312
4
$101,978
APPLICATIONS WITHDRAWN
3
$58,857
7
$139,599
45
$100,990
1
$13,750
2
$82,765
FILES CLOSED FOR INCOMPLETENESS
0
$0
3
$91,040
3
$92,173
0
$0
0
$0
Aggregated Statistics For Year 2002 (Based on 2 partial tracts)
A) FHA, FSA/RHS & VA Home Purchase Loans
B) Conventional Home Purchase Loans
C) Refinancings
D) Home Improvement Loans
F) Non-occupant Loans on < 5 Family Dwellings (A B C & D)
Number
Average Value
Number
Average Value
Number
Average Value
Number
Average Value
Number
Average Value
LOANS ORIGINATED
6
$75,108
58
$98,484
59
$105,637
18
$26,073
16
$102,736
APPLICATIONS APPROVED, NOT ACCEPTED
0
$0
11
$62,496
11
$79,154
4
$40,665
1
$41,620
APPLICATIONS DENIED
1
$107,640
36
$47,348
23
$66,623
8
$9,090
4
$32,890
APPLICATIONS WITHDRAWN
1
$88,980
9
$111,308
18
$79,521
1
$26,310
1
$238,240
FILES CLOSED FOR INCOMPLETENESS
0
$0
0
$0
4
$73,912
0
$0
0
$0
Aggregated Statistics For Year 2001 (Based on 2 partial tracts)
A) FHA, FSA/RHS & VA Home Purchase Loans
B) Conventional Home Purchase Loans
C) Refinancings
D) Home Improvement Loans
F) Non-occupant Loans on < 5 Family Dwellings (A B C & D)
Number
Average Value
Number
Average Value
Number
Average Value
Number
Average Value
Number
Average Value
LOANS ORIGINATED
8
$86,411
58
$80,429
50
$96,378
19
$17,197
11
$66,411
APPLICATIONS APPROVED, NOT ACCEPTED
0
$0
17
$53,271
5
$63,914
2
$40,905
0
$0
APPLICATIONS DENIED
0
$0
43
$40,152
28
$57,391
7
$21,529
3
$47,680
APPLICATIONS WITHDRAWN
1
$81,330
8
$84,378
17
$77,388
3
$8,930
2
$65,780
FILES CLOSED FOR INCOMPLETENESS
0
$0
1
$106,200
2
$81,090
0
$0
0
$0
Aggregated Statistics For Year 2000 (Based on 2 partial tracts)
A) FHA, FSA/RHS & VA Home Purchase Loans
B) Conventional Home Purchase Loans
C) Refinancings
D) Home Improvement Loans
F) Non-occupant Loans on < 5 Family Dwellings (A B C & D)
Number
Average Value
Number
Average Value
Number
Average Value
Number
Average Value
Number
Average Value
LOANS ORIGINATED
6
$78,937
75
$73,514
21
$85,611
19
$18,708
14
$56,178
APPLICATIONS APPROVED, NOT ACCEPTED
1
$24,880
13
$48,208
4
$59,322
4
$18,180
2
$79,895
APPLICATIONS DENIED
1
$69,850
52
$42,348
12
$82,086
9
$13,980
2
$41,140
APPLICATIONS WITHDRAWN
0
$0
7
$73,127
11
$54,929
1
$13,870
1
$23,920
FILES CLOSED FOR INCOMPLETENESS
0
$0
1
$49,750
3
$59,003
0
$0
0
$0
Aggregated Statistics For Year 1999 (Based on 2 partial tracts)
A) FHA, FSA/RHS & VA Home Purchase Loans
B) Conventional Home Purchase Loans
C) Refinancings
D) Home Improvement Loans
F) Non-occupant Loans on < 5 Family Dwellings (A B C & D)
Detailed PMIC statistics for the following Tracts:0018.01
, 0021.00
2003 - 2018 National Fire Incident Reporting System (NFIRS) incidents
According to the data from the years 2003 - 2018 the average number of fires per year is 46. The highest number of fires - 190 took place in 2011, and the least - 4 in 2003. The data has a growing trend.
When looking into fire subcategories, the most incidents belonged to: Outside Fires (53.9%), and Structure Fires (21.9%).
Fire incident types reported to NFIRS in Zip Code 75750


 Nearest zip codes: 75705, 75707, 75684, 75682, 75791, 75789.
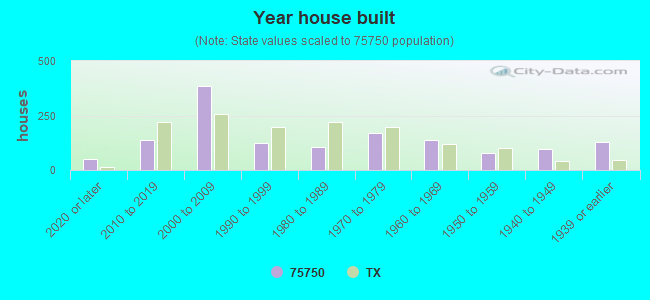


 According to the data from the years 2003 - 2018 the average number of fires per year is 46. The highest number of fires - 190 took place in 2011, and the least - 4 in 2003. The data has a growing trend.
 When looking into fire subcategories, the most incidents belonged to: Outside Fires (53.9%), and Structure Fires (21.9%).