Estimated zip code population in 2022: 42,074 Zip code population in 2010: 29,722 Zip code population in 2000: 11,636
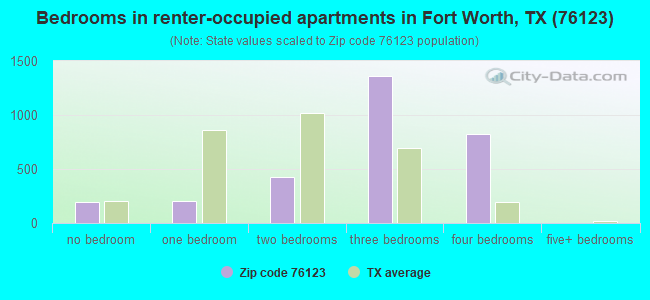
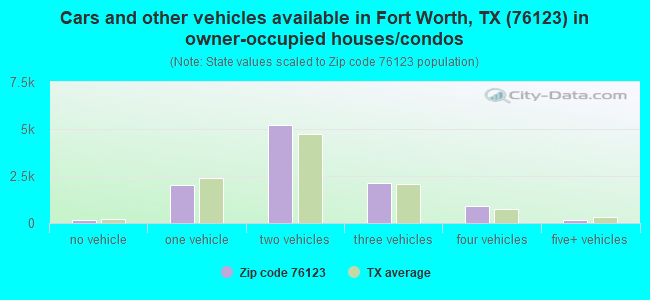
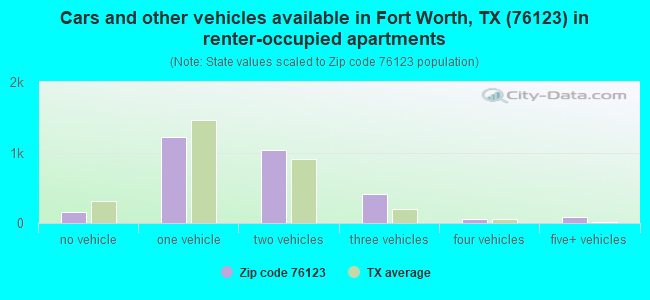
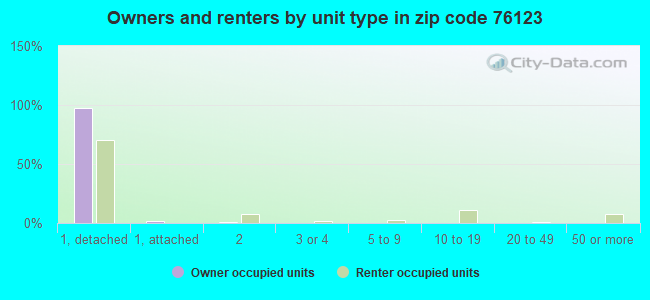
Houses and condos: 13,657 Renter-occupied apartments: 2,983
% of renters here:
22%
State:
38%
March 2022 cost of living index in zip code 76123: 97.0 (near average, U.S. average is 100)
Land area: 8.1 sq. mi. Water area: 0.0 sq. mi.
Population density: 5,198 people per square mile
(average).
OSM Map
General Map
Google Map
MSN Map
OSM Map
General Map
Google Map
MSN Map
OSM Map
General Map
Google Map
MSN Map
OSM Map
General Map
Google Map
MSN Map
Please wait while loading the map...
Real estate property taxes paid for housing units in 2022:
This zip code:
1.8% ($5,087)
Texas:
1.5% ($4,050)
Median real estate property taxes paid for housing units with mortgages in 2022: $5,048 (1.8%) Median real estate property taxes paid for housing units with no mortgage in 2022: $5,579 (1.8%)
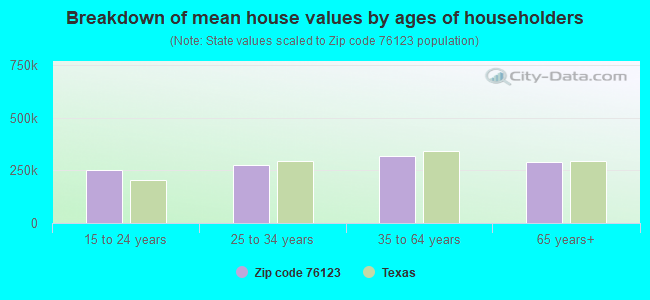
Estimated median house/condo value in 2022: $284,541
76123:
$284,541
Texas:
$275,400
According to our research of Texas and other state lists, there were 76 registered sex offenders living in 76123 zip code as of April 23, 2024. The ratio of all residents to sex offenders in zip code 76123 is 409 to 1. The ratio of registered sex offenders to all residents in this zip code is near the state average.
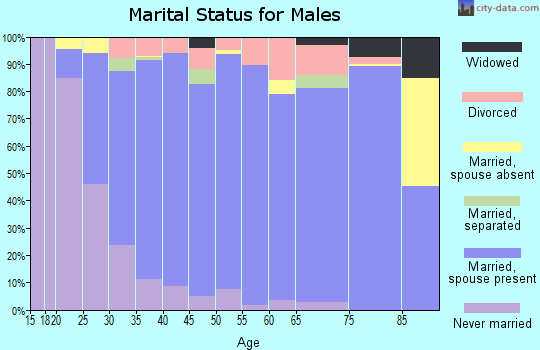
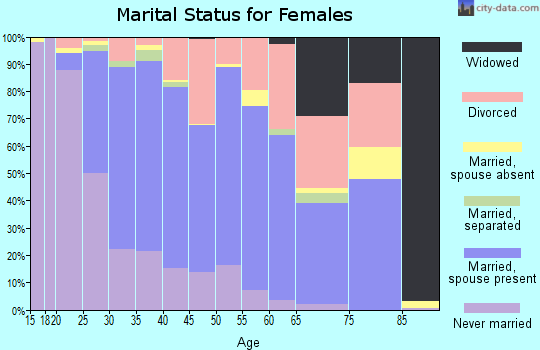
Median resident age:
This zip code:
34.0 years
Texas median age:
35.6 years
Average household size:
This zip code:
3.1 people
Texas:
2.6 people
Averages for the 2020 tax year for zip code 76123, filed in 2021:
Average Adjusted Gross Income (AGI) in 2020: $59,526 (Individual Income Tax Returns)
Here:
$59,526
State:
$77,054
Salary/wage: $54,959 (reported on 87.3% of returns)
Here:
$54,959
State:
$62,766
(% of AGI for various income ranges: 1271.4% for AGIs below $25k, 3692.0% for AGIs $25k-50k, 6834.6% for AGIs $50k-75k, 10179.0% for AGIs $75k-100k, 18281.6% for AGIs $100k-200k, 54791.4% for AGIs over 200k)
Taxable interest for individuals: $815 (reported on 16.1% of returns)
This zip code:
$815
Texas:
$2,665
(% of AGI for various income ranges: 6.1% for AGIs below $25k, 6.4% for AGIs $25k-50k, 12.4% for AGIs $50k-75k, 19.4% for AGIs $75k-100k, 56.6% for AGIs $100k-200k, 238.1% for AGIs over 200k)
Ordinary dividends: $3,595 (reported on 9.6% of returns)
Here:
$3,595
State:
$10,044
(% of AGI for various income ranges: 6.6% for AGIs below $25k, 13.8% for AGIs $25k-50k, 32.7% for AGIs $50k-75k, 48.8% for AGIs $75k-100k, 139.2% for AGIs $100k-200k, 985.2% for AGIs over 200k)
Net capital gain/loss in AGI: +$12,127 (reported on 9.8% of returns)
Here:
+$12,127
State:
+$39,590
(% of AGI for various income ranges: 4.9% for AGIs below $25k, 18.8% for AGIs $25k-50k, 37.0% for AGIs $50k-75k, 72.2% for AGIs $75k-100k, 314.9% for AGIs $100k-200k, 7064.8% for AGIs over 200k)
Profit/loss from business: +$3,472 (reported on 24.2% of returns)
Here:
+$3,472
State:
+$10,888
(% of AGI for various income ranges: 30.5% for AGIs below $25k, 11.0% for AGIs $25k-50k, 66.4% for AGIs $50k-75k, 150.9% for AGIs $75k-100k, 287.1% for AGIs $100k-200k, 2860.5% for AGIs over 200k)
Taxable individual retirement arrangement distribution: $19,466 (reported on 4.8% of returns)
76123:
$19,466
Texas:
$24,740
(% of AGI for various income ranges: 15.8% for AGIs below $25k, 42.8% for AGIs $25k-50k, 96.4% for AGIs $50k-75k, 196.2% for AGIs $75k-100k, 426.6% for AGIs $100k-200k, 1747.1% for AGIs over 200k)
Self-employed (Keogh) retirement plans: $19,167 (reported on 0.2% of returns)
76123:
$19,167
Texas:
$29,298
(% of AGI for various income ranges: 37.3% for AGIs $100k-200k)
Total itemized deductions: $29,405 (reported on 9.8% of returns)
Here:
$29,405
State:
$40,428
(% of AGI for various income ranges: 30.3% for AGIs below $25k, 186.7% for AGIs $25k-50k, 509.0% for AGIs $50k-75k, 695.2% for AGIs $75k-100k, 1057.5% for AGIs $100k-200k, 3686.7% for AGIs over 200k)
Charity contributions: $10,585 (reported on 8.0% of returns)
Here:
$10,585
State:
$18,201
(% of AGI for various income ranges: 4.3% for AGIs below $25k, 39.5% for AGIs $25k-50k, 117.1% for AGIs $50k-75k, 192.2% for AGIs $75k-100k, 385.9% for AGIs $100k-200k, 1396.2% for AGIs over 200k)
Taxes paid: $6,897 (reported on 9.5% of returns)
76123:
$6,897
State:
$7,821
(% of AGI for various income ranges: 6.3% for AGIs below $25k, 42.3% for AGIs $25k-50k, 114.9% for AGIs $50k-75k, 164.2% for AGIs $75k-100k, 253.6% for AGIs $100k-200k, 751.4% for AGIs over 200k)
Earned income credit: $2,680 (reported on 21.6% of returns)
Here:
$2,680
State:
$2,584
(% of AGI for various income ranges: 136.8% for AGIs below $25k, 102.1% for AGIs $25k-50k, 1.9% for AGIs $50k-75k)
Percentage of individuals using paid preparers for their 2020 taxes: 93.4%
Here:
93%
State:
92%
(% for various income ranges: 93.4% for AGIs below $25k, 94.4% for AGIs $25k-50k, 93.5% for AGIs $50k-75k, 92.6% for AGIs $75k-100k, 92.1% for AGIs $100k-200k, 93.0% for AGIs over 200k)
Averages for the 2012 tax year for zip code 76123, filed in 2013:
Average Adjusted Gross Income (AGI) in 2012: $54,821 (Individual Income Tax Returns)
Here:
$54,821
State:
$65,384
Salary/wage: $52,018 (reported on 90.4% of returns)
Here:
$52,018
State:
$52,524
(% of AGI for various income ranges: 86.6% for AGIs below $25k, 90.7% for AGIs $25k-50k, 86.0% for AGIs $50k-75k, 87.8% for AGIs $75k-100k, 86.2% for AGIs $100k-200k, 74.4% for AGIs over 200k)
Taxable interest for individuals: $763 (reported on 20.3% of returns)
This zip code:
$763
Texas:
$2,372
(% of AGI for various income ranges: 0.3% for AGIs below $25k, 0.3% for AGIs $25k-50k, 0.3% for AGIs $50k-75k, 0.2% for AGIs $75k-100k, 0.3% for AGIs $100k-200k, 0.3% for AGIs over 200k)
Ordinary dividends: $3,112 (reported on 11.0% of returns)
Here:
$3,112
State:
$9,721
(% of AGI for various income ranges: 1.2% for AGIs below $25k, 0.5% for AGIs $25k-50k, 0.4% for AGIs $50k-75k, 0.3% for AGIs $75k-100k, 0.7% for AGIs $100k-200k, 1.1% for AGIs over 200k)
Net capital gain/loss in AGI: +$3,473 (reported on 8.5% of returns)
Here:
+$3,473
State:
+$35,319
(% of AGI for various income ranges: 0.3% for AGIs $50k-75k, 0.5% for AGIs $100k-200k, 2.7% for AGIs over 200k)
Profit/loss from business: +$5,405 (reported on 20.7% of returns)
Here:
+$5,405
State:
+$13,732
(% of AGI for various income ranges: 5.9% for AGIs below $25k, 0.2% for AGIs $25k-50k, 1.8% for AGIs $50k-75k, 1.6% for AGIs $75k-100k, 2.3% for AGIs $100k-200k, 2.1% for AGIs over 200k)
Taxable individual retirement arrangement distribution: $14,969 (reported on 5.1% of returns)
76123:
$14,969
Texas:
$19,511
(% of AGI for various income ranges: 0.9% for AGIs below $25k, 1.1% for AGIs $25k-50k, 1.1% for AGIs $50k-75k, 1.2% for AGIs $75k-100k, 1.6% for AGIs $100k-200k, 2.0% for AGIs over 200k)
Self-employment retirement plans: $12,450 (reported on 0.3% of returns)
76123:
$12,450
Texas:
$23,938
Total itemized deductions: $19,609 (22% of AGI, reported on 35.4% of returns)
Here:
$19,609
State:
$24,724
Here:
21.9% of AGI
State:
15.9% of AGI
(% of AGI for various income ranges: 8.2% for AGIs below $25k, 13.5% for AGIs $25k-50k, 16.0% for AGIs $50k-75k, 14.0% for AGIs $75k-100k, 12.8% for AGIs $100k-200k, 7.8% for AGIs over 200k)
Charity contributions: $5,010 (reported on 29.1% of returns)
Here:
$5,010
State:
$6,808
(% of AGI for various income ranges: 1.0% for AGIs below $25k, 2.0% for AGIs $25k-50k, 2.8% for AGIs $50k-75k, 2.9% for AGIs $75k-100k, 3.3% for AGIs $100k-200k, 2.3% for AGIs over 200k)
Taxes paid: $5,211 (reported on 34.6% of returns)
76123:
$5,211
State:
$6,921
(% of AGI for various income ranges: 1.7% for AGIs below $25k, 3.1% for AGIs $25k-50k, 3.7% for AGIs $50k-75k, 3.9% for AGIs $75k-100k, 3.6% for AGIs $100k-200k, 2.5% for AGIs over 200k)
Earned income credit: $2,586 (reported on 23.2% of returns)
Here:
$2,586
State:
$2,570
(% of AGI for various income ranges: 10.0% for AGIs below $25k, 1.7% for AGIs $25k-50k)
Percentage of individuals using paid preparers for their 2012 taxes: 47.5%
Here:
47%
State:
51%
(% for various income ranges: 47.8% for AGIs below $25k, 48.0% for AGIs $25k-50k, 49.8% for AGIs $50k-75k, 43.7% for AGIs $75k-100k, 44.4% for AGIs $100k-200k, 57.1% for AGIs over 200k)
Averages for the 2004 tax year for zip code 76123, filed in 2005:
Average Adjusted Gross Income (AGI) in 2004: $55,329 (Individual Income Tax Returns)
Here:
$55,329
State:
$47,881
Salary/wage: $52,027 (reported on 93.0% of returns)
Here:
$52,027
State:
$41,947
(% of AGI for various income ranges: 120.0% for AGIs below $10k, 94.1% for AGIs $10k-25k, 92.2% for AGIs $25k-50k, 92.0% for AGIs $50k-75k, 92.6% for AGIs $75k-100k, 78.0% for AGIs over 100k)
Taxable interest for individuals: $741 (reported on 36.8% of returns)
This zip code:
$741
Texas:
$2,255
(% of AGI for various income ranges: 3.0% for AGIs below $10k, 1.1% for AGIs $10k-25k, 0.5% for AGIs $25k-50k, 0.5% for AGIs $50k-75k, 0.5% for AGIs $75k-100k, 0.4% for AGIs over 100k)
Taxable dividends: $1,236 (reported on 18.3% of returns)
Here:
$1,236
State:
$4,261
(% of AGI for various income ranges: 1.6% for AGIs below $10k, 0.6% for AGIs $10k-25k, 0.4% for AGIs $25k-50k, 0.3% for AGIs $50k-75k, 0.3% for AGIs $75k-100k, 0.5% for AGIs over 100k)
Net capital gain/loss: +$3,022 (reported on 14.8% of returns)
Here:
+$3,022
State:
+$16,110
(% of AGI for various income ranges: -1.0% for AGIs below $10k, 0.3% for AGIs $10k-25k, -0.0% for AGIs $25k-50k, 0.0% for AGIs $50k-75k, 0.4% for AGIs $75k-100k, 2.0% for AGIs over 100k)
Profit/loss from business: +$5,081 (reported on 17.9% of returns)
Here:
+$5,081
State:
+$11,013
(% of AGI for various income ranges: 1.8% for AGIs below $10k, -2.2% for AGIs $10k-25k, 1.4% for AGIs $25k-50k, 1.3% for AGIs $50k-75k, 0.7% for AGIs $75k-100k, 3.0% for AGIs over 100k)
IRA payment deduction: $2,629 (reported on 2.2% of returns)
76123:
$2,629
Texas:
$3,120
(% of AGI for various income ranges: 0.1% for AGIs $10k-25k, 0.2% for AGIs $25k-50k, 0.1% for AGIs $50k-75k, 0.1% for AGIs $75k-100k, 0.1% for AGIs over 100k)
Self-employed pension: $10,730 (reported on 0.4% of returns)
Here:
$10,730
Texas:
$16,401
Total itemized deductions: $17,327 (21% of AGI, reported on 50.9% of returns)
Here:
$17,327
State:
$19,631
Here:
21.5% of AGI
State:
18.9% of AGI
(% of AGI for various income ranges: 12.5% for AGIs below $10k, 13.5% for AGIs $10k-25k, 19.8% for AGIs $25k-50k, 18.3% for AGIs $50k-75k, 17.0% for AGIs $75k-100k, 12.8% for AGIs over 100k)
Charity contributions deductions: $3,866 (5% of AGI, reported on 44.1% of returns)
Here:
$3,866
State:
$4,753
Here:
4.6% of AGI
State:
4.2% of AGI
(% of AGI for various income ranges: 1.1% for AGIs below $10k, 1.9% for AGIs $10k-25k, 3.1% for AGIs $25k-50k, 3.3% for AGIs $50k-75k, 3.3% for AGIs $75k-100k, 3.0% for AGIs over 100k)
Total tax: $7,667 (reported on 75.7% of returns)
76123:
$7,667
State:
$9,058
(% of AGI for various income ranges: 3.1% for AGIs below $10k, 3.5% for AGIs $10k-25k, 5.5% for AGIs $25k-50k, 7.8% for AGIs $50k-75k, 9.5% for AGIs $75k-100k, 15.9% for AGIs over 100k)
Earned income credit: $1,912 (reported on 14.8% of returns)
Here:
$1,912
State:
$2,024
Percentage of individuals using paid preparers for their 2004 taxes: 48.8%
Here:
49%
State:
57%
(% for various income ranges: 41.4% for AGIs below $10k, 57.7% for AGIs $10k-25k, 53.6% for AGIs $25k-50k, 47.4% for AGIs $50k-75k, 43.6% for AGIs $75k-100k, 44.5% for AGIs over 100k)
Likely homosexual households (counted as self-reported same-sex unmarried-partner households)
Lesbian couples: 0.5% of all households
Gay men: 0.0% of all households
Household received Food Stamps/SNAP in the past 12 months: 1,225 Household did not receive Food Stamps/SNAP in the past 12 months: 12,260
Women who had a birth in the past 12 months: 676 (427 now married, 246 unmarried) Women who did not have a birth in the past 12 months: 10,571 (5,129 now married, 5,427 unmarried)
Housing units in zip code 76123 with a mortgage: 7,816 (135 second mortgage, 9 home equity loan, 113 both second mortgage and home equity loan) Median monthly owner costs for units with a mortgage: $1,887 Median monthly owner costs for units without a mortgage: $919
Residents with income below the poverty level in 2022:
This zip code:
8.7%
Whole state:
14.0%
Residents with income below 50% of the poverty level in 2022:
This zip code:
4.4%
Whole state:
7.4%
Median number of rooms in houses and condos:
Here:
6.3
State:
6.3
Median number of rooms in apartments:
Here:
5.4
State:
4.0
Notable locations in this zip code not listed on our city pages
Churches in zip code 76123 include: United Methodist Church Christ (A), Candleridge Community Baptist Church (B), Abiding Faith Lutheran Church (C), Bethany Fellowship Church (D), Meadowridge Community Baptist Church (E), Hallmark Baptist Church (F). Display/hide their locations on the map
In group quarters: 198 (-1 institutionalized population)
Size of family households: 4,134 2-persons, 2,405 3-persons, 2,419 4-persons, 1,123 5-persons, 710 6-persons, 171 7-or-more-persons
Size of nonfamily households: 1,782 1-person, 625 2-persons, 41 3-persons
6,396 married couples with children.
3,915 single-parent households (516 men, 3,399 women).
74.5% of residents of 76123 zip code speak English at home.
17.1% of residents speak Spanish at home (65% very well, 14% well, 18% not well, 4% not at all).
3.0% of residents speak other Indo-European language at home (90% very well, 8% well, 2% not well).
4.5% of residents speak Asian or Pacific Island language at home (57% very well, 20% well, 23% not well, 1% not at all).
0.8% of residents speak other language at home (87% very well, 7% well, 5% not well).
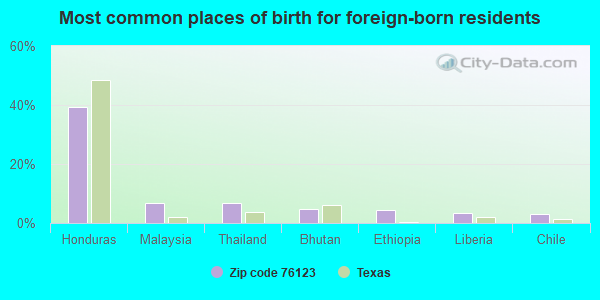
Foreign born population: 7,769 (18.5%) (58.4% of them are naturalized citizens)
Housing units lacking complete plumbing facilities: 0.5% Housing units lacking complete kitchen facilities: 2.0%
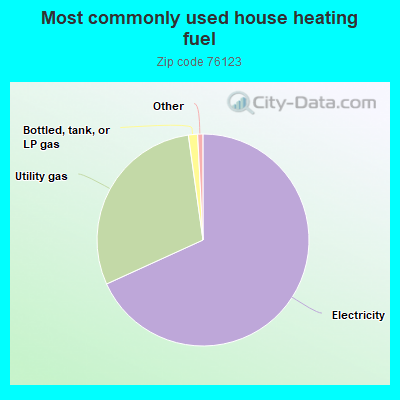
68.2%Electricity
29.6%Utility gas
1.4%Bottled, tank, or LP gas
Population in 1990: 5,314. Population change in the 1990s: +6,322 (+119.0%).
Place of birth for U.S.-born residents:
This state: 22,046
Northeast: 894
Midwest: 2,105
South: 4,661
West: 4,016
42% of the 76123 zip code residents lived in the same house 5 years ago. Out of people who lived in different houses, 62% lived in this county. Out of people who lived in different counties, 50% lived in Texas.
90% of the 76123 zip code residents lived in the same house 1 year ago. Out of people who lived in different houses, 71% moved from this county. Out of people who lived in different houses, 8% moved from different county within same state. Out of people who lived in different houses, 17% moved from different state. Out of people who lived in different houses, 2% moved from abroad.
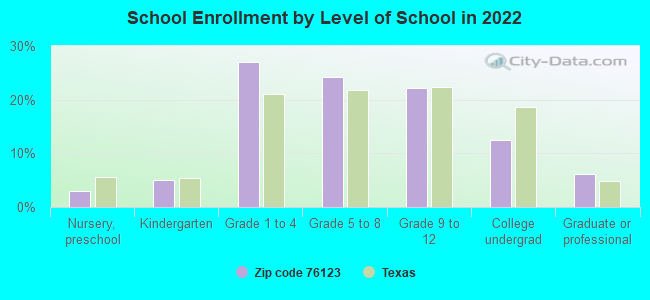
Private vs. public school enrollment:
Students in private schools in grades 1 to 8 (elementary and middle school): 764
Here:
12.1%
Texas:
8.8%
Students in private schools in grades 9 to 12 (high school): 382
Here:
13.9%
Texas:
8.0%
Students in private undergraduate colleges: 286
Here:
18.6%
Texas:
16.2%
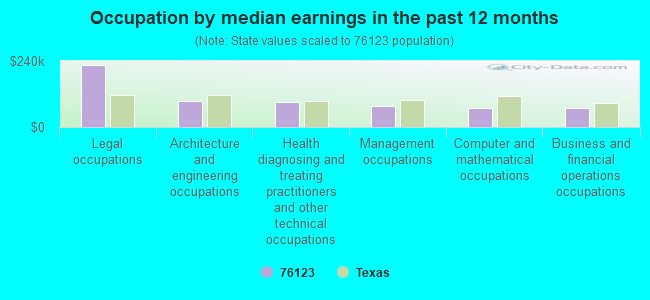
Occupation by median earnings in the past 12 months ($)
226,031Legal occupations
95,741Architecture and engineering occupations
90,339Health diagnosing and treating practitioners and other technical occupations
75,944Management occupations
69,892Computer and mathematical occupations
69,636Business and financial operations occupations
Top industries in this zip code by the number of employees in 2005:
Arts, Entertainment, and Recreation: Fitness and Recreational Sports Centers (100-249 employees: 1 establishment)
Other Services (except Public Administration): Religious Organizations (50-99: 1, 20-49: 1, 10-19: 1, 5-9: 2, 1-4: 4)
Health Care and Social Assistance: Residential Mental Retardation Facilities (10-19: 3, 5-9: 1)
Health Care and Social Assistance: Homes for the Elderly (20-49: 1, 1-4: 1)
Administrative and Support and Waste Management and Remediation Services: Janitorial Services (10-19: 1, 1-4: 1)
Other Services (except Public Administration): Drycleaning and Laundry Services (except Coin-Operated) (10-19: 1)
Wholesale Trade: Computer and Computer Peripheral Equipment and Software Merchant Wholesalers (10-19: 1)
Finance and Insurance: Insurance Agencies and Brokerages (5-9: 1, 1-4: 1)
Construction: Power and Communication Line and Related Structures Construction (5-9: 1)
Construction: Poured Concrete Foundation and Structure Contractors (5-9: 1)
People in group quarters in 2010:
153 people in group homes intended for adults
110 people in nursing facilities/skilled-nursing facilities
People in group quarters in 2000:
35 people in schools, hospitals, or wards for the intellectually disabled
8 people in homes for the mentally retarded
Fatal accident statistics in 2014:
Fatal accident count: 1
Vehicles involved in fatal accidents: 1
Fatal accidents caused by drunken drivers: 0
Fatalities: 1
Persons involved in fatal accidents: 1
Pedestrians involved in fatal accidents: 0
Fatal accident statistics in 2013:
Fatal accident count: 1
Vehicles involved in fatal accidents: 1
Fatal accidents caused by drunken drivers: 1
Fatalities: 1
Persons involved in fatal accidents: 3
Pedestrians involved in fatal accidents: 0
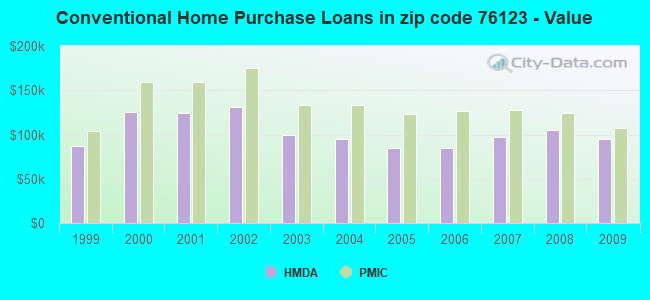
Home Mortgage Disclosure Act Aggregated Statistics For Year 2009 (Based on 4 full and 2 partial tracts)
A) FHA, FSA/RHS & VA Home Purchase Loans
B) Conventional Home Purchase Loans
C) Refinancings
D) Home Improvement Loans
F) Non-occupant Loans on < 5 Family Dwellings (A B C & D)
G) Loans On Manufactured Home Dwelling (A B C & D)
Number
Average Value
Number
Average Value
Number
Average Value
Number
Average Value
Number
Average Value
Number
Average Value
LOANS ORIGINATED
405
$113,253
147
$95,031
458
$123,394
19
$23,569
59
$88,673
0
$0
APPLICATIONS APPROVED, NOT ACCEPTED
24
$119,129
7
$109,264
58
$120,983
18
$9,517
6
$80,303
0
$0
APPLICATIONS DENIED
62
$113,454
31
$91,275
235
$123,651
42
$22,340
16
$67,894
3
$23,730
APPLICATIONS WITHDRAWN
76
$108,804
21
$96,348
167
$119,585
20
$43,255
22
$80,756
1
$36,010
FILES CLOSED FOR INCOMPLETENESS
8
$136,615
5
$77,354
46
$102,178
4
$19,945
1
$61,650
0
$0
Aggregated Statistics For Year 2008 (Based on 4 full and 2 partial tracts)
A) FHA, FSA/RHS & VA Home Purchase Loans
B) Conventional Home Purchase Loans
C) Refinancings
D) Home Improvement Loans
F) Non-occupant Loans on < 5 Family Dwellings (A B C & D)
G) Loans On Manufactured Home Dwelling (A B C & D)
Number
Average Value
Number
Average Value
Number
Average Value
Number
Average Value
Number
Average Value
Number
Average Value
LOANS ORIGINATED
409
$125,848
325
$105,456
256
$117,867
49
$28,046
110
$102,236
0
$0
APPLICATIONS APPROVED, NOT ACCEPTED
27
$127,862
26
$87,273
52
$110,086
7
$35,266
16
$75,251
0
$0
APPLICATIONS DENIED
88
$117,344
86
$101,795
350
$123,266
134
$28,200
47
$81,985
3
$93,323
APPLICATIONS WITHDRAWN
81
$121,692
65
$118,257
126
$124,060
4
$134,678
32
$100,064
0
$0
FILES CLOSED FOR INCOMPLETENESS
20
$129,773
16
$99,535
25
$124,302
4
$10,960
6
$44,500
2
$11,945
Aggregated Statistics For Year 2007 (Based on 4 full and 2 partial tracts)
A) FHA, FSA/RHS & VA Home Purchase Loans
B) Conventional Home Purchase Loans
C) Refinancings
D) Home Improvement Loans
F) Non-occupant Loans on < 5 Family Dwellings (A B C & D)
G) Loans On Manufactured Home Dwelling (A B C & D)
Number
Average Value
Number
Average Value
Number
Average Value
Number
Average Value
Number
Average Value
Number
Average Value
LOANS ORIGINATED
419
$126,157
1,090
$97,139
276
$115,731
80
$28,885
301
$84,159
0
$0
APPLICATIONS APPROVED, NOT ACCEPTED
18
$120,351
152
$105,117
80
$129,354
17
$33,490
26
$103,634
3
$38,163
APPLICATIONS DENIED
99
$122,019
246
$124,184
631
$114,205
186
$38,203
71
$97,733
1
$37,840
APPLICATIONS WITHDRAWN
63
$125,683
185
$117,847
267
$117,333
14
$34,469
36
$110,659
1
$118,420
FILES CLOSED FOR INCOMPLETENESS
9
$119,194
41
$101,402
85
$117,305
3
$15,223
9
$97,730
0
$0
Aggregated Statistics For Year 2006 (Based on 4 full and 2 partial tracts)
A) FHA, FSA/RHS & VA Home Purchase Loans
B) Conventional Home Purchase Loans
C) Refinancings
D) Home Improvement Loans
F) Non-occupant Loans on < 5 Family Dwellings (A B C & D)
G) Loans On Manufactured Home Dwelling (A B C & D)
Number
Average Value
Number
Average Value
Number
Average Value
Number
Average Value
Number
Average Value
Number
Average Value
LOANS ORIGINATED
373
$125,426
1,707
$84,836
286
$104,709
78
$30,998
456
$76,507
0
$0
APPLICATIONS APPROVED, NOT ACCEPTED
10
$146,340
298
$96,375
67
$109,228
25
$49,539
66
$83,757
0
$0
APPLICATIONS DENIED
54
$127,156
429
$90,497
579
$113,017
148
$29,849
82
$73,181
0
$0
APPLICATIONS WITHDRAWN
62
$135,530
338
$91,193
345
$113,218
16
$54,924
78
$83,884
1
$78,130
FILES CLOSED FOR INCOMPLETENESS
12
$126,158
63
$105,373
145
$119,352
2
$21,365
6
$65,703
0
$0
Aggregated Statistics For Year 2005 (Based on 4 full and 2 partial tracts)
A) FHA, FSA/RHS & VA Home Purchase Loans
B) Conventional Home Purchase Loans
C) Refinancings
D) Home Improvement Loans
F) Non-occupant Loans on < 5 Family Dwellings (A B C & D)
G) Loans On Manufactured Home Dwelling (A B C & D)
Number
Average Value
Number
Average Value
Number
Average Value
Number
Average Value
Number
Average Value
Number
Average Value
LOANS ORIGINATED
426
$125,098
1,741
$85,196
542
$104,960
64
$58,850
419
$79,671
1
$167,860
APPLICATIONS APPROVED, NOT ACCEPTED
11
$118,021
208
$87,081
83
$106,867
15
$29,038
59
$73,582
4
$31,795
APPLICATIONS DENIED
115
$127,146
448
$83,117
710
$110,246
146
$31,769
134
$73,836
6
$29,957
APPLICATIONS WITHDRAWN
112
$131,217
324
$103,755
374
$132,966
58
$212,537
49
$96,686
0
$0
FILES CLOSED FOR INCOMPLETENESS
8
$127,464
49
$90,711
254
$111,531
7
$24,659
16
$103,338
0
$0
Aggregated Statistics For Year 2004 (Based on 4 full and 2 partial tracts)
A) FHA, FSA/RHS & VA Home Purchase Loans
B) Conventional Home Purchase Loans
C) Refinancings
D) Home Improvement Loans
F) Non-occupant Loans on < 5 Family Dwellings (A B C & D)
G) Loans On Manufactured Home Dwelling (A B C & D)
Number
Average Value
Number
Average Value
Number
Average Value
Number
Average Value
Number
Average Value
Number
Average Value
LOANS ORIGINATED
584
$122,495
1,258
$94,410
814
$99,664
63
$40,579
276
$86,876
1
$59,820
APPLICATIONS APPROVED, NOT ACCEPTED
20
$114,298
169
$98,339
131
$98,970
9
$44,818
33
$86,315
2
$59,840
APPLICATIONS DENIED
62
$134,975
251
$101,435
669
$105,605
144
$24,523
45
$80,545
10
$64,004
APPLICATIONS WITHDRAWN
155
$127,475
218
$102,562
367
$104,668
11
$50,776
50
$77,671
2
$159,570
FILES CLOSED FOR INCOMPLETENESS
4
$152,588
44
$112,922
259
$109,314
8
$56,841
4
$70,508
0
$0
Aggregated Statistics For Year 2003 (Based on 4 full and 2 partial tracts)
A) FHA, FSA/RHS & VA Home Purchase Loans
B) Conventional Home Purchase Loans
C) Refinancings
D) Home Improvement Loans
F) Non-occupant Loans on < 5 Family Dwellings (A B C & D)
Number
Average Value
Number
Average Value
Number
Average Value
Number
Average Value
Number
Average Value
LOANS ORIGINATED
612
$119,862
976
$99,048
1,809
$99,100
62
$24,242
113
$80,209
APPLICATIONS APPROVED, NOT ACCEPTED
16
$124,836
119
$101,936
213
$98,723
27
$41,823
21
$75,421
APPLICATIONS DENIED
95
$113,356
156
$105,581
800
$92,626
98
$24,015
20
$78,367
APPLICATIONS WITHDRAWN
161
$117,014
154
$117,161
388
$94,540
2
$24,935
18
$106,933
FILES CLOSED FOR INCOMPLETENESS
12
$110,683
84
$93,714
82
$95,305
4
$13,462
3
$106,027
Aggregated Statistics For Year 2002 (Based on 2 partial tracts)
A) FHA, FSA/RHS & VA Home Purchase Loans
B) Conventional Home Purchase Loans
C) Refinancings
D) Home Improvement Loans
F) Non-occupant Loans on < 5 Family Dwellings (A B C & D)
Number
Average Value
Number
Average Value
Number
Average Value
Number
Average Value
Number
Average Value
LOANS ORIGINATED
53
$142,592
223
$131,313
136
$138,839
18
$31,164
5
$76,178
APPLICATIONS APPROVED, NOT ACCEPTED
3
$141,613
20
$116,678
20
$156,049
4
$33,420
1
$12,210
APPLICATIONS DENIED
4
$143,292
15
$102,385
38
$115,285
9
$23,060
3
$91,153
APPLICATIONS WITHDRAWN
6
$136,222
25
$137,608
23
$148,991
1
$23,200
2
$76,300
FILES CLOSED FOR INCOMPLETENESS
3
$141,613
9
$114,009
15
$148,856
0
$0
1
$73,250
Aggregated Statistics For Year 2001 (Based on 2 partial tracts)
A) FHA, FSA/RHS & VA Home Purchase Loans
B) Conventional Home Purchase Loans
C) Refinancings
D) Home Improvement Loans
F) Non-occupant Loans on < 5 Family Dwellings (A B C & D)
Number
Average Value
Number
Average Value
Number
Average Value
Number
Average Value
Number
Average Value
LOANS ORIGINATED
52
$133,302
130
$124,160
85
$144,342
17
$33,321
5
$91,438
APPLICATIONS APPROVED, NOT ACCEPTED
2
$145,885
15
$127,573
6
$107,125
6
$23,805
0
$0
APPLICATIONS DENIED
3
$140,393
21
$107,663
21
$127,748
5
$15,016
2
$95,530
APPLICATIONS WITHDRAWN
5
$150,280
9
$118,147
14
$138,561
2
$42,120
1
$147,720
FILES CLOSED FOR INCOMPLETENESS
0
$0
6
$139,680
5
$115,122
1
$6,100
1
$73,250
Aggregated Statistics For Year 2000 (Based on 2 partial tracts)
A) FHA, FSA/RHS & VA Home Purchase Loans
B) Conventional Home Purchase Loans
C) Refinancings
D) Home Improvement Loans
F) Non-occupant Loans on < 5 Family Dwellings (A B C & D)
Number
Average Value
Number
Average Value
Number
Average Value
Number
Average Value
Number
Average Value
LOANS ORIGINATED
10
$120,554
74
$125,281
13
$87,052
16
$28,231
2
$50,665
APPLICATIONS APPROVED, NOT ACCEPTED
1
$81,180
9
$111,161
2
$92,780
4
$33,572
0
$0
APPLICATIONS DENIED
1
$49,440
21
$49,500
4
$92,780
5
$23,196
0
$0
APPLICATIONS WITHDRAWN
2
$93,390
4
$132,762
1
$42,120
3
$22,583
1
$83,010
FILES CLOSED FOR INCOMPLETENESS
0
$0
4
$117,502
1
$168,470
0
$0
0
$0
Aggregated Statistics For Year 1999 (Based on 1 full and 1 partial tracts)
A) FHA, FSA/RHS & VA Home Purchase Loans
B) Conventional Home Purchase Loans
C) Refinancings
D) Home Improvement Loans
F) Non-occupant Loans on < 5 Family Dwellings (A B C & D)
2002 - 2017 National Fire Incident Reporting System (NFIRS) incidents
Based on the data from the years 2002 - 2017 the average number of fires per year is 31. The highest number of reported fires - 54 took place in 2011, and the least - 4 in 2017. The data has a declining trend.
When looking into fire subcategories, the most incidents belonged to: Outside Fires (42.8%), and Structure Fires (37.6%).
Fire incident types reported to NFIRS in Zip Code 76123


 Nearest zip codes: 76133, 76036, 76132, 76134, 76109, 76115.


 Based on the data from the years 2002 - 2017 the average number of fires per year is 31. The highest number of reported fires - 54 took place in 2011, and the least - 4 in 2017. The data has a declining trend.
 When looking into fire subcategories, the most incidents belonged to: Outside Fires (42.8%), and Structure Fires (37.6%).