Estimated zip code population in 2022: 24,928 Zip code population in 2010: 24,268 Zip code population in 2000: 22,281
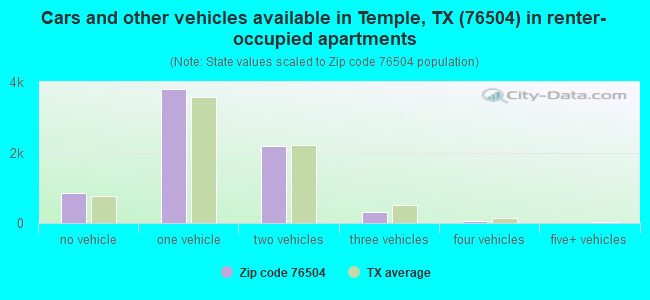
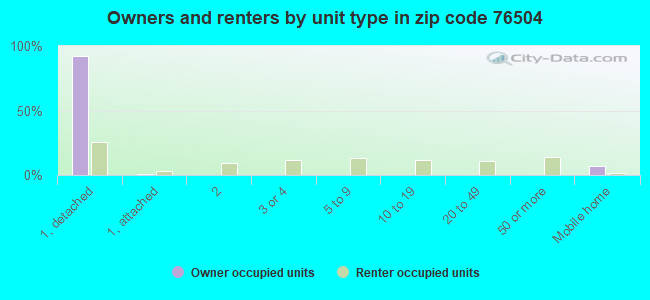
Houses and condos: 11,404 Renter-occupied apartments: 7,186
% of renters here:
68%
State:
38%
March 2022 cost of living index in zip code 76504: 85.2 (less than average, U.S. average is 100)
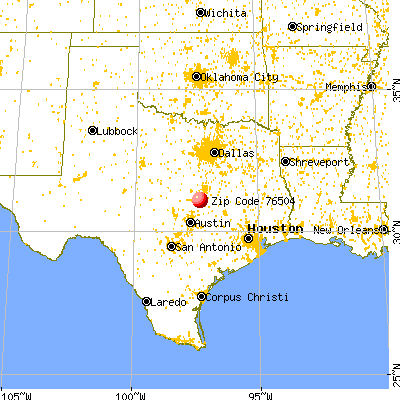
Land area: 27.0 sq. mi. Water area: 0.1 sq. mi.
Population density: 922 people per square mile
(low).
OSM Map
General Map
Google Map
MSN Map
OSM Map
General Map
Google Map
MSN Map
OSM Map
General Map
Google Map
MSN Map
OSM Map
General Map
Google Map
MSN Map
Please wait while loading the map...
Real estate property taxes paid for housing units in 2022:
This zip code:
1.4% ($2,378)
Texas:
1.5% ($4,050)
Median real estate property taxes paid for housing units with mortgages in 2022: $2,928 (1.6%) Median real estate property taxes paid for housing units with no mortgage in 2022: $1,899 (1.4%)
Averages for the 2020 tax year for zip code 76504, filed in 2021:
Average Adjusted Gross Income (AGI) in 2020: $40,433 (Individual Income Tax Returns)
Here:
$40,433
State:
$77,054
Salary/wage: $36,228 (reported on 86.8% of returns)
Here:
$36,228
State:
$62,766
(% of AGI for various income ranges: 1244.4% for AGIs below $25k, 3625.2% for AGIs $25k-50k, 6417.8% for AGIs $50k-75k, 9474.2% for AGIs $75k-100k, 15394.3% for AGIs $100k-200k, 48585.0% for AGIs over 200k)
Taxable interest for individuals: $995 (reported on 13.6% of returns)
This zip code:
$995
Texas:
$2,665
(% of AGI for various income ranges: 5.9% for AGIs below $25k, 11.2% for AGIs $25k-50k, 13.0% for AGIs $50k-75k, 21.4% for AGIs $75k-100k, 163.7% for AGIs $100k-200k, 322.5% for AGIs over 200k)
Ordinary dividends: $3,672 (reported on 7.1% of returns)
Here:
$3,672
State:
$10,044
(% of AGI for various income ranges: 5.9% for AGIs below $25k, 8.7% for AGIs $25k-50k, 24.4% for AGIs $50k-75k, 88.0% for AGIs $75k-100k, 244.9% for AGIs $100k-200k, 2222.5% for AGIs over 200k)
Net capital gain/loss in AGI: +$8,888 (reported on 7.1% of returns)
Here:
+$8,888
State:
+$39,590
(% of AGI for various income ranges: 4.1% for AGIs below $25k, 13.3% for AGIs $25k-50k, 40.3% for AGIs $50k-75k, 109.8% for AGIs $75k-100k, 647.1% for AGIs $100k-200k, 8347.5% for AGIs over 200k)
Profit/loss from business: +$9,701 (reported on 12.1% of returns)
Here:
+$9,701
State:
+$10,888
(% of AGI for various income ranges: 101.3% for AGIs below $25k, 99.3% for AGIs $25k-50k, 141.0% for AGIs $50k-75k, 157.0% for AGIs $75k-100k, 472.6% for AGIs $100k-200k, 5602.5% for AGIs over 200k)
Taxable individual retirement arrangement distribution: $15,254 (reported on 5.0% of returns)
76504:
$15,254
Texas:
$24,740
(% of AGI for various income ranges: 24.0% for AGIs below $25k, 44.1% for AGIs $25k-50k, 105.7% for AGIs $50k-75k, 251.6% for AGIs $75k-100k, 770.6% for AGIs $100k-200k, 2975.0% for AGIs over 200k)
Total itemized deductions: $33,995 (reported on 1.9% of returns)
Here:
$33,995
State:
$40,428
(% of AGI for various income ranges: 11.8% for AGIs below $25k, 44.4% for AGIs $25k-50k, 134.6% for AGIs $50k-75k, 128.4% for AGIs $75k-100k, 574.9% for AGIs $100k-200k, 3515.0% for AGIs over 200k)
Charity contributions: $12,028 (reported on 1.6% of returns)
Here:
$12,028
State:
$18,201
(% of AGI for various income ranges: 7.7% for AGIs $25k-50k, 42.6% for AGIs $50k-75k, 229.1% for AGIs $100k-200k, 1567.5% for AGIs over 200k)
Taxes paid: $5,582 (reported on 1.9% of returns)
76504:
$5,582
State:
$7,821
(% of AGI for various income ranges: 8.7% for AGIs $25k-50k, 28.0% for AGIs $50k-75k, 23.0% for AGIs $75k-100k, 84.9% for AGIs $100k-200k, 540.0% for AGIs over 200k)
Earned income credit: $2,514 (reported on 25.9% of returns)
Here:
$2,514
State:
$2,584
(% of AGI for various income ranges: 124.5% for AGIs below $25k, 80.6% for AGIs $25k-50k, 2.3% for AGIs $50k-75k)
Percentage of individuals using paid preparers for their 2020 taxes: 94.6%
Here:
95%
State:
92%
(% for various income ranges: 93.8% for AGIs below $25k, 95.5% for AGIs $25k-50k, 95.3% for AGIs $50k-75k, 94.3% for AGIs $75k-100k, 93.3% for AGIs $100k-200k, 90.9% for AGIs over 200k)
Averages for the 2012 tax year for zip code 76504, filed in 2013:
Average Adjusted Gross Income (AGI) in 2012: $34,111 (Individual Income Tax Returns)
Here:
$34,111
State:
$65,384
Salary/wage: $31,046 (reported on 87.3% of returns)
Here:
$31,046
State:
$52,524
(% of AGI for various income ranges: 84.4% for AGIs below $25k, 87.5% for AGIs $25k-50k, 79.1% for AGIs $50k-75k, 78.6% for AGIs $75k-100k, 69.7% for AGIs $100k-200k, 51.5% for AGIs over 200k)
Taxable interest for individuals: $1,165 (reported on 17.2% of returns)
This zip code:
$1,165
Texas:
$2,372
(% of AGI for various income ranges: 0.6% for AGIs below $25k, 0.4% for AGIs $25k-50k, 0.5% for AGIs $50k-75k, 0.8% for AGIs $75k-100k, 0.5% for AGIs $100k-200k, 1.2% for AGIs over 200k)
Ordinary dividends: $3,597 (reported on 8.0% of returns)
Here:
$3,597
State:
$9,721
(% of AGI for various income ranges: 0.5% for AGIs below $25k, 0.2% for AGIs $25k-50k, 0.6% for AGIs $50k-75k, 0.7% for AGIs $75k-100k, 1.7% for AGIs $100k-200k, 4.0% for AGIs over 200k)
Net capital gain/loss in AGI: +$9,767 (reported on 6.4% of returns)
Here:
+$9,767
State:
+$35,319
(% of AGI for various income ranges: 0.2% for AGIs $25k-50k, 0.7% for AGIs $50k-75k, 0.3% for AGIs $75k-100k, 2.5% for AGIs $100k-200k, 18.6% for AGIs over 200k)
Profit/loss from business: +$8,018 (reported on 10.8% of returns)
Here:
+$8,018
State:
+$13,732
(% of AGI for various income ranges: 5.4% for AGIs below $25k, 1.2% for AGIs $25k-50k, 1.3% for AGIs $50k-75k, 1.4% for AGIs $75k-100k, 5.4% for AGIs $100k-200k)
Taxable individual retirement arrangement distribution: $11,592 (reported on 6.2% of returns)
76504:
$11,592
Texas:
$19,511
(% of AGI for various income ranges: 1.4% for AGIs below $25k, 1.5% for AGIs $25k-50k, 2.3% for AGIs $50k-75k, 2.7% for AGIs $75k-100k, 5.0% for AGIs $100k-200k)
Total itemized deductions: $17,398 (23% of AGI, reported on 10.4% of returns)
Here:
$17,398
State:
$24,724
Here:
22.9% of AGI
State:
15.9% of AGI
(% of AGI for various income ranges: 2.9% for AGIs below $25k, 3.8% for AGIs $25k-50k, 6.1% for AGIs $50k-75k, 7.6% for AGIs $75k-100k, 8.9% for AGIs $100k-200k, 6.4% for AGIs over 200k)
Charity contributions: $5,378 (reported on 7.4% of returns)
Here:
$5,378
State:
$6,808
(% of AGI for various income ranges: 0.3% for AGIs below $25k, 0.6% for AGIs $25k-50k, 1.1% for AGIs $50k-75k, 1.6% for AGIs $75k-100k, 2.6% for AGIs $100k-200k, 3.0% for AGIs over 200k)
Taxes paid: $4,058 (reported on 10.0% of returns)
76504:
$4,058
State:
$6,921
(% of AGI for various income ranges: 0.6% for AGIs below $25k, 0.8% for AGIs $25k-50k, 1.3% for AGIs $50k-75k, 1.6% for AGIs $75k-100k, 2.2% for AGIs $100k-200k, 1.7% for AGIs over 200k)
Earned income credit: $2,527 (reported on 31.7% of returns)
Here:
$2,527
State:
$2,570
(% of AGI for various income ranges: 9.4% for AGIs below $25k, 1.6% for AGIs $25k-50k)
Percentage of individuals using paid preparers for their 2012 taxes: 51.9%
Here:
52%
State:
51%
(% for various income ranges: 52.3% for AGIs below $25k, 50.2% for AGIs $25k-50k, 50.9% for AGIs $50k-75k, 52.3% for AGIs $75k-100k, 60.6% for AGIs $100k-200k, 71.4% for AGIs over 200k)
Averages for the 2004 tax year for zip code 76504, filed in 2005:
Average Adjusted Gross Income (AGI) in 2004: $30,253 (Individual Income Tax Returns)
Here:
$30,253
State:
$47,881
Salary/wage: $27,924 (reported on 87.5% of returns)
Here:
$27,924
State:
$41,947
(% of AGI for various income ranges: 101.3% for AGIs below $10k, 85.8% for AGIs $10k-25k, 86.3% for AGIs $25k-50k, 78.6% for AGIs $50k-75k, 77.1% for AGIs $75k-100k, 64.5% for AGIs over 100k)
Taxable interest for individuals: $1,787 (reported on 24.3% of returns)
This zip code:
$1,787
Texas:
$2,255
(% of AGI for various income ranges: 1.8% for AGIs below $10k, 1.4% for AGIs $10k-25k, 1.0% for AGIs $25k-50k, 1.5% for AGIs $50k-75k, 0.8% for AGIs $75k-100k, 2.7% for AGIs over 100k)
Taxable dividends: $2,172 (reported on 10.9% of returns)
Here:
$2,172
State:
$4,261
(% of AGI for various income ranges: 1.4% for AGIs below $10k, 0.4% for AGIs $10k-25k, 0.5% for AGIs $25k-50k, 0.5% for AGIs $50k-75k, 1.0% for AGIs $75k-100k, 1.9% for AGIs over 100k)
Net capital gain/loss: +$4,001 (reported on 9.5% of returns)
Here:
+$4,001
State:
+$16,110
(% of AGI for various income ranges: -0.5% for AGIs below $10k, 0.2% for AGIs $10k-25k, 0.4% for AGIs $25k-50k, 0.3% for AGIs $50k-75k, 1.5% for AGIs $75k-100k, 5.8% for AGIs over 100k)
Profit/loss from business: +$8,726 (reported on 10.2% of returns)
Here:
+$8,726
State:
+$11,013
(% of AGI for various income ranges: 2.2% for AGIs below $10k, 2.1% for AGIs $10k-25k, 1.7% for AGIs $25k-50k, 2.5% for AGIs $50k-75k, 2.6% for AGIs $75k-100k, 7.4% for AGIs over 100k)
IRA payment deduction: $2,725 (reported on 1.5% of returns)
76504:
$2,725
Texas:
$3,120
(% of AGI for various income ranges: 0.1% for AGIs $10k-25k, 0.1% for AGIs $25k-50k, 0.1% for AGIs $50k-75k, 0.1% for AGIs $75k-100k, 0.2% for AGIs over 100k)
Self-employed pension: $12,238 (reported on 0.2% of returns)
Here:
$12,238
Texas:
$16,401
Total itemized deductions: $14,739 (22% of AGI, reported on 11.5% of returns)
Here:
$14,739
State:
$19,631
Here:
22.0% of AGI
State:
18.9% of AGI
(% of AGI for various income ranges: 2.5% for AGIs below $10k, 2.8% for AGIs $10k-25k, 4.7% for AGIs $25k-50k, 7.1% for AGIs $50k-75k, 7.8% for AGIs $75k-100k, 8.2% for AGIs over 100k)
Charity contributions deductions: $4,081 (6% of AGI, reported on 9.1% of returns)
Here:
$4,081
State:
$4,753
Here:
5.6% of AGI
State:
4.2% of AGI
(% of AGI for various income ranges: 0.1% for AGIs below $10k, 0.3% for AGIs $10k-25k, 0.8% for AGIs $25k-50k, 1.5% for AGIs $50k-75k, 1.6% for AGIs $75k-100k, 2.8% for AGIs over 100k)
Total tax: $4,063 (reported on 64.4% of returns)
76504:
$4,063
State:
$9,058
(% of AGI for various income ranges: 1.9% for AGIs below $10k, 3.2% for AGIs $10k-25k, 6.5% for AGIs $25k-50k, 9.4% for AGIs $50k-75k, 11.7% for AGIs $75k-100k, 18.1% for AGIs over 100k)
Earned income credit: $1,937 (reported on 28.7% of returns)
Here:
$1,937
State:
$2,024
Percentage of individuals using paid preparers for their 2004 taxes: 58.8%
Here:
59%
State:
57%
(% for various income ranges: 55.9% for AGIs below $10k, 62.6% for AGIs $10k-25k, 58.0% for AGIs $25k-50k, 57.0% for AGIs $50k-75k, 53.7% for AGIs $75k-100k, 57.3% for AGIs over 100k)
Household received Food Stamps/SNAP in the past 12 months: 1,702 Household did not receive Food Stamps/SNAP in the past 12 months: 8,876
Women who had a birth in the past 12 months: 452 (247 now married, 201 unmarried) Women who did not have a birth in the past 12 months: 5,832 (2,214 now married, 3,629 unmarried)
Housing units in zip code 76504 with a mortgage: 1,901 (10 second mortgage, 11 both second mortgage and home equity loan) Houses without a mortgage: 34
Median monthly owner costs for units with a mortgage: $1,306 Median monthly owner costs for units without a mortgage: $502
Residents with income below the poverty level in 2022:
This zip code:
19.7%
Whole state:
14.0%
Residents with income below 50% of the poverty level in 2022:
This zip code:
11.3%
Whole state:
7.4%
Median number of rooms in houses and condos:
Here:
5.7
State:
6.3
Median number of rooms in apartments:
Here:
3.7
State:
4.0
Notable locations in this zip code not listed on our city pages
Notable locations in zip code 76504: Knowd (A), Temple Golf Course and Country Club (B), Kyle Hotel (C), Railroad and Pioneer Museum (D), Temple Fire Training Academy (E), Temple Fire and Rescue Station 6 (F), Temple Fire and Rescue Station 5 (G), Olin E Teague Veterans Center (H), Central Texas Emergency Medical Services (I), Barclay-Bryan House (J), Ralph Senior and Sunny Wilson House (K). Display/hide their locations on the map
Churches in zip code 76504 include: Immanuel Baptist Church (A), Heights Baptist Church (B), Goodwill Mexican Baptist Church (C), Faith Baptist Church (D), Eternal Life Baptist Church (E), College Heights Baptist Church (F), Church of Christ (G), Our Lady of Guadalupe Church (H), New Covenant Baptist Church (I). Display/hide their locations on the map
Parks in zip code 76504 include: Jaycee Park (1), Hodge Park (2), Sammons Park (3), Hodge Park (4), Jones Park (5), Cedar Creek Wildlife Management Area (6), Tarrant Park (7), Scott and White Park (8), Temple Jaycee Park (9). Display/hide their locations on the map
2,795 married couples with children.
1,799 single-parent households (405 men, 1,394 women).
80.0% of residents of 76504 zip code speak English at home.
17.5% of residents speak Spanish at home (59% very well, 13% well, 17% not well, 12% not at all).
1.2% of residents speak other Indo-European language at home (82% very well, 13% well, 4% not well).
0.9% of residents speak Asian or Pacific Island language at home (79% very well, 18% well, 4% not well).
0.3% of residents speak other language at home (60% very well, 23% well, 17% not at all).
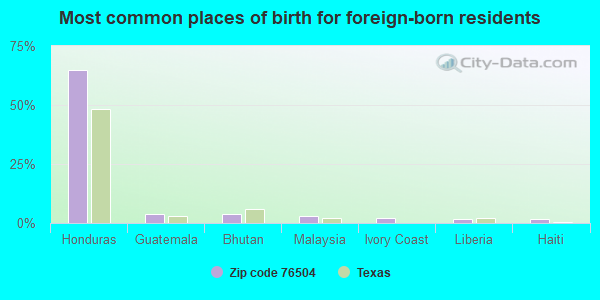
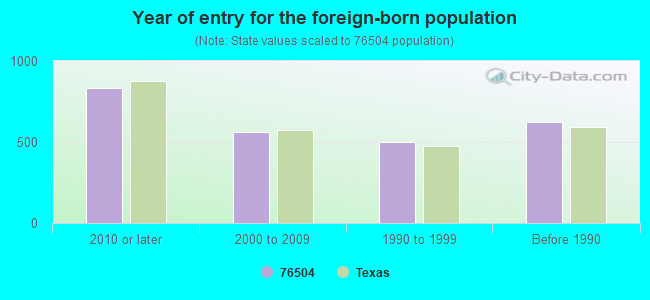
Foreign born population: 2,082 (8.4%) (33.1% of them are naturalized citizens)
Facilities with environmental interests located in this zip code:
ARTCO BELL CORPORATION (1302 INDUSTRIAL BLVD. in TEMPLE, TX)
AIR MINOR (AIRS/AFS) (Integrated Compliance Information System) - ICIS-06-2006-0609, ENFORCEMENT/COMPLIANCE ACTIVITY FORMAL ENFORCEMENT ACTION (Integrated Compliance Information System) - ICIS-06-2006-0609, ENFORCEMENT/COMPLIANCE ACTIVITY HAZARDOUS WASTE BIENNIAL REPORTER (Resource Conservation and Recovery Act (tracking hazardous waste)) Large Quantity Generators, more that 1000 kg of hazardous waste/month (Resource Conservation and Recovery Act (tracking hazardous waste)) - notification TRI REPORTER (Tracking of toxic chemicals releasing facilities) Business SIC classification: PUBLIC BUILDING AND RELATED FURNITURE; ELECTROPLATING, PLATING, POLISHING, ANODIZING, AND COLORING Business NAICS classification: INSTITUTIONAL FURNITURE MANUFACTURING. Organizations: ARTCO-BELL CORPORATION (CONTACT/OPERATOR)
Alternative names: ARTCO BELL CORP.
AUTO BODY CLINIC (1004 S 1ST ST in TEMPLE, TX)
(Resource Conservation and Recovery Act (tracking hazardous waste)) Organizations: AUTO BODY CLINIC INC (CONTACT/OPERATOR)
Housing units lacking complete plumbing facilities: 1.0% Housing units lacking complete kitchen facilities: 3.8%
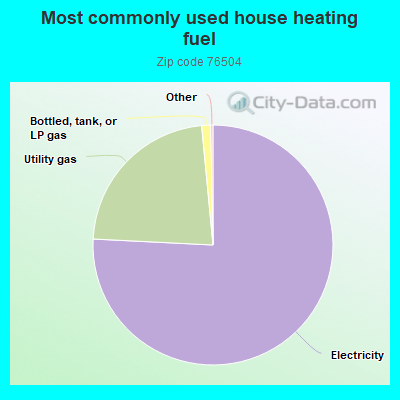
75.8%Electricity
22.7%Utility gas
1.2%Bottled, tank, or LP gas
Population in 1990: 20,273. Population change in the 1990s: +2,008 (+9.9%).
Place of birth for U.S.-born residents:
This state: 15,476
Northeast: 1,034
Midwest: 1,681
South: 2,157
West: 2,042
40% of the 76504 zip code residents lived in the same house 5 years ago. Out of people who lived in different houses, 57% lived in this county. Out of people who lived in different counties, 50% lived in Texas.
80% of the 76504 zip code residents lived in the same house 1 year ago. Out of people who lived in different houses, 57% moved from this county. Out of people who lived in different houses, 18% moved from different county within same state. Out of people who lived in different houses, 21% moved from different state. Out of people who lived in different houses, 1% moved from abroad.
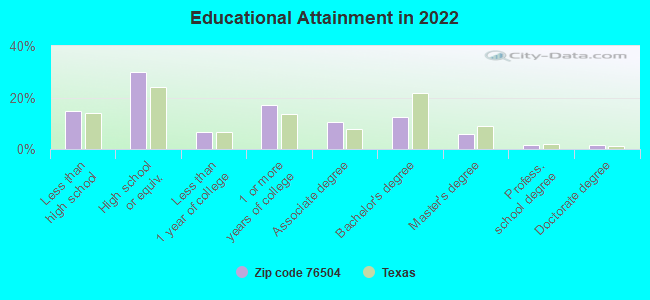
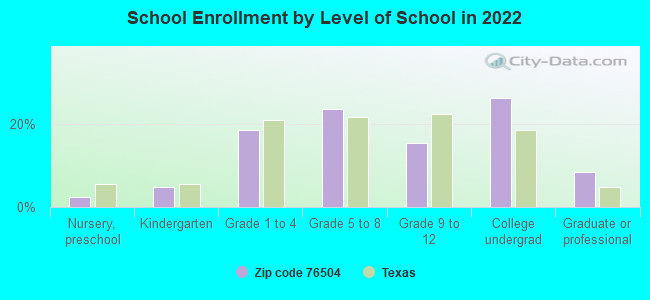
Private vs. public school enrollment:
Students in private schools in grades 1 to 8 (elementary and middle school): 208
Here:
9.0%
Texas:
8.8%
Students in private schools in grades 9 to 12 (high school): 101
Here:
12.0%
Texas:
8.0%
Students in private undergraduate colleges: 213
Here:
14.8%
Texas:
16.2%
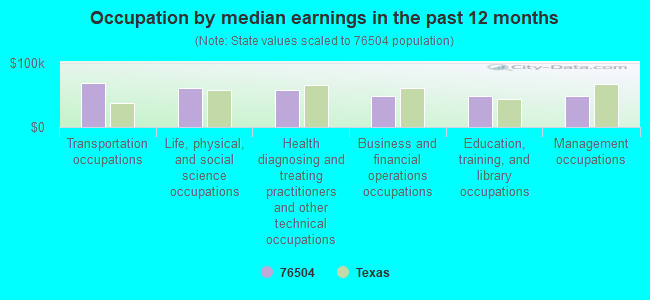
Occupation by median earnings in the past 12 months ($)
68,954Transportation occupations
60,791Life, physical, and social science occupations
58,491Health diagnosing and treating practitioners and other technical occupations
49,088Business and financial operations occupations
48,882Education, training, and library occupations
48,572Management occupations
Companies with biggest federal contracts located in this zip code (TEMPLE, TX):
MW BUILDERS OF TEXAS, INC (1701 N GENERAL BRUCE DR) : $184,270,226 in 220 contractsfrom 2003 to 2006
Contracts for Construction of Structures and Facilities -- Miscellaneous Buildings, Construction of Structures and Facilities -- Troop Housing Facilities, Construction of Structures and Facilities -- Office Buildings by Army Signed by year:2000: $0; 2001: $0; 2002: $0; 2003: $51,394,453; 2004: $56,461,297; 2005: $56,457,273; 2006: $19,957,203.
Biggest contracts:
$45,897,000 with Army for Construction of Structures and Facilities -- Miscellaneous Buildings. Signed on 2005-09-29. Completion date: 2005-09-30.
$32,546,000 with Army for Construction of Structures and Facilities -- Troop Housing Facilities. Taking place in KS. Signed on 2003-03-21. Completion date: 2005-05-09.
$32,348,921 with Army for Construction of Structures and Facilities -- Miscellaneous Buildings. Signed on 2004-10-14. Completion date: 2006-01-31.
$19,932,000, same as above.Signed on 2006-05-31. Completion date: 2008-06-24.
SUNBELT TRANSFORMER INC (1922 SOUTH M L K JR DRIV) : $641,022 in 9 contractsfrom 2000 to 2006
Contracts for Transformers: Distribution and Power Station, Coils and Transformers, , Maintenance, Repair or Alteration of Real Property -- Other Non-Building Facilities by Navy, Bureau of Reclamation, Army, U.S. Army Corps of Engineers - civil program financing only, and others Signed by year:2000: $255,000; 2001: $3,730; 2002: $298,000; 2003: $0; 2004: $44,472; 2005: $21,215; 2006: $18,605.
Biggest contracts:
$298,000 with Navy for Transformers: Distribution and Power Station. Signed on 2002-04-10. Completion date: 2002-07-31.
$255,000 with Bureau of Reclamation for Coils and Transformers. Taking place in CO. Signed on 2000-09-15. Completion date: 2001-09-15.
$22,236 with Army for Transformers: Distribution and Power Station. Signed on 2004-05-04. Completion date: 2004-06-18.
$22,236 with U.S. Army Corps of Engineers - civil program financing only for Transformers: Distribution and Power Station. Signed on 2004-05-04. Completion date: 2004-06-18.
B. VENTURES, INC (1300 NORTH GENERAL BRUCE D; small business) : $143,920 in 2 contractsin 2000
$93,920 with Army for Packing/Crating Services. Signed on 2000-03-02. Completion date: 2000-09-30.
$50,000, same as above.Signed on 2000-09-22. Completion date: 2000-09-30.
DELTA CENTRIFUGAL CORPORATION (3402 CENTER ST; small business) : $50,038 in 6 contractsfrom 2004 to 2006
Contracts for Bearings, Plain, Unmounted, Bushings, Rings, Shims, and Spacers, Structural Shapes by U.S. Coast Guard, Army, U.S. Army Corps of Engineers - civil program financing only Signed by year:2000: $0; 2001: $0; 2002: $0; 2003: $0; 2004: $44,054; 2005: $5,984; 2006: $0.
Biggest contracts:
$34,010 with U.S. Coast Guard for Bearings, Plain, Unmounted. Signed on 2004-11-18. Completion date: 2005-02-04.
$5,984 with Army for Bushings, Rings, Shims, and Spacers. Taking place in WV. Signed on 2005-11-30. Completion date: 2006-06-01.
$5,022 with U.S. Army Corps of Engineers - civil program financing only for Structural Shapes. Signed on 2004-05-07. Completion date: 2004-06-15.
$5,022 with Army for Structural Shapes. Signed on 2004-05-07. Completion date: 2004-06-15.
EVCO SERVICES INC (1918 W AVENUE M; small business) : $35,281 in 6 contractsin 2003
Contracts for Custodial Janitorial Services by Army Signed by year:2000: $0; 2001: $0; 2002: $0; 2003: $35,281; 2004: $0; 2005: $0; 2006: $0.
Biggest contracts:
$12,301 with Army for Custodial Janitorial Services. Signed on 2003-10-06. Completion date: 2004-09-30.
$12,000, same as above.Signed on 2003-10-01. Completion date: 2004-09-30.
$10,980, same as above.Signed on 2003-11-24. Completion date: 2004-09-30.
$0, same as above.Signed on 2003-10-06. Completion date: 2004-09-30.
CTWP (1505 W AVE M; small business) : $24,453 in 15 contractsfrom 2001 to 2006
Contracts for Lease or Rental of Equipment -- Office Machines, Text Processing Systems and Visible Record Equipment, Lease or Rental of Equipment -- Weapons, Maintenance, Repair and Rebuilding of Equipment -- Special Industry Machinery, Lease or Rental of Equipment -- Special Industry Machinery, and moreby Army Signed by year:2000: $0; 2001: $4,973; 2002: $13,853; 2003: $1,440; 2004: $1,512; 2005: $1,512; 2006: $1,163.
Biggest contracts:
$6,200 with Army for Lease or Rental of Equipment -- Office Machines, Text Processing Systems and Visible Record Equipment. Signed on 2002-02-20. Completion date: 2002-03-05.
$5,660 with Army for Lease or Rental of Equipment -- Weapons. Signed on 2002-06-07. Completion date: 2002-05-10.
$2,778 with Army for Maintenance, Repair and Rebuilding of Equipment -- Special Industry Machinery. Signed on 2001-11-02. Completion date: 2002-09-30.
$1,650 with Army for Lease or Rental of Equipment -- Special Industry Machinery. Signed on 2001-10-12. Completion date: 2001-12-11.
WILLIE F GILLIS (1610 S 31ST STE 102; small business) : $23,035 in 5 contractsfrom 2004 to 2006
Contracts for Guard Services, Other Housekeeping Services, Recreational Services, Services -- Basic Research (R&D) by Army Signed by year:2000: $0; 2001: $0; 2002: $0; 2003: $0; 2004: $15,175; 2005: $0; 2006: $7,860.
Biggest contracts:
$9,100 with Army for Guard Services. Signed on 2004-03-15. Completion date: 2004-04-01.
$7,860 with Army for Other Housekeeping Services. Signed on 2006-02-09. Completion date: 2006-01-11.
$6,075 with Army for Recreational Services. Signed on 2004-09-15. Completion date: 2003-10-01.
$0 with Army for Services -- Basic Research (R&D). Signed on 2005-09-01. Effective on 2005-08-05. Completion date: 2007-03-31.
DINA CLEAN PROF SERVICES LLC (CLEAN2102 W AVENUE D; small business)
$12,749 with Army for Other Housekeeping Services. Signed on 2005-11-28. Completion date: 2005-11-04.
K-TAPP LTD (2314 W ADAMS STE A; small business)
$10,924 with Army for Packaging and Packing Bulk Materials. Signed on 2005-08-18. Completion date: 2005-09-09.
SUN COUNTRY BICYCLES INC (1719 W AVENUE M STE C; small business)
$10,500 with Army for Motorcycles, Motor Scooters, and Bicycles. Signed on 2004-09-13. Completion date: 2004-09-20.
Top industries in this zip code by the number of employees in 2005:
Health Care and Social Assistance: General Medical and Surgical Hospitals (over 1000 employees: 1 establishment, 100-249 employees: 1 establishment)
Health Care and Social Assistance: Home Health Care Services (500-999: 1, 100-249: 1, 50-99: 1, 20-49: 2, 10-19: 2, 1-4: 2)
Health Care and Social Assistance: Nursing Care Facilities (100-249: 2, 50-99: 2)
Information: Cellular and Other Wireless Telecommunications (250-499: 1, 5-9: 1)
Finance and Insurance: Direct Property and Casualty Insurance Carriers (250-499: 1, 1-4: 2)
Construction: Water and Sewer Line and Related Structures Construction (250-499: 1, 1-4: 1)
Information: Data Processing, Hosting, and Related Services (250-499: 1, 1-4: 1)
Management of Companies and Enterprises: Corporate, Subsidiary, and Regional Managing Offices (250-499: 1, 1-4: 1)
Wholesale Trade: Tobacco and Tobacco Product Merchant Wholesalers (250-499: 1)
People in group quarters in 2010:
620 people in nursing facilities/skilled-nursing facilities
286 people in residential treatment centers for adults
179 people in other noninstitutional facilities
81 people in emergency and transitional shelters (with sleeping facilities) for people experiencing homelessness
66 people in correctional residential facilities
15 people in in-patient hospice facilities
6 people in group homes intended for adults
People in group quarters in 2000:
556 people in nursing homes
379 people in hospitals or wards for drug/alcohol abuse
156 people in other noninstitutional group quarters
116 people in hospitals/wards and hospices for chronically ill
116 people in other hospitals or wards for chronically ill
86 people in college dormitories (includes college quarters off campus)
48 people in homes for the mentally retarded
20 people in other nonhousehold living situations
5 people in homes or halfway houses for drug/alcohol abuse
2 people in religious group quarters
Fatal accident statistics in 2014:
Fatal accident count: 1
Vehicles involved in fatal accidents: 2
Fatal accidents caused by drunken drivers: 1
Fatalities: 2
Persons involved in fatal accidents: 2
Pedestrians involved in fatal accidents: 0
Fatal accident statistics in 2013:
Fatal accident count: 2
Vehicles involved in fatal accidents: 4
Fatal accidents caused by drunken drivers: 1
Fatalities: 3
Persons involved in fatal accidents: 6
Pedestrians involved in fatal accidents: 0
Home Mortgage Disclosure Act Aggregated Statistics For Year 2009 (Based on 8 full and 6 partial tracts)
A) FHA, FSA/RHS & VA Home Purchase Loans
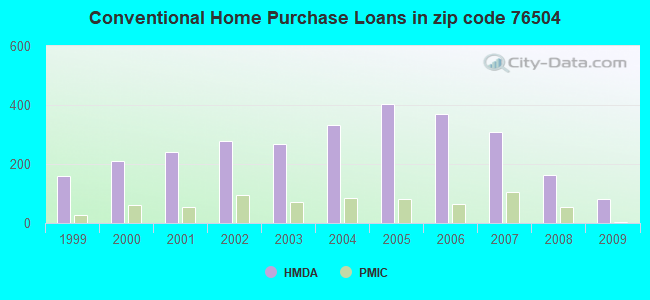
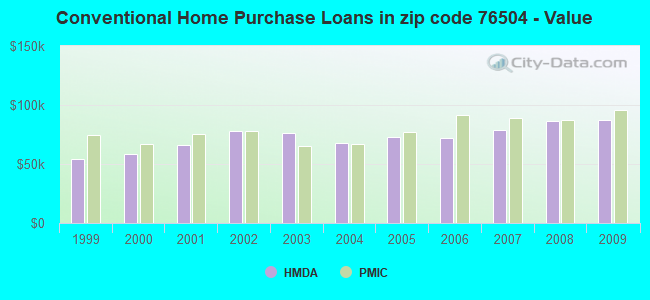
B) Conventional Home Purchase Loans
C) Refinancings
D) Home Improvement Loans
E) Loans on Dwellings For 5+ Families
F) Non-occupant Loans on < 5 Family Dwellings (A B C & D)
G) Loans On Manufactured Home Dwelling (A B C & D)
Number
Average Value
Number
Average Value
Number
Average Value
Number
Average Value
Number
Average Value
Number
Average Value
Number
Average Value
LOANS ORIGINATED
174
$94,572
83
$87,290
158
$102,683
40
$28,883
1
$13,720
59
$76,229
4
$32,918
APPLICATIONS APPROVED, NOT ACCEPTED
2
$75,185
3
$66,447
13
$72,456
9
$20,440
0
$0
1
$82,300
1
$35,660
APPLICATIONS DENIED
65
$113,235
22
$100,235
65
$109,024
65
$26,034
0
$0
12
$60,969
5
$67,116
APPLICATIONS WITHDRAWN
13
$94,075
8
$73,425
53
$106,559
11
$28,809
0
$0
12
$82,322
2
$77,265
FILES CLOSED FOR INCOMPLETENESS
0
$0
3
$88,163
13
$85,172
4
$250,432
0
$0
0
$0
1
$26,520
Aggregated Statistics For Year 2008 (Based on 8 full and 6 partial tracts)
A) FHA, FSA/RHS & VA Home Purchase Loans
B) Conventional Home Purchase Loans
C) Refinancings
D) Home Improvement Loans
E) Loans on Dwellings For 5+ Families
F) Non-occupant Loans on < 5 Family Dwellings (A B C & D)
G) Loans On Manufactured Home Dwelling (A B C & D)
Number
Average Value
Number
Average Value
Number
Average Value
Number
Average Value
Number
Average Value
Number
Average Value
Number
Average Value
LOANS ORIGINATED
203
$97,303
162
$86,273
139
$90,748
58
$29,088
6
$316,785
88
$83,983
8
$56,329
APPLICATIONS APPROVED, NOT ACCEPTED
10
$84,013
22
$79,346
15
$70,452
6
$28,600
0
$0
6
$75,052
12
$55,944
APPLICATIONS DENIED
13
$98,241
23
$91,217
149
$87,434
107
$32,522
0
$0
18
$132,743
10
$66,953
APPLICATIONS WITHDRAWN
16
$79,039
8
$88,214
55
$108,790
9
$21,171
0
$0
7
$146,550
2
$50,750
FILES CLOSED FOR INCOMPLETENESS
4
$85,120
12
$98,127
11
$99,970
11
$23,980
0
$0
5
$62,550
0
$0
Aggregated Statistics For Year 2007 (Based on 8 full and 6 partial tracts)
A) FHA, FSA/RHS & VA Home Purchase Loans
B) Conventional Home Purchase Loans
C) Refinancings
D) Home Improvement Loans
E) Loans on Dwellings For 5+ Families
F) Non-occupant Loans on < 5 Family Dwellings (A B C & D)
G) Loans On Manufactured Home Dwelling (A B C & D)
Number
Average Value
Number
Average Value
Number
Average Value
Number
Average Value
Number
Average Value
Number
Average Value
Number
Average Value
LOANS ORIGINATED
149
$89,512
310
$78,884
161
$81,726
56
$38,971
2
$443,835
150
$66,003
13
$45,848
APPLICATIONS APPROVED, NOT ACCEPTED
5
$53,376
44
$65,300
28
$52,492
13
$20,892
0
$0
25
$53,581
11
$38,305
APPLICATIONS DENIED
29
$84,303
65
$75,612
208
$84,365
120
$31,457
0
$0
54
$69,797
17
$47,723
APPLICATIONS WITHDRAWN
21
$92,039
24
$56,577
120
$84,938
20
$63,082
0
$0
16
$102,774
2
$15,000
FILES CLOSED FOR INCOMPLETENESS
7
$66,651
12
$90,927
36
$87,010
2
$86,180
0
$0
6
$87,770
0
$0
Aggregated Statistics For Year 2006 (Based on 8 full and 6 partial tracts)
A) FHA, FSA/RHS & VA Home Purchase Loans
B) Conventional Home Purchase Loans
C) Refinancings
D) Home Improvement Loans
E) Loans on Dwellings For 5+ Families
F) Non-occupant Loans on < 5 Family Dwellings (A B C & D)
G) Loans On Manufactured Home Dwelling (A B C & D)
Number
Average Value
Number
Average Value
Number
Average Value
Number
Average Value
Number
Average Value
Number
Average Value
Number
Average Value
LOANS ORIGINATED
178
$86,780
371
$72,037
193
$75,396
49
$39,320
0
$0
138
$64,398
9
$38,171
APPLICATIONS APPROVED, NOT ACCEPTED
6
$76,213
66
$58,857
30
$75,470
10
$26,209
0
$0
13
$49,350
9
$38,673
APPLICATIONS DENIED
13
$77,085
117
$60,076
214
$86,039
135
$42,492
2
$2,000
41
$62,112
20
$42,120
APPLICATIONS WITHDRAWN
20
$104,374
57
$82,482
172
$83,836
20
$61,686
0
$0
14
$47,691
1
$55,780
FILES CLOSED FOR INCOMPLETENESS
4
$73,565
19
$100,150
53
$95,572
0
$0
0
$0
6
$140,895
0
$0
Aggregated Statistics For Year 2005 (Based on 8 full and 6 partial tracts)
A) FHA, FSA/RHS & VA Home Purchase Loans
B) Conventional Home Purchase Loans
C) Refinancings
D) Home Improvement Loans
E) Loans on Dwellings For 5+ Families
F) Non-occupant Loans on < 5 Family Dwellings (A B C & D)
G) Loans On Manufactured Home Dwelling (A B C & D)
Number
Average Value
Number
Average Value
Number
Average Value
Number
Average Value
Number
Average Value
Number
Average Value
Number
Average Value
LOANS ORIGINATED
142
$92,240
403
$72,805
222
$88,624
67
$92,146
8
$2,142,561
138
$115,410
10
$46,825
APPLICATIONS APPROVED, NOT ACCEPTED
7
$46,840
72
$58,341
37
$61,968
21
$17,387
0
$0
6
$31,830
20
$46,704
APPLICATIONS DENIED
17
$78,582
147
$54,731
307
$77,051
94
$28,962
0
$0
40
$65,674
52
$36,192
APPLICATIONS WITHDRAWN
8
$76,084
86
$90,724
176
$109,222
32
$170,505
0
$0
24
$125,590
6
$30,600
FILES CLOSED FOR INCOMPLETENESS
2
$104,990
14
$76,726
51
$84,682
0
$0
0
$0
2
$74,990
0
$0
Aggregated Statistics For Year 2004 (Based on 8 full and 6 partial tracts)
A) FHA, FSA/RHS & VA Home Purchase Loans
B) Conventional Home Purchase Loans
C) Refinancings
D) Home Improvement Loans
E) Loans on Dwellings For 5+ Families
F) Non-occupant Loans on < 5 Family Dwellings (A B C & D)
G) Loans On Manufactured Home Dwelling (A B C & D)
Number
Average Value
Number
Average Value
Number
Average Value
Number
Average Value
Number
Average Value
Number
Average Value
Number
Average Value
LOANS ORIGINATED
196
$78,693
332
$67,518
344
$69,650
65
$32,600
1
$5,050,800
146
$53,835
22
$40,105
APPLICATIONS APPROVED, NOT ACCEPTED
10
$89,040
58
$53,957
63
$55,221
5
$29,642
0
$0
12
$52,667
38
$42,886
APPLICATIONS DENIED
13
$81,434
108
$51,439
346
$61,463
102
$26,175
0
$0
37
$46,444
61
$42,046
APPLICATIONS WITHDRAWN
10
$88,739
31
$68,563
245
$71,371
21
$57,027
0
$0
19
$85,576
3
$22,647
FILES CLOSED FOR INCOMPLETENESS
5
$62,240
11
$67,320
33
$68,406
0
$0
0
$0
2
$68,840
0
$0
Aggregated Statistics For Year 2003 (Based on 8 full and 6 partial tracts)
A) FHA, FSA/RHS & VA Home Purchase Loans
B) Conventional Home Purchase Loans
C) Refinancings
D) Home Improvement Loans
E) Loans on Dwellings For 5+ Families
F) Non-occupant Loans on < 5 Family Dwellings (A B C & D)
Number
Average Value
Number
Average Value
Number
Average Value
Number
Average Value
Number
Average Value
Number
Average Value
LOANS ORIGINATED
169
$77,468
268
$76,416
656
$68,062
56
$17,828
5
$2,736,220
124
$56,623
APPLICATIONS APPROVED, NOT ACCEPTED
10
$74,505
31
$58,653
74
$59,511
15
$19,099
0
$0
19
$50,093
APPLICATIONS DENIED
17
$71,871
75
$57,762
283
$62,516
71
$14,947
0
$0
35
$50,248
APPLICATIONS WITHDRAWN
13
$71,375
39
$65,773
217
$68,140
12
$17,676
0
$0
18
$60,585
FILES CLOSED FOR INCOMPLETENESS
0
$0
3
$55,173
21
$62,483
4
$21,642
0
$0
2
$47,555
Aggregated Statistics For Year 2002 (Based on 8 full and 6 partial tracts)
A) FHA, FSA/RHS & VA Home Purchase Loans
B) Conventional Home Purchase Loans
C) Refinancings
D) Home Improvement Loans
E) Loans on Dwellings For 5+ Families
F) Non-occupant Loans on < 5 Family Dwellings (A B C & D)
Number
Average Value
Number
Average Value
Number
Average Value
Number
Average Value
Number
Average Value
Number
Average Value
LOANS ORIGINATED
175
$67,534
279
$78,196
339
$65,284
59
$17,570
1
$2,609,580
122
$70,780
APPLICATIONS APPROVED, NOT ACCEPTED
3
$59,590
57
$68,011
60
$53,216
11
$22,435
0
$0
9
$72,681
APPLICATIONS DENIED
13
$74,808
85
$51,882
233
$45,590
50
$11,271
1
$2,525,400
28
$42,517
APPLICATIONS WITHDRAWN
7
$65,513
18
$59,914
156
$53,351
5
$35,940
0
$0
10
$52,634
FILES CLOSED FOR INCOMPLETENESS
2
$156,530
16
$51,174
21
$54,763
0
$0
1
$4,798,260
2
$59,995
Aggregated Statistics For Year 2001 (Based on 8 full and 6 partial tracts)
A) FHA, FSA/RHS & VA Home Purchase Loans
B) Conventional Home Purchase Loans
C) Refinancings
D) Home Improvement Loans
E) Loans on Dwellings For 5+ Families
F) Non-occupant Loans on < 5 Family Dwellings (A B C & D)
Number
Average Value
Number
Average Value
Number
Average Value
Number
Average Value
Number
Average Value
Number
Average Value
LOANS ORIGINATED
247
$68,157
241
$66,048
211
$65,929
58
$18,645
5
$306,018
87
$57,971
APPLICATIONS APPROVED, NOT ACCEPTED
9
$53,410
67
$34,979
40
$87,612
13
$15,903
0
$0
3
$24,827
APPLICATIONS DENIED
11
$64,313
142
$44,299
166
$48,372
42
$10,462
4
$47,685
23
$31,272
APPLICATIONS WITHDRAWN
12
$64,252
36
$71,814
103
$51,515
7
$13,599
0
$0
10
$53,437
FILES CLOSED FOR INCOMPLETENESS
3
$54,680
8
$54,066
20
$64,706
0
$0
0
$0
0
$0
Aggregated Statistics For Year 2000 (Based on 8 full and 6 partial tracts)
A) FHA, FSA/RHS & VA Home Purchase Loans
B) Conventional Home Purchase Loans
C) Refinancings
D) Home Improvement Loans
E) Loans on Dwellings For 5+ Families
F) Non-occupant Loans on < 5 Family Dwellings (A B C & D)
Number
Average Value
Number
Average Value
Number
Average Value
Number
Average Value
Number
Average Value
Number
Average Value
LOANS ORIGINATED
250
$63,367
209
$58,683
111
$62,544
38
$12,107
2
$2,659,160
54
$41,019
APPLICATIONS APPROVED, NOT ACCEPTED
25
$51,407
60
$47,661
27
$48,141
31
$13,279
0
$0
5
$53,610
APPLICATIONS DENIED
27
$68,262
172
$50,776
69
$57,081
41
$16,419
0
$0
13
$45,109
APPLICATIONS WITHDRAWN
16
$61,028
14
$94,521
51
$49,841
0
$0
0
$0
0
$0
FILES CLOSED FOR INCOMPLETENESS
4
$37,818
16
$41,909
21
$64,804
0
$0
0
$0
4
$52,380
Aggregated Statistics For Year 1999 (Based on 3 full and 5 partial tracts)
A) FHA, FSA/RHS & VA Home Purchase Loans
B) Conventional Home Purchase Loans
C) Refinancings
D) Home Improvement Loans
E) Loans on Dwellings For 5+ Families
F) Non-occupant Loans on < 5 Family Dwellings (A B C & D)
2002 - 2018 National Fire Incident Reporting System (NFIRS) incidents
According to the data from the years 2002 - 2018 the average number of fire incidents per year is 67. The highest number of reported fires - 110 took place in 2003, and the least - 0 in 2009. The data has a declining trend.
When looking into fire subcategories, the most reports belonged to: Structure Fires (43.3%), and Outside Fires (35.3%).
Fire incident types reported to NFIRS in Zip Code 76504


 Nearest zip codes: 76502, 76508, 76579, 76501, 76557, 76513.


 According to the data from the years 2002 - 2018 the average number of fire incidents per year is 67. The highest number of reported fires - 110 took place in 2003, and the least - 0 in 2009. The data has a declining trend.
 When looking into fire subcategories, the most reports belonged to: Structure Fires (43.3%), and Outside Fires (35.3%).