Estimated zip code population in 2022: 3,189 Zip code population in 2010: 2,837 Zip code population in 2000: 2,430
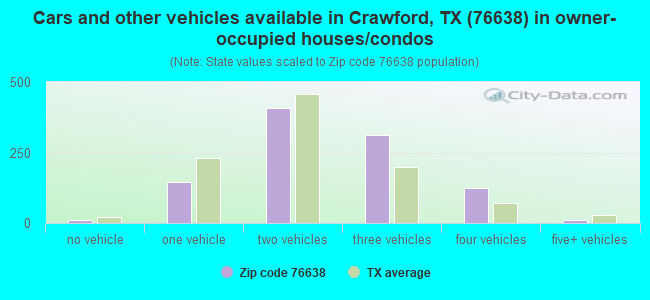
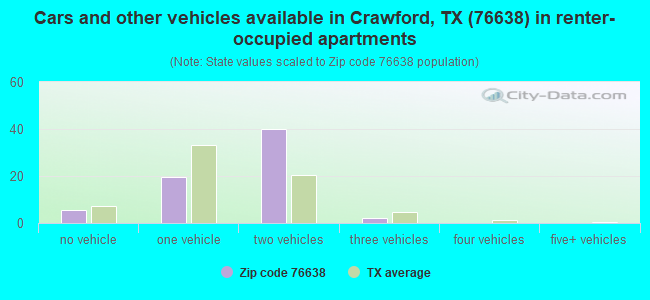
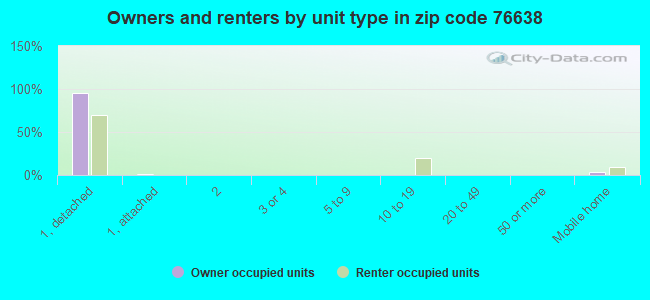
Houses and condos: 1,172 Renter-occupied apartments: 67
% of renters here:
6%
State:
38%
March 2022 cost of living index in zip code 76638: 80.4 (low, U.S. average is 100)
Land area: 82.7 sq. mi. Water area: 0.2 sq. mi.
Population density: 39 people per square mile
(very low).
OSM Map
General Map
Google Map
MSN Map
OSM Map
General Map
Google Map
MSN Map
OSM Map
General Map
Google Map
MSN Map
OSM Map
General Map
Google Map
MSN Map
Please wait while loading the map...
Real estate property taxes paid for housing units in 2022:
This zip code:
1.2% ($4,625)
Texas:
1.5% ($4,050)
Median real estate property taxes paid for housing units with mortgages in 2022: $5,022 (1.1%) Median real estate property taxes paid for housing units with no mortgage in 2022: $4,378 (1.4%)
Business Search- 14 Million verified businesses
Males: 1,615
(50.7%)
Females: 1,573
(49.3%)
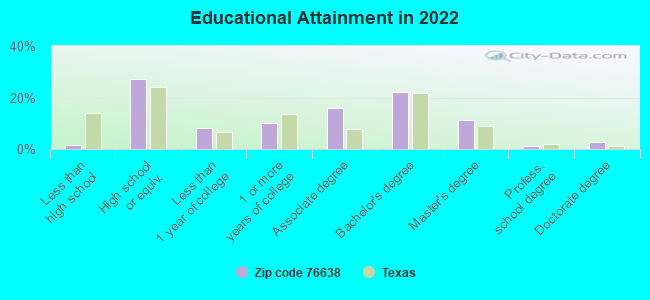
For population 25 years and over in 76638:
High school or higher: 99.4%
Bachelor's degree or higher: 37.8%
Graduate or professional degree: 15.5%
Unemployed: 2.5%
Mean travel time to work (commute): 30.7 minutes
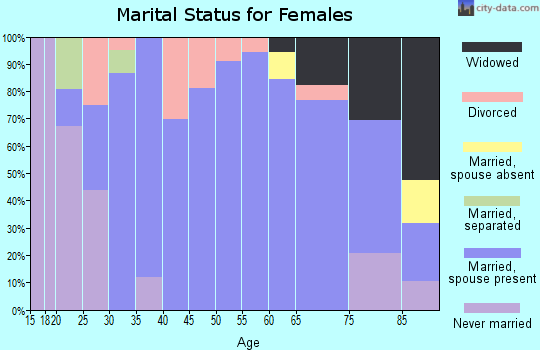
For population 15 years and over in 76638:
Never married: 22.2%
Now married: 66.9%
Separated: 0.4%
Widowed: 4.5%
Divorced: 6.0%
Zip code 76638 compared to state average:
Median household income above state average.
Unemployed percentage below state average.
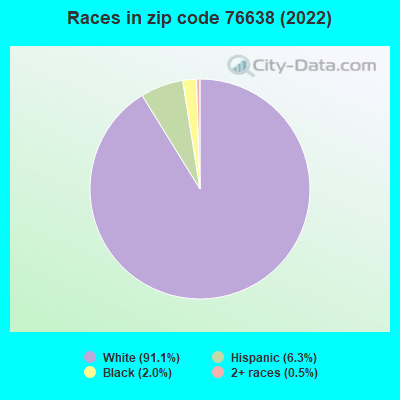
Black race population percentage significantly below state average.
Hispanic race population percentage significantly below state average.
Median age above state average.
Foreign-born population percentage significantly below state average.
Renting percentage significantly below state average.
Length of stay since moving in above state average.
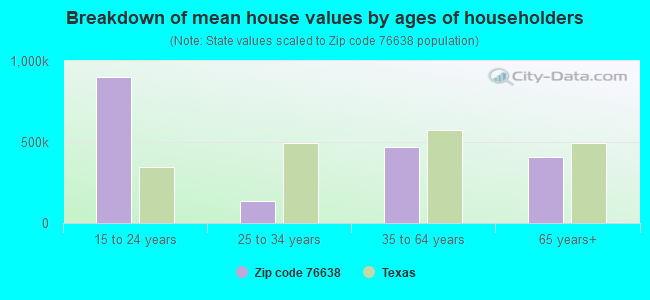
Estimated median house/condo value in 2022: $380,353
76638:
$380,353
Texas:
$275,400
According to our research of Texas and other state lists, there were 5 registered sex offenders living in 76638 zip code as of April 18, 2024. The ratio of all residents to sex offenders in zip code 76638 is 636 to 1. The ratio of registered sex offenders to all residents in this zip code is lower than the state average.
Median resident age:
This zip code:
40.6 years
Texas median age:
35.6 years
Average household size:
This zip code:
2.9 people
Texas:
2.6 people
Averages for the 2020 tax year for zip code 76638, filed in 2021:
Average Adjusted Gross Income (AGI) in 2020: $106,920 (Individual Income Tax Returns)
Here:
$106,920
State:
$77,054
Salary/wage: $83,265 (reported on 78.1% of returns)
Here:
$83,265
State:
$62,766
(% of AGI for various income ranges: 1131.7% for AGIs below $25k, 3569.5% for AGIs $25k-50k, 6549.2% for AGIs $50k-75k, 10033.8% for AGIs $75k-100k, 18193.3% for AGIs $100k-200k, 60910.0% for AGIs over 200k)
Taxable interest for individuals: $2,325 (reported on 44.5% of returns)
This zip code:
$2,325
Texas:
$2,665
(% of AGI for various income ranges: 53.5% for AGIs below $25k, 26.5% for AGIs $25k-50k, 25.8% for AGIs $50k-75k, 275.0% for AGIs $75k-100k, 168.9% for AGIs $100k-200k, 1300.0% for AGIs over 200k)
Ordinary dividends: $8,500 (reported on 26.0% of returns)
Here:
$8,500
State:
$10,044
(% of AGI for various income ranges: 43.5% for AGIs below $25k, 67.0% for AGIs $25k-50k, 35.8% for AGIs $50k-75k, 386.2% for AGIs $75k-100k, 334.4% for AGIs $100k-200k, 3403.3% for AGIs over 200k)
Net capital gain/loss in AGI: +$55,918 (reported on 26.0% of returns)
Here:
+$55,918
State:
+$39,590
(% of AGI for various income ranges: 46.5% for AGIs below $25k, 49.0% for AGIs $25k-50k, 109.2% for AGIs $50k-75k, 270.0% for AGIs $75k-100k, 799.4% for AGIs $100k-200k, 32096.7% for AGIs over 200k)
Profit/loss from business: +$16,638 (reported on 19.9% of returns)
Here:
+$16,638
State:
+$10,888
(% of AGI for various income ranges: 104.8% for AGIs below $25k, 15.0% for AGIs $25k-50k, 65.8% for AGIs $50k-75k, 467.5% for AGIs $75k-100k, 925.0% for AGIs $100k-200k, 4060.0% for AGIs over 200k)
Taxable individual retirement arrangement distribution: $26,259 (reported on 11.6% of returns)
76638:
$26,259
Texas:
$24,740
(% of AGI for various income ranges: 100.0% for AGIs below $25k, 137.5% for AGIs $25k-50k, 533.3% for AGIs $50k-75k, 606.2% for AGIs $75k-100k, 973.3% for AGIs $100k-200k, 1803.3% for AGIs over 200k)
Total itemized deductions: $44,650 (reported on 11.0% of returns)
Here:
$44,650
State:
$40,428
(% of AGI for various income ranges: 889.2% for AGIs $50k-75k, 805.0% for AGIs $100k-200k, 7713.3% for AGIs over 200k)
Charity contributions: $24,650 (reported on 8.2% of returns)
Here:
$24,650
State:
$18,201
(% of AGI for various income ranges: 64.8% for AGIs below $25k, 298.3% for AGIs $100k-200k, 3786.7% for AGIs over 200k)
Taxes paid: $7,627 (reported on 10.3% of returns)
76638:
$7,627
State:
$7,821
(% of AGI for various income ranges: 115.0% for AGIs $50k-75k, 182.2% for AGIs $100k-200k, 1130.0% for AGIs over 200k)
Earned income credit: $2,238 (reported on 8.9% of returns)
Here:
$2,238
State:
$2,584
(% of AGI for various income ranges: 69.1% for AGIs below $25k, 66.0% for AGIs $25k-50k)
Percentage of individuals using paid preparers for their 2020 taxes: 89.7%
Here:
90%
State:
92%
(% for various income ranges: 87.2% for AGIs below $25k, 88.5% for AGIs $25k-50k, 88.9% for AGIs $50k-75k, 92.3% for AGIs $75k-100k, 90.6% for AGIs $100k-200k, 94.4% for AGIs over 200k)
Averages for the 2012 tax year for zip code 76638, filed in 2013:
Average Adjusted Gross Income (AGI) in 2012: $83,678 (Individual Income Tax Returns)
Here:
$83,678
State:
$65,384
Salary/wage: $62,796 (reported on 82.5% of returns)
Here:
$62,796
State:
$52,524
(% of AGI for various income ranges: 74.5% for AGIs below $25k, 80.1% for AGIs $25k-50k, 69.1% for AGIs $50k-75k, 75.7% for AGIs $75k-100k, 79.1% for AGIs $100k-200k, 39.6% for AGIs over 200k)
Taxable interest for individuals: $2,932 (reported on 46.8% of returns)
This zip code:
$2,932
Texas:
$2,372
(% of AGI for various income ranges: 2.4% for AGIs below $25k, 1.6% for AGIs $25k-50k, 1.7% for AGIs $50k-75k, 0.4% for AGIs $75k-100k, 0.6% for AGIs $100k-200k, 2.6% for AGIs over 200k)
Ordinary dividends: $10,303 (reported on 23.0% of returns)
Here:
$10,303
State:
$9,721
(% of AGI for various income ranges: 3.0% for AGIs below $25k, 2.0% for AGIs $25k-50k, 0.9% for AGIs $50k-75k, 0.5% for AGIs $75k-100k, 0.9% for AGIs $100k-200k, 5.4% for AGIs over 200k)
Net capital gain/loss in AGI: +$35,700 (reported on 19.8% of returns)
Here:
+$35,700
State:
+$35,319
(% of AGI for various income ranges: 0.4% for AGIs below $25k, 0.2% for AGIs $50k-75k, 0.4% for AGIs $75k-100k, 0.6% for AGIs $100k-200k, 20.7% for AGIs over 200k)
Profit/loss from business: +$15,652 (reported on 19.8% of returns)
Here:
+$15,652
State:
+$13,732
(% of AGI for various income ranges: 8.7% for AGIs below $25k, 4.5% for AGIs $25k-50k, 4.3% for AGIs $50k-75k, 5.9% for AGIs $75k-100k, 2.2% for AGIs $100k-200k, 3.4% for AGIs over 200k)
Taxable individual retirement arrangement distribution: $19,879 (reported on 11.1% of returns)
76638:
$19,879
Texas:
$19,511
(% of AGI for various income ranges: 3.0% for AGIs below $25k, 3.2% for AGIs $25k-50k, 3.2% for AGIs $50k-75k, 4.2% for AGIs $75k-100k, 5.4% for AGIs $100k-200k)
Total itemized deductions: $25,552 (16% of AGI, reported on 33.3% of returns)
Here:
$25,552
State:
$24,724
Here:
15.6% of AGI
State:
15.9% of AGI
(% of AGI for various income ranges: 9.9% for AGIs below $25k, 8.7% for AGIs $25k-50k, 10.0% for AGIs $50k-75k, 10.8% for AGIs $75k-100k, 12.2% for AGIs $100k-200k, 9.0% for AGIs over 200k)
Charity contributions: $9,026 (reported on 27.8% of returns)
Here:
$9,026
State:
$6,808
(% of AGI for various income ranges: 1.8% for AGIs $25k-50k, 1.7% for AGIs $50k-75k, 1.7% for AGIs $75k-100k, 2.8% for AGIs $100k-200k, 4.4% for AGIs over 200k)
Taxes paid: $6,756 (reported on 32.5% of returns)
76638:
$6,756
State:
$6,921
(% of AGI for various income ranges: 1.9% for AGIs below $25k, 2.1% for AGIs $25k-50k, 2.8% for AGIs $50k-75k, 3.1% for AGIs $75k-100k, 3.7% for AGIs $100k-200k, 1.9% for AGIs over 200k)
Earned income credit: $1,912 (reported on 12.7% of returns)
Here:
$1,912
State:
$2,570
(% of AGI for various income ranges: 5.0% for AGIs below $25k, 1.0% for AGIs $25k-50k)
Percentage of individuals using paid preparers for their 2012 taxes: 53.2%
Here:
53%
State:
51%
(% for various income ranges: 46.5% for AGIs below $25k, 43.5% for AGIs $25k-50k, 58.8% for AGIs $50k-75k, 53.8% for AGIs $75k-100k, 59.1% for AGIs $100k-200k, 87.5% for AGIs over 200k)
Averages for the 2004 tax year for zip code 76638, filed in 2005:
Average Adjusted Gross Income (AGI) in 2004: $67,859 (Individual Income Tax Returns)
Here:
$67,859
State:
$47,881
Salary/wage: $54,247 (reported on 84.1% of returns)
Here:
$54,247
State:
$41,947
(% of AGI for various income ranges: 822.1% for AGIs below $10k, 77.0% for AGIs $10k-25k, 78.2% for AGIs $25k-50k, 79.1% for AGIs $50k-75k, 84.7% for AGIs $75k-100k, 54.4% for AGIs over 100k)
Taxable interest for individuals: $2,103 (reported on 55.1% of returns)
This zip code:
$2,103
Texas:
$2,255
(% of AGI for various income ranges: 57.4% for AGIs below $10k, 5.3% for AGIs $10k-25k, 2.0% for AGIs $25k-50k, 1.7% for AGIs $50k-75k, 0.6% for AGIs $75k-100k, 1.5% for AGIs over 100k)
Taxable dividends: $5,648 (reported on 26.2% of returns)
Here:
$5,648
State:
$4,261
(% of AGI for various income ranges: 61.8% for AGIs below $10k, 1.0% for AGIs $10k-25k, 1.5% for AGIs $25k-50k, 0.6% for AGIs $50k-75k, 0.6% for AGIs $75k-100k, 3.0% for AGIs over 100k)
Net capital gain/loss: +$18,616 (reported on 24.7% of returns)
Here:
+$18,616
State:
+$16,110
(% of AGI for various income ranges: -14.0% for AGIs below $10k, -0.4% for AGIs $10k-25k, 0.1% for AGIs $25k-50k, 0.5% for AGIs $50k-75k, 0.4% for AGIs $75k-100k, 12.0% for AGIs over 100k)
Profit/loss from business: +$14,587 (reported on 21.4% of returns)
Here:
+$14,587
State:
+$11,013
(% of AGI for various income ranges: -38.2% for AGIs below $10k, 5.6% for AGIs $10k-25k, 5.0% for AGIs $25k-50k, 4.1% for AGIs $50k-75k, 2.4% for AGIs $75k-100k, 5.3% for AGIs over 100k)
IRA payment deduction: $3,412 (reported on 3.1% of returns)
76638:
$3,412
Texas:
$3,120
Self-employed pension: $13,636 (reported on 1.0% of returns)
Here:
$13,636
Texas:
$16,401
Total itemized deductions: $20,037 (15% of AGI, reported on 32.5% of returns)
Here:
$20,037
State:
$19,631
Here:
14.9% of AGI
State:
18.9% of AGI
(% of AGI for various income ranges: 9.2% for AGIs $10k-25k, 7.8% for AGIs $25k-50k, 8.2% for AGIs $50k-75k, 10.5% for AGIs $75k-100k, 10.1% for AGIs over 100k)
Charity contributions deductions: $6,124 (4% of AGI, reported on 28.6% of returns)
Here:
$6,124
State:
$4,753
Here:
4.2% of AGI
State:
4.2% of AGI
(% of AGI for various income ranges: 1.3% for AGIs $10k-25k, 1.6% for AGIs $25k-50k, 1.4% for AGIs $50k-75k, 2.2% for AGIs $75k-100k, 3.3% for AGIs over 100k)
Total tax: $12,752 (reported on 80.7% of returns)
76638:
$12,752
State:
$9,058
(% of AGI for various income ranges: 28.7% for AGIs below $10k, 4.4% for AGIs $10k-25k, 6.3% for AGIs $25k-50k, 9.0% for AGIs $50k-75k, 10.3% for AGIs $75k-100k, 20.5% for AGIs over 100k)
Earned income credit: $1,485 (reported on 9.0% of returns)
Here:
$1,485
State:
$2,024
Percentage of individuals using paid preparers for their 2004 taxes: 57.3%
Here:
57%
State:
57%
(% for various income ranges: 51.5% for AGIs below $10k, 53.3% for AGIs $10k-25k, 57.2% for AGIs $25k-50k, 54.6% for AGIs $50k-75k, 63.0% for AGIs $75k-100k, 66.8% for AGIs over 100k)
Likely homosexual households (counted as self-reported same-sex unmarried-partner households)
Lesbian couples: 0.3% of all households
Gay men: 0.0% of all households
Household received Food Stamps/SNAP in the past 12 months: 56 Household did not receive Food Stamps/SNAP in the past 12 months: 1,021
Women who had a birth in the past 12 months: 95 (82 now married, 13 unmarried) Women who did not have a birth in the past 12 months: 568 (339 now married, 226 unmarried)
Housing units in zip code 76638 with a mortgage: 571 (19 second mortgage, 21 both second mortgage and home equity loan) Houses without a mortgage: 49
Median monthly owner costs for units with a mortgage: $2,426 Median monthly owner costs for units without a mortgage: $839
Residents with income below the poverty level in 2022:
This zip code:
5.0%
Whole state:
14.0%
Residents with income below 50% of the poverty level in 2022:
This zip code:
2.8%
Whole state:
7.4%
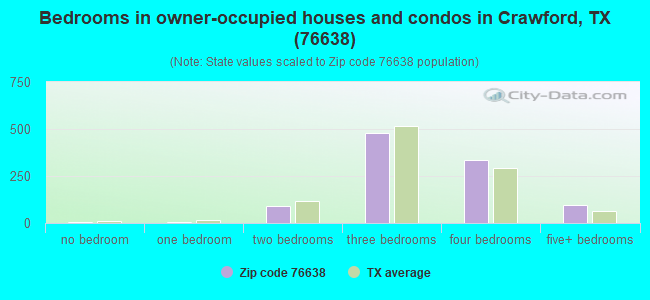
Median number of rooms in houses and condos:
Here:
7.0
State:
6.3
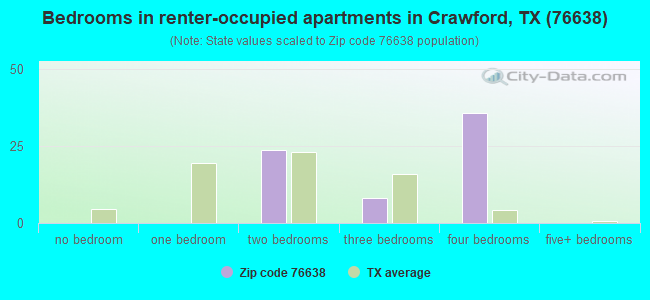
Median number of rooms in apartments:
Here:
5.7
State:
4.0
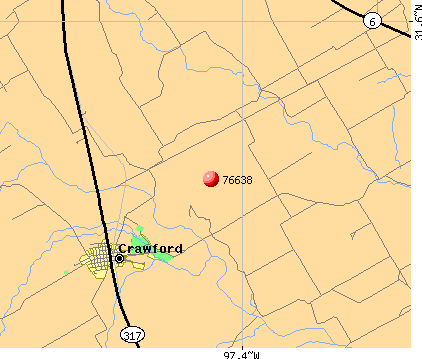
Notable locations in this zip code not listed on our city pages
Notable locations in zip code 76638: Prairie Chapel School (A), Crawford Volunteer Fire Department and Emergency Medical Services (B). Display/hide their locations on the map
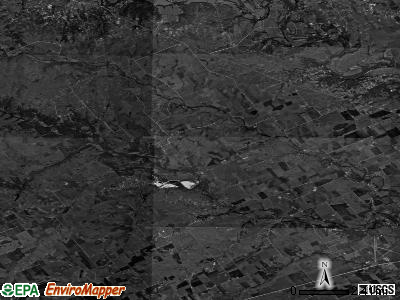
Streams, rivers, and creeks: Bluff Creek (A), Tonk Creek (B), Wasp Creek (C), Schoolhouse Branch (D), Castle Creek (E), Elm Creek (F), Davis Branch (G). Display/hide their locations on the map
In group quarters: 4 (-1 institutionalized population)
Size of family households: 408 2-persons, 213 3-persons, 178 4-persons, 70 5-persons, 69 6-persons, 14 7-or-more-persons
Size of nonfamily households: 103 1-person, 11 2-persons, 2 3-persons
728 married couples with children.
117 single-parent households (27 men, 90 women).
94.7% of residents of 76638 zip code speak English at home.
2.5% of residents speak Spanish at home (70% very well, 12% well, 10% not well, 8% not at all).
2.7% of residents speak other Indo-European language at home (75% very well, 25% not well).
0.1% of residents speak Asian or Pacific Island language at home (100% very well).
Foreign born population: 79 (2.5%) (80.1% of them are naturalized citizens)
This zip code:
2.5%
Whole state:
17.2%
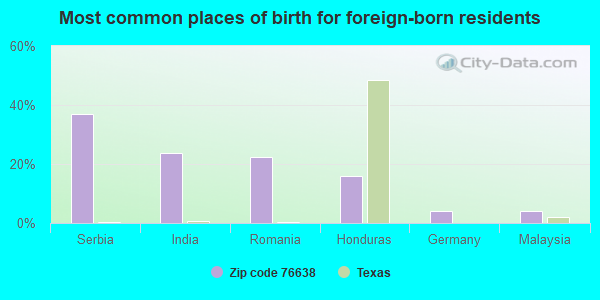
37%Serbia
24%India
22%Romania
16%Honduras
4%Germany
4%Malaysia
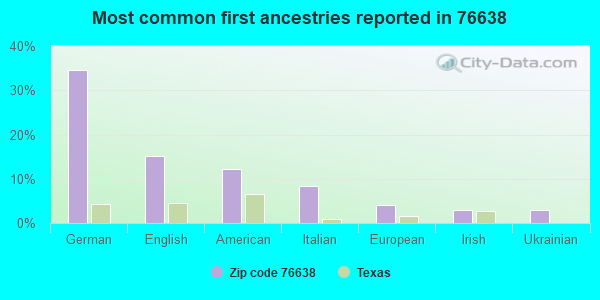
34%German
15%English
12%American
8%Italian
4%European
3%Irish
3%Ukrainian
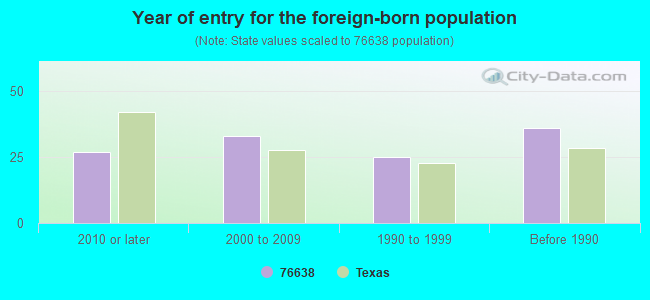
Year of entry for the foreign-born population
272010 or later
332000 to 2009
251990 to 1999
36Before 1990
Housing units lacking complete plumbing facilities: 2.3% Housing units lacking complete kitchen facilities: 5.5%
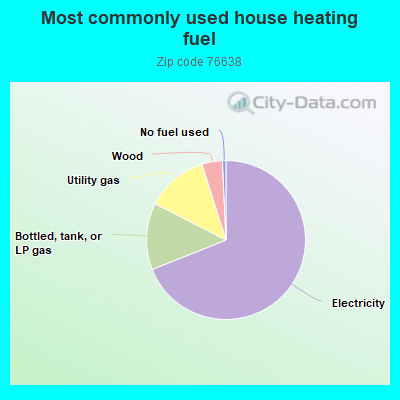
69.1%Electricity
13.6%Bottled, tank, or LP gas
12.6%Utility gas
4.2%Wood
0.7%No fuel used
Population in 1990: 3,473.
Place of birth for U.S.-born residents:
This state: 2,556
Northeast: 6
Midwest: 136
South: 102
West: 244
55% of the 76638 zip code residents lived in the same house 5 years ago. Out of people who lived in different houses, 71% lived in this county. Out of people who lived in different counties, 50% lived in Texas.
89% of the 76638 zip code residents lived in the same house 1 year ago. Out of people who lived in different houses, 44% moved from this county. Out of people who lived in different houses, 45% moved from different county within same state. Out of people who lived in different houses, 2% moved from different state. Out of people who lived in different houses, 9% moved from abroad.
Private vs. public school enrollment:
Students in private schools in grades 1 to 8 (elementary and middle school): 34
Here:
9.1%
Texas:
8.8%
Students in private schools in grades 9 to 12 (high school): 39
Here:
12.0%
Texas:
8.0%
Students in private undergraduate colleges:
Here:
0.0%
Texas:
16.2%
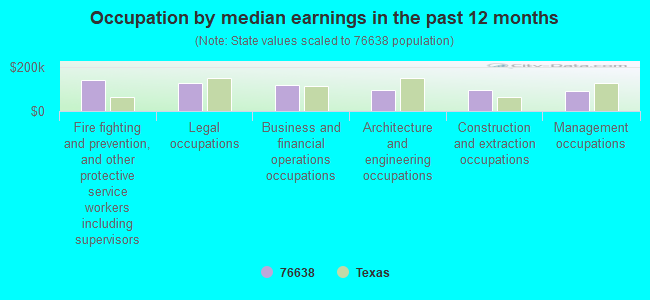
Occupation by median earnings in the past 12 months ($)
142,484Fire fighting and prevention, and other protective service workers including supervisors
128,023Legal occupations
119,950Business and financial operations occupations
93,413Architecture and engineering occupations
93,369Construction and extraction occupations
89,753Management occupations
Top industries in this zip code by the number of employees in 2005:
Construction: Power and Communication Line and Related Structures Construction (50-99 employees: 1 establishment)
Mining: Crushed and Broken Limestone Mining and Quarrying (20-49: 1)
Arts, Entertainment, and Recreation: Fitness and Recreational Sports Centers (10-19: 1, 1-4: 1)
Construction: New Single-Family Housing Construction (except Operative Builders) (5-9: 1, 1-4: 1)
Construction: Water and Sewer Line and Related Structures Construction (5-9: 1)
Construction: Oil and Gas Pipeline and Related Structures Construction (5-9: 1)
Other Services (except Public Administration): Automotive Transmission Repair (5-9: 1)
Other Services (except Public Administration): Religious Organizations (1-4: 3)
Construction: Plumbing, Heating, and Air-Conditioning Contractors (1-4: 2)
Fatal accident statistics in 2014:
Fatal accident count: 1
Vehicles involved in fatal accidents: 1
Fatal accidents caused by drunken drivers: 1
Fatalities: 1
Persons involved in fatal accidents: 1
Pedestrians involved in fatal accidents: 0
Fatal accident statistics in 2013:
Fatal accident count: 2
Vehicles involved in fatal accidents: 3
Fatal accidents caused by drunken drivers: 1
Fatalities: 2
Persons involved in fatal accidents: 3
Pedestrians involved in fatal accidents: 0
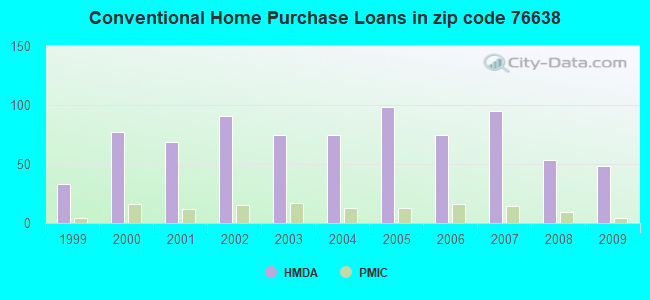
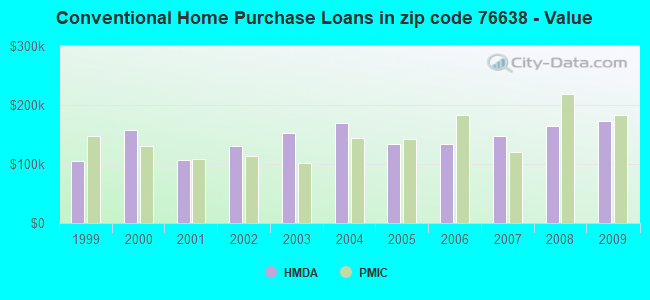
Home Mortgage Disclosure Act Aggregated Statistics For Year 2009 (Based on 2 partial tracts)
A) FHA, FSA/RHS & VA Home Purchase Loans
B) Conventional Home Purchase Loans
C) Refinancings
D) Home Improvement Loans
F) Non-occupant Loans on < 5 Family Dwellings (A B C & D)
G) Loans On Manufactured Home Dwelling (A B C & D)
Number
Average Value
Number
Average Value
Number
Average Value
Number
Average Value
Number
Average Value
Number
Average Value
LOANS ORIGINATED
24
$153,702
48
$173,006
98
$156,998
17
$49,893
11
$147,186
4
$28,310
APPLICATIONS APPROVED, NOT ACCEPTED
0
$0
2
$217,760
14
$208,427
3
$42,100
1
$54,440
0
$0
APPLICATIONS DENIED
1
$189,450
3
$125,573
33
$180,345
3
$88,193
1
$43,550
2
$24,500
APPLICATIONS WITHDRAWN
1
$112,150
3
$276,193
29
$160,955
1
$130,660
1
$178,560
0
$0
FILES CLOSED FOR INCOMPLETENESS
0
$0
1
$342,970
1
$77,300
0
$0
0
$0
0
$0
Aggregated Statistics For Year 2008 (Based on 2 partial tracts)
A) FHA, FSA/RHS & VA Home Purchase Loans
B) Conventional Home Purchase Loans
C) Refinancings
D) Home Improvement Loans
E) Loans on Dwellings For 5+ Families
F) Non-occupant Loans on < 5 Family Dwellings (A B C & D)
G) Loans On Manufactured Home Dwelling (A B C & D)
Number
Average Value
Number
Average Value
Number
Average Value
Number
Average Value
Number
Average Value
Number
Average Value
Number
Average Value
LOANS ORIGINATED
20
$145,736
53
$163,710
51
$155,079
20
$56,400
1
$540,040
14
$133,222
3
$52,627
APPLICATIONS APPROVED, NOT ACCEPTED
1
$175,300
3
$78,757
4
$197,345
0
$0
0
$0
0
$0
0
$0
APPLICATIONS DENIED
3
$135,373
2
$125,210
25
$130,482
11
$47,115
0
$0
0
$0
0
$0
APPLICATIONS WITHDRAWN
3
$136,827
3
$158,963
9
$84,321
0
$0
0
$0
0
$0
0
$0
FILES CLOSED FOR INCOMPLETENESS
1
$111,060
1
$87,100
0
$0
0
$0
0
$0
0
$0
0
$0
Aggregated Statistics For Year 2007 (Based on 2 partial tracts)
A) FHA, FSA/RHS & VA Home Purchase Loans
B) Conventional Home Purchase Loans
C) Refinancings
D) Home Improvement Loans
F) Non-occupant Loans on < 5 Family Dwellings (A B C & D)
G) Loans On Manufactured Home Dwelling (A B C & D)
Number
Average Value
Number
Average Value
Number
Average Value
Number
Average Value
Number
Average Value
Number
Average Value
LOANS ORIGINATED
15
$130,365
95
$147,767
42
$162,465
17
$111,634
10
$231,043
7
$34,064
APPLICATIONS APPROVED, NOT ACCEPTED
0
$0
8
$167,131
3
$180,013
4
$32,935
0
$0
0
$0
APPLICATIONS DENIED
3
$111,783
11
$96,408
22
$123,876
17
$62,062
3
$117,590
3
$43,553
APPLICATIONS WITHDRAWN
5
$139,584
11
$150,848
19
$136,215
1
$30,490
0
$0
2
$92,005
FILES CLOSED FOR INCOMPLETENESS
0
$0
5
$146,552
9
$174,450
2
$57,705
0
$0
0
$0
Aggregated Statistics For Year 2006 (Based on 2 partial tracts)
A) FHA, FSA/RHS & VA Home Purchase Loans
B) Conventional Home Purchase Loans
C) Refinancings
D) Home Improvement Loans
F) Non-occupant Loans on < 5 Family Dwellings (A B C & D)
G) Loans On Manufactured Home Dwelling (A B C & D)
Number
Average Value
Number
Average Value
Number
Average Value
Number
Average Value
Number
Average Value
Number
Average Value
LOANS ORIGINATED
9
$137,068
75
$134,285
51
$155,805
16
$44,709
12
$83,293
3
$114,687
APPLICATIONS APPROVED, NOT ACCEPTED
0
$0
7
$97,214
9
$111,300
3
$31,213
0
$0
3
$41,737
APPLICATIONS DENIED
1
$60,970
10
$85,362
41
$110,633
11
$60,181
7
$94,570
4
$57,435
APPLICATIONS WITHDRAWN
0
$0
12
$154,247
28
$129,606
4
$48,995
1
$173,120
0
$0
FILES CLOSED FOR INCOMPLETENESS
0
$0
3
$37,747
7
$116,190
0
$0
0
$0
0
$0
Aggregated Statistics For Year 2005 (Based on 2 partial tracts)
A) FHA, FSA/RHS & VA Home Purchase Loans
B) Conventional Home Purchase Loans
C) Refinancings
D) Home Improvement Loans
F) Non-occupant Loans on < 5 Family Dwellings (A B C & D)
G) Loans On Manufactured Home Dwelling (A B C & D)
Number
Average Value
Number
Average Value
Number
Average Value
Number
Average Value
Number
Average Value
Number
Average Value
LOANS ORIGINATED
15
$117,445
98
$133,567
70
$152,510
28
$50,162
11
$86,213
3
$59,883
APPLICATIONS APPROVED, NOT ACCEPTED
1
$141,540
11
$74,633
11
$119,570
7
$33,909
1
$22,860
1
$97,990
APPLICATIONS DENIED
1
$167,680
20
$109,914
41
$132,754
15
$51,754
1
$130,660
8
$69,275
APPLICATIONS WITHDRAWN
0
$0
9
$134,648
29
$152,770
5
$383,694
0
$0
0
$0
FILES CLOSED FOR INCOMPLETENESS
0
$0
1
$130,660
17
$152,881
1
$163,320
0
$0
0
$0
Aggregated Statistics For Year 2004 (Based on 2 partial tracts)
A) FHA, FSA/RHS & VA Home Purchase Loans
B) Conventional Home Purchase Loans
C) Refinancings
D) Home Improvement Loans
F) Non-occupant Loans on < 5 Family Dwellings (A B C & D)
G) Loans On Manufactured Home Dwelling (A B C & D)
Number
Average Value
Number
Average Value
Number
Average Value
Number
Average Value
Number
Average Value
Number
Average Value
LOANS ORIGINATED
10
$115,739
75
$169,432
110
$118,630
30
$48,270
10
$116,284
4
$102,348
APPLICATIONS APPROVED, NOT ACCEPTED
2
$141,545
7
$90,370
15
$103,727
3
$30,123
0
$0
3
$47,543
APPLICATIONS DENIED
3
$95,090
15
$80,789
44
$84,902
13
$34,758
0
$0
10
$62,388
APPLICATIONS WITHDRAWN
1
$124,120
9
$160,659
39
$111,700
4
$47,908
2
$191,630
0
$0
FILES CLOSED FOR INCOMPLETENESS
0
$0
1
$195,980
26
$107,037
0
$0
0
$0
0
$0
Aggregated Statistics For Year 2003 (Based on 2 partial tracts)
A) FHA, FSA/RHS & VA Home Purchase Loans
B) Conventional Home Purchase Loans
C) Refinancings
D) Home Improvement Loans
F) Non-occupant Loans on < 5 Family Dwellings (A B C & D)
Number
Average Value
Number
Average Value
Number
Average Value
Number
Average Value
Number
Average Value
LOANS ORIGINATED
10
$105,614
75
$153,318
194
$110,827
29
$36,043
7
$108,103
APPLICATIONS APPROVED, NOT ACCEPTED
1
$161,140
0
$0
22
$111,602
1
$32,660
0
$0
APPLICATIONS DENIED
1
$118,680
11
$64,735
69
$102,331
11
$45,334
3
$24,317
APPLICATIONS WITHDRAWN
4
$92,275
8
$120,312
63
$118,904
1
$32,660
0
$0
FILES CLOSED FOR INCOMPLETENESS
1
$72,950
1
$337,530
3
$128,480
0
$0
0
$0
Aggregated Statistics For Year 2002 (Based on 2 partial tracts)
A) FHA, FSA/RHS & VA Home Purchase Loans
B) Conventional Home Purchase Loans
C) Refinancings
D) Home Improvement Loans
F) Non-occupant Loans on < 5 Family Dwellings (A B C & D)
Number
Average Value
Number
Average Value
Number
Average Value
Number
Average Value
Number
Average Value
LOANS ORIGINATED
16
$103,096
91
$130,776
147
$130,812
20
$21,122
10
$54,113
APPLICATIONS APPROVED, NOT ACCEPTED
0
$0
3
$66,780
13
$84,089
1
$35,930
0
$0
APPLICATIONS DENIED
5
$96,250
13
$63,318
32
$99,285
5
$18,510
3
$73,313
APPLICATIONS WITHDRAWN
1
$80,570
7
$115,257
11
$133,526
1
$21,780
1
$21,780
FILES CLOSED FOR INCOMPLETENESS
1
$46,820
3
$348,780
12
$81,569
0
$0
0
$0
Aggregated Statistics For Year 2001 (Based on 2 partial tracts)
A) FHA, FSA/RHS & VA Home Purchase Loans
B) Conventional Home Purchase Loans
C) Refinancings
D) Home Improvement Loans
F) Non-occupant Loans on < 5 Family Dwellings (A B C & D)
Number
Average Value
Number
Average Value
Number
Average Value
Number
Average Value
Number
Average Value
LOANS ORIGINATED
12
$79,028
69
$106,276
83
$117,630
16
$31,439
11
$53,747
APPLICATIONS APPROVED, NOT ACCEPTED
0
$0
12
$70,318
7
$51,484
2
$21,230
2
$27,765
APPLICATIONS DENIED
2
$88,195
30
$69,139
21
$74,401
7
$12,754
1
$88,190
APPLICATIONS WITHDRAWN
0
$0
5
$85,798
12
$70,500
1
$41,370
1
$74,040
FILES CLOSED FOR INCOMPLETENESS
0
$0
2
$205,785
1
$87,100
1
$32,660
0
$0
Aggregated Statistics For Year 2000 (Based on 2 partial tracts)
A) FHA, FSA/RHS & VA Home Purchase Loans
B) Conventional Home Purchase Loans
C) Refinancings
D) Home Improvement Loans
F) Non-occupant Loans on < 5 Family Dwellings (A B C & D)
Number
Average Value
Number
Average Value
Number
Average Value
Number
Average Value
Number
Average Value
LOANS ORIGINATED
10
$82,531
77
$156,886
19
$126,014
20
$32,120
4
$56,345
APPLICATIONS APPROVED, NOT ACCEPTED
0
$0
11
$47,314
9
$219,212
3
$29,033
1
$63,150
APPLICATIONS DENIED
0
$0
34
$80,988
5
$39,850
8
$12,112
0
$0
APPLICATIONS WITHDRAWN
1
$81,660
2
$267,300
7
$85,393
0
$0
0
$0
FILES CLOSED FOR INCOMPLETENESS
0
$0
2
$76,215
4
$81,932
0
$0
0
$0
Aggregated Statistics For Year 1999 (Based on 1 partial tract)
A) FHA, FSA/RHS & VA Home Purchase Loans
B) Conventional Home Purchase Loans
C) Refinancings
D) Home Improvement Loans
F) Non-occupant Loans on < 5 Family Dwellings (A B C & D)


 Nearest zip codes: 76657, 76689, 76561, 76712, 76633, 76708.