Estimated zip code population in 2022: 12,486 Zip code population in 2010: 9,307 Zip code population in 2000: 8,654
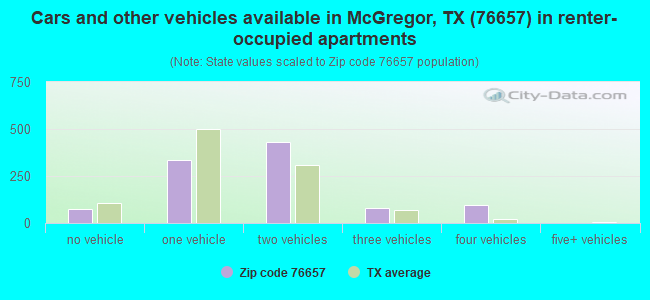
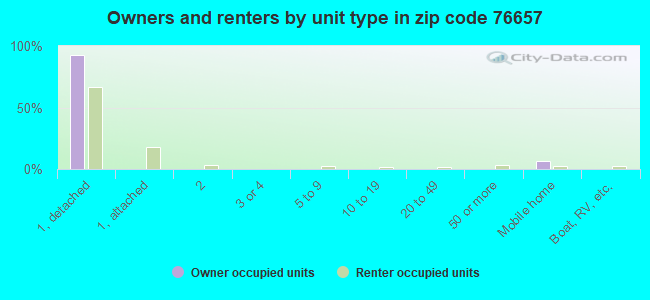
Houses and condos: 4,562 Renter-occupied apartments: 1,022
% of renters here:
24%
State:
38%
March 2022 cost of living index in zip code 76657: 86.2 (less than average, U.S. average is 100)
Land area: 106.3 sq. mi. Water area: 0.1 sq. mi.
Population density: 117 people per square mile
(very low).
OSM Map
General Map
Google Map
MSN Map
OSM Map
General Map
Google Map
MSN Map
OSM Map
General Map
Google Map
MSN Map
OSM Map
General Map
Google Map
MSN Map
Please wait while loading the map...
Real estate property taxes paid for housing units in 2022:
This zip code:
1.3% ($5,039)
Texas:
1.5% ($4,050)
Median real estate property taxes paid for housing units with mortgages in 2022: $5,736 (1.5%) Median real estate property taxes paid for housing units with no mortgage in 2022: $4,743 (1.2%)
Estimated median house/condo value in 2022: $395,396
76657:
$395,396
Texas:
$275,400
According to our research of Texas and other state lists, there were 22 registered sex offenders living in 76657 zip code as of April 18, 2024. The ratio of all residents to sex offenders in zip code 76657 is 433 to 1. The ratio of registered sex offenders to all residents in this zip code is near the state average.
Median resident age:
This zip code:
38.1 years
Texas median age:
35.6 years
Average household size:
This zip code:
2.9 people
Texas:
2.6 people
Averages for the 2020 tax year for zip code 76657, filed in 2021:
Average Adjusted Gross Income (AGI) in 2020: $100,434 (Individual Income Tax Returns)
Here:
$100,434
State:
$77,054
Salary/wage: $79,270 (reported on 82.3% of returns)
Here:
$79,270
State:
$62,766
(% of AGI for various income ranges: 1262.1% for AGIs below $25k, 3612.4% for AGIs $25k-50k, 6347.9% for AGIs $50k-75k, 9305.9% for AGIs $75k-100k, 17931.8% for AGIs $100k-200k, 76731.5% for AGIs over 200k)
Taxable interest for individuals: $2,503 (reported on 33.8% of returns)
This zip code:
$2,503
Texas:
$2,665
(% of AGI for various income ranges: 19.1% for AGIs below $25k, 24.0% for AGIs $25k-50k, 58.1% for AGIs $50k-75k, 140.3% for AGIs $75k-100k, 170.7% for AGIs $100k-200k, 1255.0% for AGIs over 200k)
Ordinary dividends: $9,949 (reported on 20.3% of returns)
Here:
$9,949
State:
$10,044
(% of AGI for various income ranges: 30.4% for AGIs below $25k, 34.8% for AGIs $25k-50k, 52.1% for AGIs $50k-75k, 154.8% for AGIs $75k-100k, 367.6% for AGIs $100k-200k, 3760.5% for AGIs over 200k)
Net capital gain/loss in AGI: +$36,037 (reported on 19.0% of returns)
Here:
+$36,037
State:
+$39,590
(% of AGI for various income ranges: 16.4% for AGIs below $25k, 30.8% for AGIs $25k-50k, 67.1% for AGIs $50k-75k, 156.9% for AGIs $75k-100k, 514.9% for AGIs $100k-200k, 16053.0% for AGIs over 200k)
Profit/loss from business: +$17,572 (reported on 18.2% of returns)
Here:
+$17,572
State:
+$10,888
(% of AGI for various income ranges: 130.4% for AGIs below $25k, 171.7% for AGIs $25k-50k, 311.0% for AGIs $50k-75k, 470.0% for AGIs $75k-100k, 857.6% for AGIs $100k-200k, 3443.0% for AGIs over 200k)
Taxable individual retirement arrangement distribution: $28,475 (reported on 9.2% of returns)
76657:
$28,475
Texas:
$24,740
(% of AGI for various income ranges: 70.4% for AGIs below $25k, 69.2% for AGIs $25k-50k, 199.2% for AGIs $50k-75k, 362.4% for AGIs $75k-100k, 1000.9% for AGIs $100k-200k, 2856.0% for AGIs over 200k)
Self-employed (Keogh) retirement plans: $34,000 (reported on 0.4% of returns)
76657:
$34,000
Texas:
$29,298
(% of AGI for various income ranges: 151.1% for AGIs $100k-200k)
Total itemized deductions: $45,495 (reported on 10.9% of returns)
Here:
$45,495
State:
$40,428
(% of AGI for various income ranges: 54.5% for AGIs below $25k, 93.6% for AGIs $25k-50k, 215.6% for AGIs $50k-75k, 426.9% for AGIs $75k-100k, 1022.7% for AGIs $100k-200k, 8779.0% for AGIs over 200k)
Charity contributions: $23,767 (reported on 9.4% of returns)
Here:
$23,767
State:
$18,201
(% of AGI for various income ranges: 17.6% for AGIs $25k-50k, 30.6% for AGIs $50k-75k, 131.0% for AGIs $75k-100k, 347.3% for AGIs $100k-200k, 4694.5% for AGIs over 200k)
Taxes paid: $8,512 (reported on 10.7% of returns)
76657:
$8,512
State:
$7,821
(% of AGI for various income ranges: 27.8% for AGIs $25k-50k, 49.2% for AGIs $50k-75k, 90.0% for AGIs $75k-100k, 282.7% for AGIs $100k-200k, 1367.0% for AGIs over 200k)
Earned income credit: $2,397 (reported on 15.2% of returns)
Here:
$2,397
State:
$2,584
(% of AGI for various income ranges: 101.0% for AGIs below $25k, 79.1% for AGIs $25k-50k, 2.5% for AGIs $50k-75k)
Percentage of individuals using paid preparers for their 2020 taxes: 92.9%
Here:
93%
State:
92%
(% for various income ranges: 91.8% for AGIs below $25k, 94.1% for AGIs $25k-50k, 93.8% for AGIs $50k-75k, 90.9% for AGIs $75k-100k, 93.8% for AGIs $100k-200k, 92.6% for AGIs over 200k)
Averages for the 2012 tax year for zip code 76657, filed in 2013:
Average Adjusted Gross Income (AGI) in 2012: $76,690 (Individual Income Tax Returns)
Here:
$76,690
State:
$65,384
Salary/wage: $63,166 (reported on 83.5% of returns)
Here:
$63,166
State:
$52,524
(% of AGI for various income ranges: 74.8% for AGIs below $25k, 80.6% for AGIs $25k-50k, 77.2% for AGIs $50k-75k, 72.5% for AGIs $75k-100k, 76.9% for AGIs $100k-200k, 58.7% for AGIs over 200k)
Taxable interest for individuals: $2,020 (reported on 34.9% of returns)
This zip code:
$2,020
Texas:
$2,372
(% of AGI for various income ranges: 1.3% for AGIs below $25k, 0.6% for AGIs $25k-50k, 0.6% for AGIs $50k-75k, 1.2% for AGIs $75k-100k, 0.6% for AGIs $100k-200k, 1.1% for AGIs over 200k)
Ordinary dividends: $7,441 (reported on 18.7% of returns)
Here:
$7,441
State:
$9,721
(% of AGI for various income ranges: 1.3% for AGIs below $25k, 0.6% for AGIs $25k-50k, 1.0% for AGIs $50k-75k, 1.0% for AGIs $75k-100k, 0.8% for AGIs $100k-200k, 3.0% for AGIs over 200k)
Net capital gain/loss in AGI: +$19,490 (reported on 16.3% of returns)
Here:
+$19,490
State:
+$35,319
(% of AGI for various income ranges: 0.2% for AGIs below $25k, 0.7% for AGIs $25k-50k, 0.5% for AGIs $75k-100k, 1.5% for AGIs $100k-200k, 8.3% for AGIs over 200k)
Profit/loss from business: +$18,217 (reported on 18.2% of returns)
Here:
+$18,217
State:
+$13,732
(% of AGI for various income ranges: 7.6% for AGIs below $25k, 3.6% for AGIs $25k-50k, 1.9% for AGIs $50k-75k, 4.0% for AGIs $75k-100k, 3.1% for AGIs $100k-200k, 5.2% for AGIs over 200k)
Taxable individual retirement arrangement distribution: $15,365 (reported on 11.7% of returns)
76657:
$15,365
Texas:
$19,511
(% of AGI for various income ranges: 3.5% for AGIs below $25k, 2.4% for AGIs $25k-50k, 2.9% for AGIs $50k-75k, 3.4% for AGIs $75k-100k, 3.5% for AGIs $100k-200k, 1.3% for AGIs over 200k)
Self-employment retirement plans: $23,475 (reported on 1.0% of returns)
76657:
$23,475
Texas:
$23,938
Total itemized deductions: $27,058 (14% of AGI, reported on 27.3% of returns)
Here:
$27,058
State:
$24,724
Here:
14.3% of AGI
State:
15.9% of AGI
(% of AGI for various income ranges: 5.0% for AGIs below $25k, 6.2% for AGIs $25k-50k, 8.5% for AGIs $50k-75k, 11.6% for AGIs $75k-100k, 13.2% for AGIs $100k-200k, 9.2% for AGIs over 200k)
Charity contributions: $8,587 (reported on 22.7% of returns)
Here:
$8,587
State:
$6,808
(% of AGI for various income ranges: 0.5% for AGIs below $25k, 1.0% for AGIs $25k-50k, 1.6% for AGIs $50k-75k, 2.2% for AGIs $75k-100k, 3.1% for AGIs $100k-200k, 3.2% for AGIs over 200k)
Taxes paid: $8,410 (reported on 26.6% of returns)
76657:
$8,410
State:
$6,921
(% of AGI for various income ranges: 0.9% for AGIs below $25k, 2.1% for AGIs $25k-50k, 2.1% for AGIs $50k-75k, 3.3% for AGIs $75k-100k, 4.5% for AGIs $100k-200k, 2.7% for AGIs over 200k)
Earned income credit: $2,425 (reported on 19.1% of returns)
Here:
$2,425
State:
$2,570
(% of AGI for various income ranges: 7.2% for AGIs below $25k, 1.5% for AGIs $25k-50k)
Percentage of individuals using paid preparers for their 2012 taxes: 51.2%
Here:
51%
State:
51%
(% for various income ranges: 48.4% for AGIs below $25k, 50.0% for AGIs $25k-50k, 48.9% for AGIs $50k-75k, 48.4% for AGIs $75k-100k, 51.0% for AGIs $100k-200k, 76.7% for AGIs over 200k)
Averages for the 2004 tax year for zip code 76657, filed in 2005:
Average Adjusted Gross Income (AGI) in 2004: $53,909 (Individual Income Tax Returns)
Here:
$53,909
State:
$47,881
Salary/wage: $48,773 (reported on 85.3% of returns)
Here:
$48,773
State:
$41,947
(% of AGI for various income ranges: 124.2% for AGIs below $10k, 81.0% for AGIs $10k-25k, 82.9% for AGIs $25k-50k, 78.4% for AGIs $50k-75k, 82.3% for AGIs $75k-100k, 72.0% for AGIs over 100k)
Taxable interest for individuals: $1,903 (reported on 40.7% of returns)
This zip code:
$1,903
Texas:
$2,255
(% of AGI for various income ranges: 6.0% for AGIs below $10k, 1.9% for AGIs $10k-25k, 1.4% for AGIs $25k-50k, 1.7% for AGIs $50k-75k, 0.8% for AGIs $75k-100k, 1.3% for AGIs over 100k)
Taxable dividends: $2,947 (reported on 21.2% of returns)
Here:
$2,947
State:
$4,261
(% of AGI for various income ranges: 6.4% for AGIs below $10k, 0.8% for AGIs $10k-25k, 1.0% for AGIs $25k-50k, 0.8% for AGIs $50k-75k, 1.7% for AGIs $75k-100k, 1.1% for AGIs over 100k)
Net capital gain/loss: +$12,182 (reported on 19.5% of returns)
Here:
+$12,182
State:
+$16,110
(% of AGI for various income ranges: -2.9% for AGIs below $10k, 0.6% for AGIs $10k-25k, 0.6% for AGIs $25k-50k, 1.2% for AGIs $50k-75k, 0.6% for AGIs $75k-100k, 8.2% for AGIs over 100k)
Profit/loss from business: +$13,114 (reported on 14.8% of returns)
Here:
+$13,114
State:
+$11,013
(% of AGI for various income ranges: 5.4% for AGIs below $10k, 3.7% for AGIs $10k-25k, 2.6% for AGIs $25k-50k, 2.5% for AGIs $50k-75k, 3.4% for AGIs $75k-100k, 4.2% for AGIs over 100k)
IRA payment deduction: $2,989 (reported on 2.5% of returns)
76657:
$2,989
Texas:
$3,120
(% of AGI for various income ranges: 0.2% for AGIs $10k-25k, 0.3% for AGIs $25k-50k, 0.4% for AGIs $50k-75k, 0.1% for AGIs over 100k)
Self-employed pension: $18,875 (reported on 0.7% of returns)
Here:
$18,875
Texas:
$16,401
Total itemized deductions: $22,565 (17% of AGI, reported on 22.9% of returns)
Here:
$22,565
State:
$19,631
Here:
17.0% of AGI
State:
18.9% of AGI
(% of AGI for various income ranges: 12.4% for AGIs below $10k, 5.4% for AGIs $10k-25k, 6.5% for AGIs $25k-50k, 7.6% for AGIs $50k-75k, 13.7% for AGIs $75k-100k, 10.8% for AGIs over 100k)
Charity contributions deductions: $7,309 (5% of AGI, reported on 20.1% of returns)
Here:
$7,309
State:
$4,753
Here:
5.1% of AGI
State:
4.2% of AGI
(% of AGI for various income ranges: 0.9% for AGIs below $10k, 0.7% for AGIs $10k-25k, 1.3% for AGIs $25k-50k, 1.9% for AGIs $50k-75k, 2.4% for AGIs $75k-100k, 3.8% for AGIs over 100k)
Total tax: $10,991 (reported on 70.6% of returns)
76657:
$10,991
State:
$9,058
(% of AGI for various income ranges: 3.1% for AGIs below $10k, 3.2% for AGIs $10k-25k, 6.2% for AGIs $25k-50k, 8.7% for AGIs $50k-75k, 10.3% for AGIs $75k-100k, 21.6% for AGIs over 100k)
Earned income credit: $1,850 (reported on 18.8% of returns)
Here:
$1,850
State:
$2,024
Percentage of individuals using paid preparers for their 2004 taxes: 55.5%
Here:
55%
State:
57%
(% for various income ranges: 51.7% for AGIs below $10k, 55.7% for AGIs $10k-25k, 57.5% for AGIs $25k-50k, 53.2% for AGIs $50k-75k, 54.2% for AGIs $75k-100k, 61.6% for AGIs over 100k)
Likely homosexual households (counted as self-reported same-sex unmarried-partner households)
Lesbian couples: 0.3% of all households
Gay men: 0.0% of all households
Household received Food Stamps/SNAP in the past 12 months: 389 Household did not receive Food Stamps/SNAP in the past 12 months: 3,882
Women who had a birth in the past 12 months: 225 (229 now married, 0 unmarried) Women who did not have a birth in the past 12 months: 2,502 (1,161 now married, 1,339 unmarried)
Housing units in zip code 76657 with a mortgage: 1,620 (78 second mortgage, 84 both second mortgage and home equity loan) Median monthly owner costs for units with a mortgage: $2,333 Median monthly owner costs for units without a mortgage: $852
Residents with income below the poverty level in 2022:
This zip code:
7.6%
Whole state:
14.0%
Residents with income below 50% of the poverty level in 2022:
This zip code:
2.4%
Whole state:
7.4%
Median number of rooms in houses and condos:
Here:
7.2
State:
6.3
Median number of rooms in apartments:
Here:
4.6
State:
4.0
Notable locations in this zip code not listed on our city pages
Notable locations in zip code 76657: Val Verde Camp (A), McGregor Volunteer Fire Department (B), Texas Forest Service - McGregor Office (C), McGregor Volunteer Emergency Medical Service (D), Brown-Mann House (E). Display/hide their locations on the map
Churches in zip code 76657 include: Harris Creek Church (A), Roberson Chapel African Methodist Episcopal Church (B), Pleasant Hill Baptist Church (C), Harris Creek Baptist Church (D), First Baptist Church of McGregor (E), College Avenue Baptist Church (F), Mc Gregor United Pentecostal Church (G), Zion Lutheran Church of McGregor (H), Church of God (I). Display/hide their locations on the map
Reservoirs: Soil Conservation Service Site 1 Reservoir (A), Soil Conservation Service Site 17 Reservoir (B), Soil Conservation Service Site 19 Reservoir (C). Display/hide their locations on the map
In group quarters: 134 (-1 institutionalized population)
Size of family households: 1,469 2-persons, 509 3-persons, 732 4-persons, 435 5-persons, 150 6-persons, 72 7-or-more-persons
Size of nonfamily households: 694 1-person, 191 2-persons
2,148 married couples with children.
806 single-parent households (361 men, 445 women).
82.6% of residents of 76657 zip code speak English at home.
16.8% of residents speak Spanish at home (62% very well, 16% well, 9% not well, 13% not at all).
0.4% of residents speak other Indo-European language at home (55% very well, 45% well).
Foreign born population: 905 (7.3%) (12.7% of them are naturalized citizens)
This zip code:
7.3%
Whole state:
17.2%
89%Honduras
2%Bhutan
2%France
1%Sweden
1%Barbados
17%English
14%German
5%American
4%Irish
2%Italian
2%Scottish
2%Scotch-Irish
Year of entry for the foreign-born population
562010 or later
3322000 to 2009
1551990 to 1999
380Before 1990
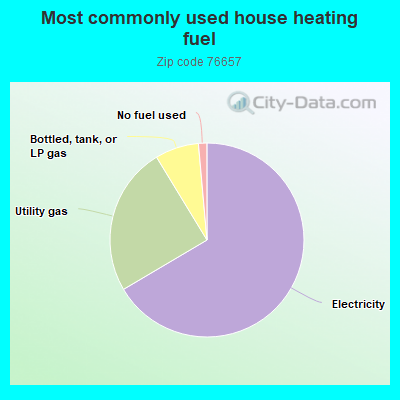
Housing units lacking complete plumbing facilities: 2.1% Housing units lacking complete kitchen facilities: 3.0%
66.5%Electricity
24.8%Utility gas
7.3%Bottled, tank, or LP gas
1.4%No fuel used
Population in 1990: 5,853. Population change in the 1990s: +2,801 (+47.9%).
Place of birth for U.S.-born residents:
This state: 8,110
Northeast: 318
Midwest: 963
South: 1,011
West: 1,084
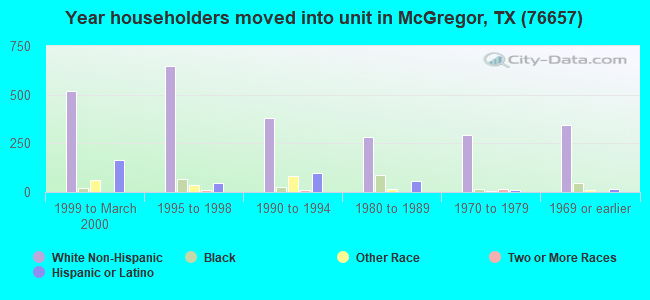
56% of the 76657 zip code residents lived in the same house 5 years ago. Out of people who lived in different houses, 64% lived in this county. Out of people who lived in different counties, 50% lived in Texas.
87% of the 76657 zip code residents lived in the same house 1 year ago. Out of people who lived in different houses, 41% moved from this county. Out of people who lived in different houses, 25% moved from different county within same state. Out of people who lived in different houses, 35% moved from different state.
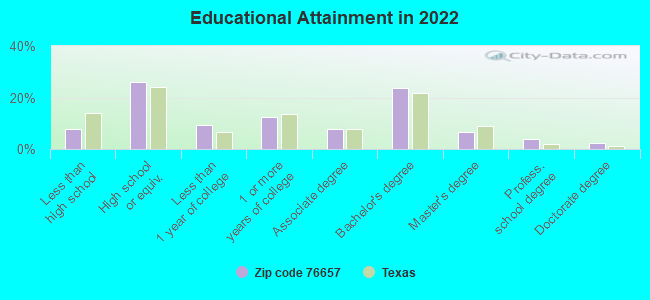
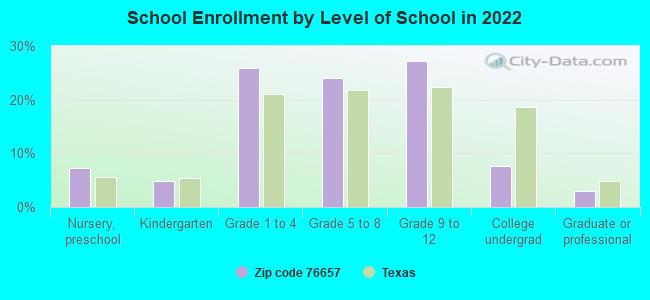
Private vs. public school enrollment:
Students in private schools in grades 1 to 8 (elementary and middle school): 121
Here:
8.0%
Texas:
8.8%
Students in private schools in grades 9 to 12 (high school): 92
Here:
11.2%
Texas:
8.0%
Students in private undergraduate colleges: 32
Here:
14.0%
Texas:
16.2%
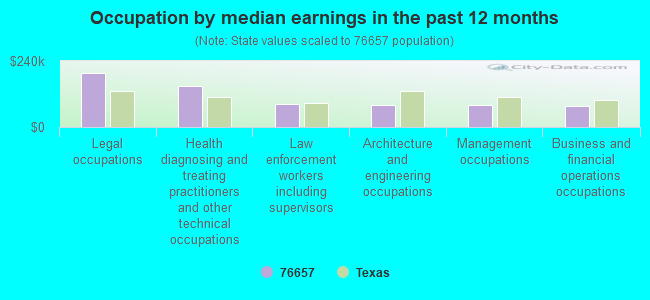
Occupation by median earnings in the past 12 months ($)
196,471Legal occupations
148,246Health diagnosing and treating practitioners and other technical occupations
82,021Law enforcement workers including supervisors
80,284Architecture and engineering occupations
79,318Management occupations
75,344Business and financial operations occupations
Top industries in this zip code by the number of employees in 2005:
Administrative and Support and Waste Management and Remediation Services: Solid Waste Collection (100-249 employees: 1 establishment, 20-49 employees: 1 establishment)
Wholesale Trade: Plumbing and Heating Equipment and Supplies (Hydronics) Merchant Wholesalers (100-249: 1)
Health Care and Social Assistance: Nursing Care Facilities (100-249: 1)
Accommodation and Food Services: Full-Service Restaurants (50-99: 1, 20-49: 1)
Construction: Site Preparation Contractors (50-99: 1, 1-4: 1)
Information: Data Processing, Hosting, and Related Services (50-99: 1)
People in group quarters in 2010:
148 people in nursing facilities/skilled-nursing facilities
People in group quarters in 2000:
217 people in nursing homes
2 people in other noninstitutional group quarters
Fatal accident statistics in 2013:
Fatal accident count: 2
Vehicles involved in fatal accidents: 4
Fatal accidents caused by drunken drivers: 0
Fatalities: 3
Persons involved in fatal accidents: 4
Pedestrians involved in fatal accidents: 0
Fatal accident statistics in 2012:
Fatal accident count: 1
Vehicles involved in fatal accidents: 1
Fatal accidents caused by drunken drivers: 1
Fatalities: 2
Persons involved in fatal accidents: 4
Pedestrians involved in fatal accidents: 0
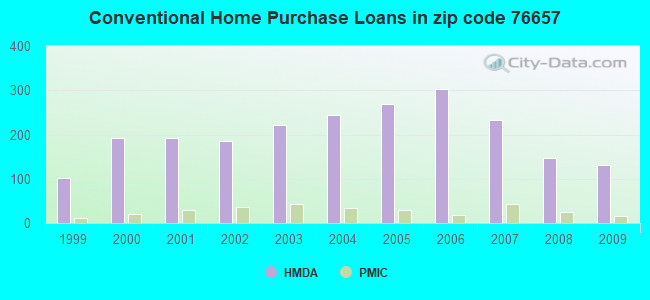
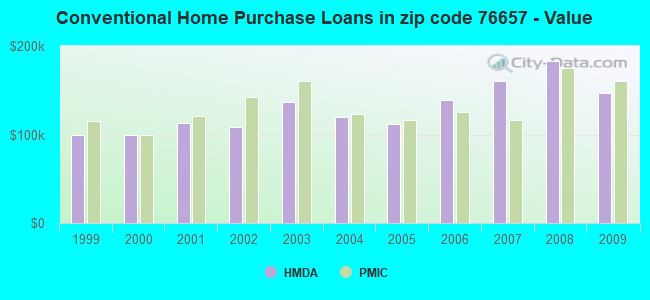
Home Mortgage Disclosure Act Aggregated Statistics For Year 2009 (Based on 6 partial tracts)
A) FHA, FSA/RHS & VA Home Purchase Loans
B) Conventional Home Purchase Loans
C) Refinancings
D) Home Improvement Loans
E) Loans on Dwellings For 5+ Families
F) Non-occupant Loans on < 5 Family Dwellings (A B C & D)
G) Loans On Manufactured Home Dwelling (A B C & D)
Number
Average Value
Number
Average Value
Number
Average Value
Number
Average Value
Number
Average Value
Number
Average Value
Number
Average Value
LOANS ORIGINATED
62
$184,536
132
$147,349
211
$190,881
33
$39,950
2
$78,435
39
$103,852
11
$75,388
APPLICATIONS APPROVED, NOT ACCEPTED
2
$162,955
4
$102,282
10
$209,331
0
$0
0
$0
2
$50,260
2
$44,525
APPLICATIONS DENIED
9
$169,753
7
$70,399
35
$114,743
11
$30,654
0
$0
3
$150,307
7
$51,626
APPLICATIONS WITHDRAWN
0
$0
13
$125,412
25
$158,882
5
$22,300
0
$0
3
$90,873
3
$38,180
FILES CLOSED FOR INCOMPLETENESS
0
$0
0
$0
4
$259,087
3
$58,580
0
$0
0
$0
0
$0
Aggregated Statistics For Year 2008 (Based on 6 partial tracts)
A) FHA, FSA/RHS & VA Home Purchase Loans
B) Conventional Home Purchase Loans
C) Refinancings
D) Home Improvement Loans
E) Loans on Dwellings For 5+ Families
F) Non-occupant Loans on < 5 Family Dwellings (A B C & D)
G) Loans On Manufactured Home Dwelling (A B C & D)
Number
Average Value
Number
Average Value
Number
Average Value
Number
Average Value
Number
Average Value
Number
Average Value
Number
Average Value
LOANS ORIGINATED
47
$150,316
148
$182,811
136
$118,042
47
$53,212
2
$182,760
67
$113,567
18
$43,142
APPLICATIONS APPROVED, NOT ACCEPTED
3
$259,163
12
$181,272
7
$314,537
2
$7,540
0
$0
5
$213,810
3
$58,413
APPLICATIONS DENIED
7
$112,254
13
$102,965
62
$103,989
44
$37,062
0
$0
5
$23,340
7
$42,004
APPLICATIONS WITHDRAWN
7
$126,617
21
$144,827
35
$114,593
10
$117,717
0
$0
3
$52,613
3
$88,333
FILES CLOSED FOR INCOMPLETENESS
1
$71,660
2
$173,620
2
$142,900
2
$32,745
0
$0
0
$0
0
$0
Aggregated Statistics For Year 2007 (Based on 6 partial tracts)
A) FHA, FSA/RHS & VA Home Purchase Loans
B) Conventional Home Purchase Loans
C) Refinancings
D) Home Improvement Loans
E) Loans on Dwellings For 5+ Families
F) Non-occupant Loans on < 5 Family Dwellings (A B C & D)
G) Loans On Manufactured Home Dwelling (A B C & D)
Number
Average Value
Number
Average Value
Number
Average Value
Number
Average Value
Number
Average Value
Number
Average Value
Number
Average Value
LOANS ORIGINATED
59
$119,008
233
$160,629
124
$111,991
59
$47,849
0
$0
52
$61,025
18
$64,387
APPLICATIONS APPROVED, NOT ACCEPTED
4
$73,288
16
$81,409
17
$99,176
9
$36,609
0
$0
6
$62,950
3
$77,870
APPLICATIONS DENIED
7
$107,694
34
$85,490
73
$79,839
40
$28,564
0
$0
9
$38,586
15
$59,991
APPLICATIONS WITHDRAWN
6
$111,590
28
$83,539
39
$104,641
14
$66,131
2
$191,900
3
$63,630
2
$129,320
FILES CLOSED FOR INCOMPLETENESS
0
$0
2
$145,620
4
$169,738
1
$34,380
0
$0
2
$243,000
0
$0
Aggregated Statistics For Year 2006 (Based on 6 partial tracts)
A) FHA, FSA/RHS & VA Home Purchase Loans
B) Conventional Home Purchase Loans
C) Refinancings
D) Home Improvement Loans
F) Non-occupant Loans on < 5 Family Dwellings (A B C & D)
G) Loans On Manufactured Home Dwelling (A B C & D)
Number
Average Value
Number
Average Value
Number
Average Value
Number
Average Value
Number
Average Value
Number
Average Value
LOANS ORIGINATED
38
$117,407
303
$139,027
118
$104,847
44
$40,682
51
$86,610
13
$75,322
APPLICATIONS APPROVED, NOT ACCEPTED
2
$197,925
32
$108,078
18
$123,298
7
$54,496
3
$42,137
8
$52,740
APPLICATIONS DENIED
4
$71,422
51
$90,069
74
$97,630
52
$42,876
12
$44,855
16
$43,355
APPLICATIONS WITHDRAWN
3
$123,100
37
$104,192
41
$91,095
13
$68,307
6
$40,617
3
$49,090
FILES CLOSED FOR INCOMPLETENESS
0
$0
0
$0
9
$99,924
2
$21,110
0
$0
0
$0
Aggregated Statistics For Year 2005 (Based on 6 partial tracts)
A) FHA, FSA/RHS & VA Home Purchase Loans
B) Conventional Home Purchase Loans
C) Refinancings
D) Home Improvement Loans
E) Loans on Dwellings For 5+ Families
F) Non-occupant Loans on < 5 Family Dwellings (A B C & D)
G) Loans On Manufactured Home Dwelling (A B C & D)
Number
Average Value
Number
Average Value
Number
Average Value
Number
Average Value
Number
Average Value
Number
Average Value
Number
Average Value
LOANS ORIGINATED
23
$117,929
269
$111,833
163
$115,026
51
$44,195
2
$41,885
56
$45,525
24
$46,640
APPLICATIONS APPROVED, NOT ACCEPTED
0
$0
33
$64,988
14
$120,914
9
$34,382
0
$0
3
$42,643
12
$46,448
APPLICATIONS DENIED
4
$95,758
43
$72,110
95
$97,296
37
$37,636
0
$0
9
$125,564
20
$66,672
APPLICATIONS WITHDRAWN
5
$57,936
30
$81,927
51
$141,881
13
$125,185
0
$0
5
$79,894
1
$51,780
FILES CLOSED FOR INCOMPLETENESS
0
$0
9
$155,408
26
$142,937
2
$66,765
0
$0
0
$0
0
$0
Aggregated Statistics For Year 2004 (Based on 6 partial tracts)
A) FHA, FSA/RHS & VA Home Purchase Loans
B) Conventional Home Purchase Loans
C) Refinancings
D) Home Improvement Loans
F) Non-occupant Loans on < 5 Family Dwellings (A B C & D)
G) Loans On Manufactured Home Dwelling (A B C & D)
Number
Average Value
Number
Average Value
Number
Average Value
Number
Average Value
Number
Average Value
Number
Average Value
LOANS ORIGINATED
34
$96,336
244
$119,922
172
$120,669
71
$39,335
48
$46,971
21
$53,499
APPLICATIONS APPROVED, NOT ACCEPTED
5
$154,736
16
$173,541
15
$115,033
12
$39,531
2
$225,525
6
$45,643
APPLICATIONS DENIED
5
$71,998
44
$148,204
94
$71,508
36
$22,424
1
$98,170
18
$48,317
APPLICATIONS WITHDRAWN
2
$99,365
19
$102,654
86
$75,754
5
$27,132
0
$0
3
$65,127
FILES CLOSED FOR INCOMPLETENESS
0
$0
2
$45,690
17
$139,234
2
$26,655
0
$0
0
$0
Aggregated Statistics For Year 2003 (Based on 6 partial tracts)
A) FHA, FSA/RHS & VA Home Purchase Loans
B) Conventional Home Purchase Loans
C) Refinancings
D) Home Improvement Loans
F) Non-occupant Loans on < 5 Family Dwellings (A B C & D)
Number
Average Value
Number
Average Value
Number
Average Value
Number
Average Value
Number
Average Value
LOANS ORIGINATED
22
$83,455
221
$136,566
360
$124,195
61
$43,264
57
$37,855
APPLICATIONS APPROVED, NOT ACCEPTED
0
$0
12
$131,276
28
$97,271
9
$35,282
2
$39,600
APPLICATIONS DENIED
2
$125,780
40
$73,412
109
$98,941
33
$23,318
6
$24,298
APPLICATIONS WITHDRAWN
2
$42,050
27
$145,405
87
$121,486
2
$25,680
3
$53,467
FILES CLOSED FOR INCOMPLETENESS
0
$0
2
$87,575
11
$152,845
3
$51,687
0
$0
Aggregated Statistics For Year 2002 (Based on 6 partial tracts)
A) FHA, FSA/RHS & VA Home Purchase Loans
B) Conventional Home Purchase Loans
C) Refinancings
D) Home Improvement Loans
E) Loans on Dwellings For 5+ Families
F) Non-occupant Loans on < 5 Family Dwellings (A B C & D)
Number
Average Value
Number
Average Value
Number
Average Value
Number
Average Value
Number
Average Value
Number
Average Value
LOANS ORIGINATED
40
$73,844
186
$108,592
240
$121,564
63
$21,777
2
$63,205
51
$37,190
APPLICATIONS APPROVED, NOT ACCEPTED
0
$0
7
$101,220
23
$142,998
4
$34,528
0
$0
0
$0
APPLICATIONS DENIED
0
$0
33
$53,798
72
$70,014
25
$23,439
0
$0
3
$54,320
APPLICATIONS WITHDRAWN
3
$115,797
10
$142,796
47
$84,945
3
$22,277
0
$0
2
$54,475
FILES CLOSED FOR INCOMPLETENESS
0
$0
9
$41,604
8
$93,211
0
$0
0
$0
2
$16,755
Aggregated Statistics For Year 2001 (Based on 6 partial tracts)
A) FHA, FSA/RHS & VA Home Purchase Loans
B) Conventional Home Purchase Loans
C) Refinancings
D) Home Improvement Loans
F) Non-occupant Loans on < 5 Family Dwellings (A B C & D)
Number
Average Value
Number
Average Value
Number
Average Value
Number
Average Value
Number
Average Value
LOANS ORIGINATED
36
$67,871
191
$112,818
180
$117,913
42
$24,471
32
$36,137
APPLICATIONS APPROVED, NOT ACCEPTED
3
$86,927
22
$92,965
23
$113,248
4
$40,898
2
$46,285
APPLICATIONS DENIED
4
$57,180
62
$64,586
50
$74,749
10
$32,703
6
$31,265
APPLICATIONS WITHDRAWN
3
$138,753
21
$139,895
48
$97,043
2
$11,425
5
$57,890
FILES CLOSED FOR INCOMPLETENESS
2
$38,075
2
$108,040
2
$84,085
0
$0
0
$0
Aggregated Statistics For Year 2000 (Based on 6 partial tracts)
A) FHA, FSA/RHS & VA Home Purchase Loans
B) Conventional Home Purchase Loans
C) Refinancings
D) Home Improvement Loans
F) Non-occupant Loans on < 5 Family Dwellings (A B C & D)
Number
Average Value
Number
Average Value
Number
Average Value
Number
Average Value
Number
Average Value
LOANS ORIGINATED
31
$70,702
193
$99,056
55
$99,790
35
$25,902
22
$25,699
APPLICATIONS APPROVED, NOT ACCEPTED
0
$0
38
$101,519
4
$73,312
5
$18,296
5
$33,936
APPLICATIONS DENIED
2
$59,845
62
$42,918
46
$80,937
26
$17,702
13
$32,606
APPLICATIONS WITHDRAWN
2
$129,760
11
$70,309
6
$60,977
0
$0
0
$0
FILES CLOSED FOR INCOMPLETENESS
2
$67,300
1
$27,340
6
$70,478
0
$0
0
$0
Aggregated Statistics For Year 1999 (Based on 3 partial tracts)
A) FHA, FSA/RHS & VA Home Purchase Loans
B) Conventional Home Purchase Loans
C) Refinancings
D) Home Improvement Loans
F) Non-occupant Loans on < 5 Family Dwellings (A B C & D)


 Nearest zip codes: 76638, 76712, 76561, 76557, 76643, 76630.